Is There Really a "World Cup Curse" in the Market?

marsbitPubblicato 2026-06-15Pubblicato ultima volta 2026-06-15

Introduzione

Is there really a "World Cup Curse" affecting markets? Historical data shows global equity markets often underperform during the tournament. The S&P 500 has averaged negative returns of -1.5% to -2.11% across 19 World Cups since 1950, with declines in 58% of events. China's Shanghai Composite fell in 71% of tournaments since 1994. Studies confirm reduced trading activity during matches, with volumes dropping significantly, especially when a home nation plays. A team's loss can also lead to negative sentiment and selling pressure in its domestic market the next day. However, the "curse" may be partly attributed to seasonal weakness. Many tournaments are held in June-July, a historically weaker period for stocks ("Sell in May and go away"). The 2022 Qatar World Cup, held in November-December, saw a smaller drop in trading volume compared to summer events, suggesting timing plays a role. The cryptocurrency market's performance during World Cups has been mixed and largely driven by its own major catalysts (e.g., Mt. Gox hack, FTX collapse, halving cycles) rather than the tournament. Investment opportunities have shifted over time. Traditional beneficiaries like TV manufacturers have seen fading returns as streaming platforms become the core viewing channel. Classic consumer plays like beer and sportswear face challenges from changing consumption trends. Newer digital assets, like fractionalized collectible player cards on blockchain, have seen explosive growth. While gambling i...

The 2026 FIFA World Cup is set to kick off on June 11th. For a long time, a theory known as the "World Cup Curse" has circulated in the market, suggesting that during World Cup tournaments, major global stock markets often perform weakly, with trading volume significantly shrinking.

Whether you're ready with beer and peanuts to enjoy the matches or plan to trade in the market while watching, we can examine whether the "World Cup Curse" is a real phenomenon. What lies behind the data, and what are the reasons for this observed phenomenon?

Examining the "World Cup Curse" Through Data

Looking at historical data, the performance of major global stock markets during World Cup periods has generally been poor. Taking the US S&P 500 Index as an example, during the 19 World Cup tournaments from 1950 to 2022, the S&P 500's average expected return during the events was approximately -1.5% to -2.11%.
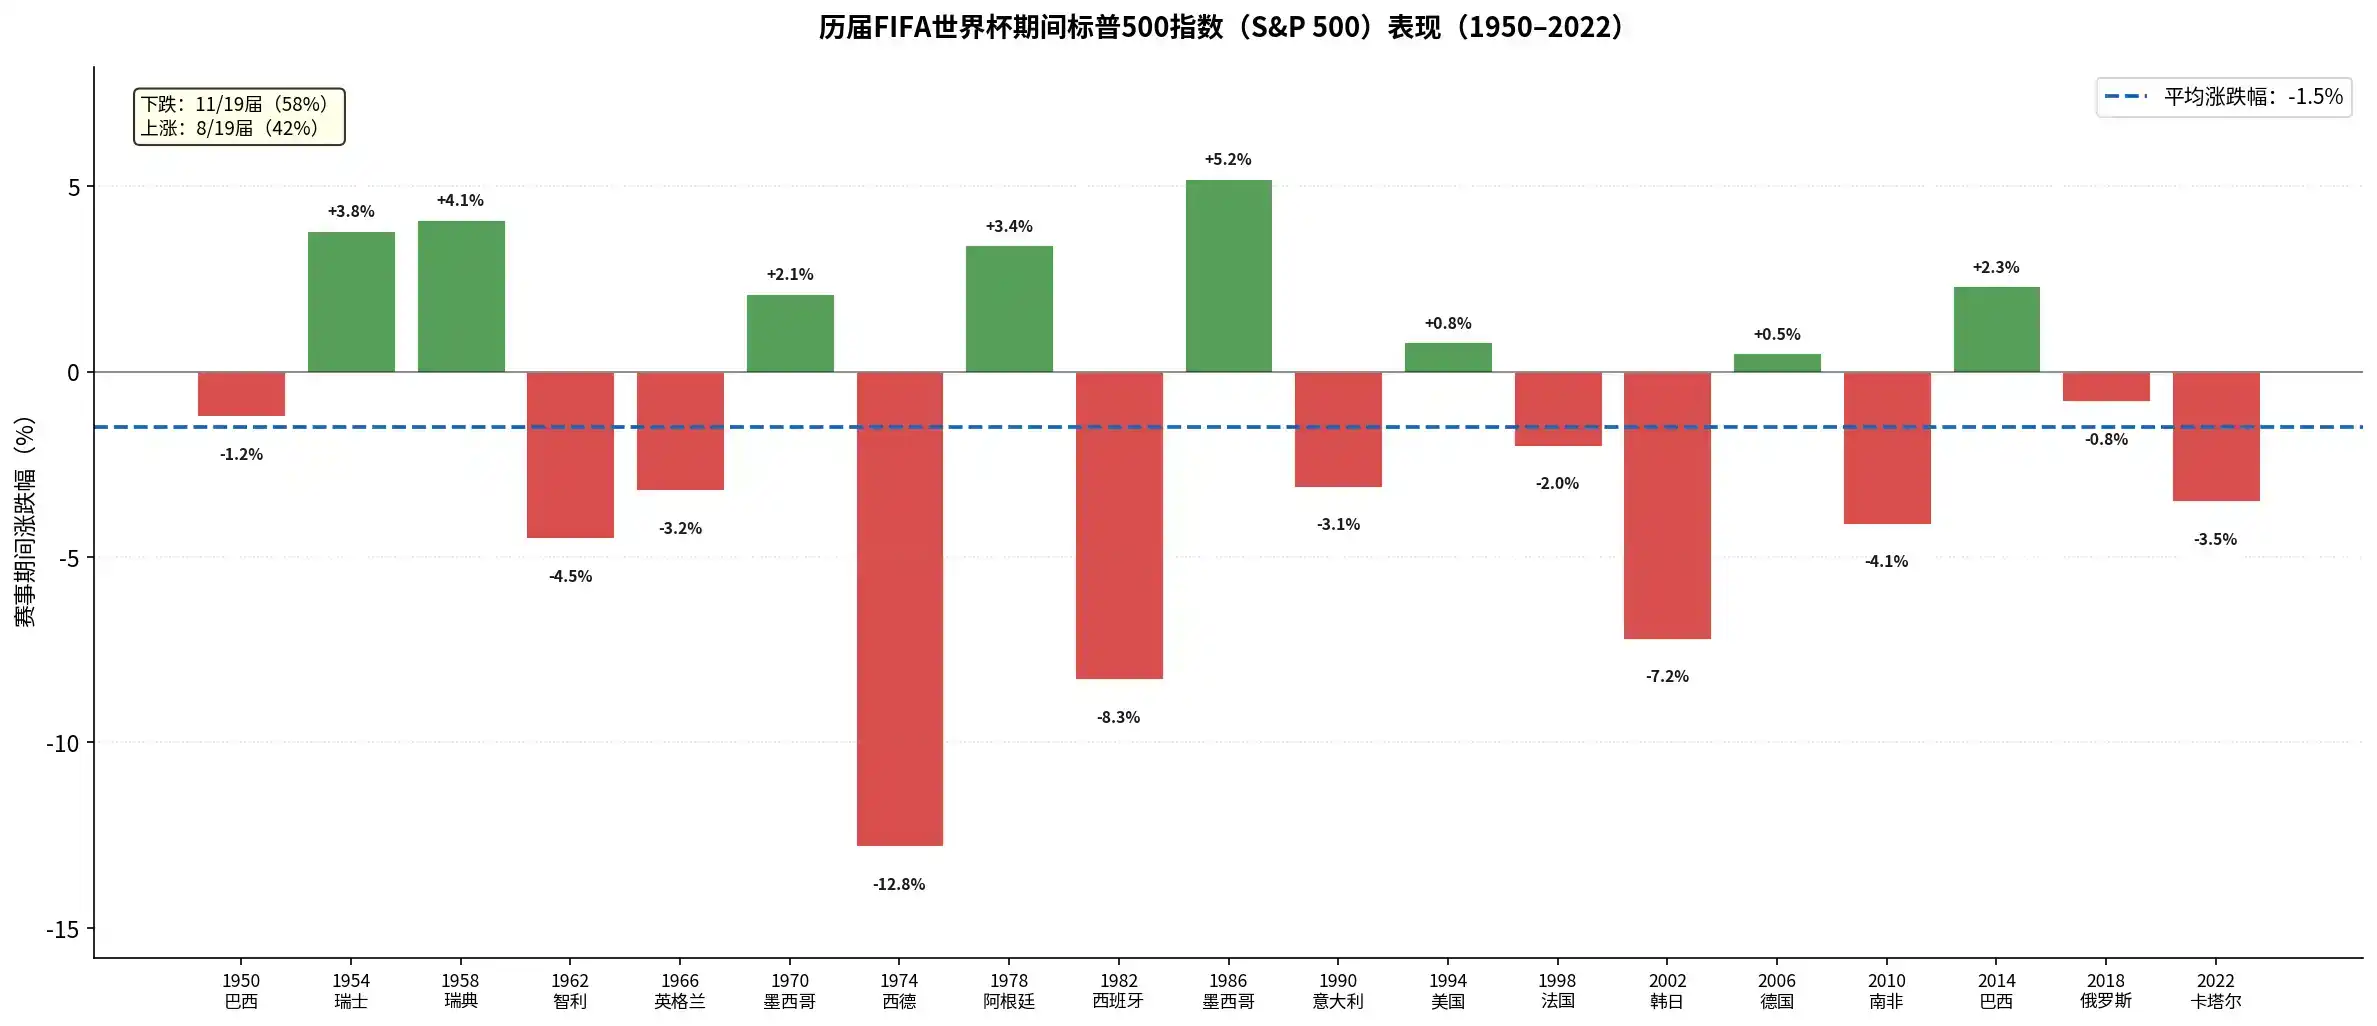
As shown in the chart above, the S&P 500 recorded negative returns in 11 out of the past 19 World Cups (a 58% rate). Notably, in recent years, US stocks declined during the 2010 South Africa World Cup (-4.1%), the 2018 Russia World Cup (-0.8%), and the 2022 Qatar World Cup (-3.5%).

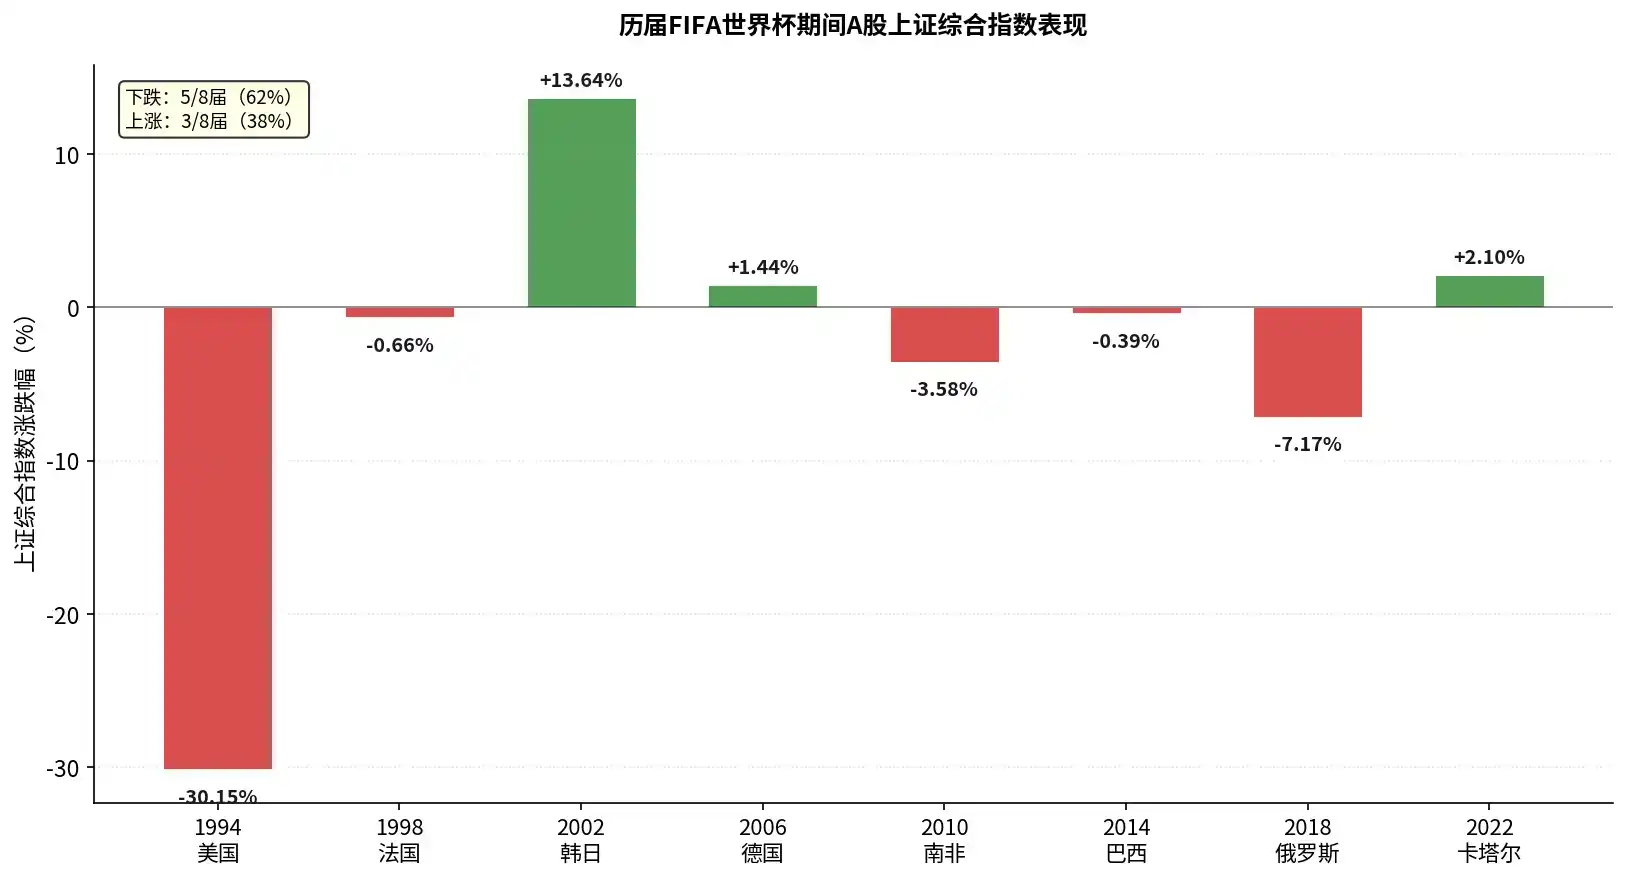
The A-share market has not been spared either. Statistics show that in the 7 World Cup periods since 1994, the Shanghai Composite Index fell 5 times, a decline probability as high as 71%. Among them, the index plunged 30.15% during the 1994 US World Cup and fell 7.17% during the 2018 Russia World Cup. It only posted gains during the 2002 World Cup (stimulated by favorable policies) and the 2006 World Cup (during a super bull market).
Now let's look at the cryptocurrency market:

- 2010 South Africa World Cup period: rose about 15%

- 2014 Brazil World Cup period: fell about 7.1%

- 2018 Russia World Cup period: fell about 16.5%

- 2022 Qatar World Cup period: rose about 4.3%

With the data presented, let's analyze the reasons.

Causes of the "World Cup Curse"

Does the World Cup really have a significant impact on market performance? It has an impact, but not a major one.

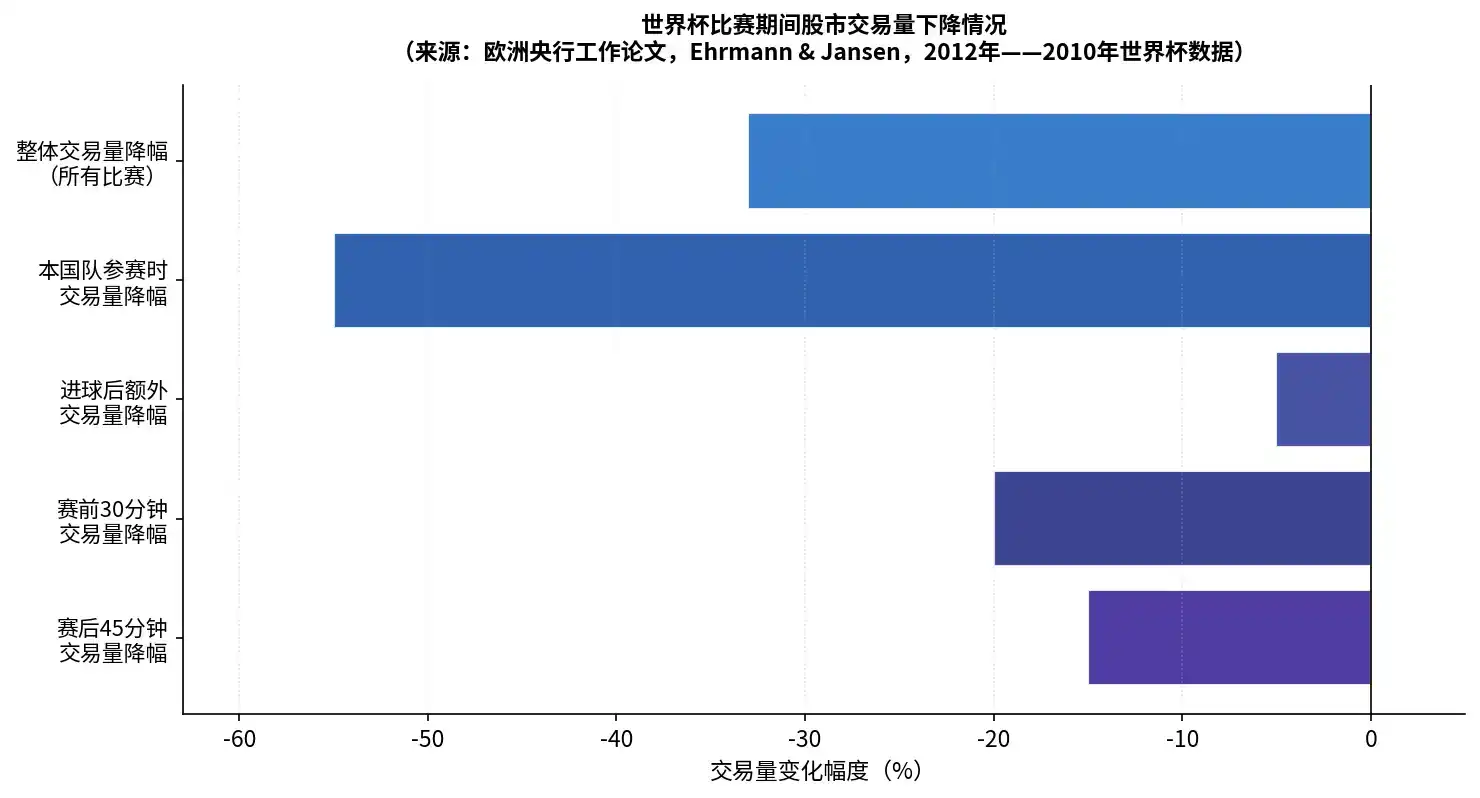
First, looking at the impactful part. A paper from the European Central Bank (ECB) analyzed minute-level trading data from 15 international stock exchanges during the 2010 World Cup. The study found that stock market trading activity indeed decreased during World Cup matches:

- Overall trading volume dropped by about 33% compared to normal levels.

- When the home country's national team was playing, trading volume plummeted by 55%, and the number of trades fell by 45%.

- Key events in matches (like goals) led to a further 5% drop in trading volume.
Match results also affect the mood of fans in various countries. Research found that when a country's national team lost a World Cup match, that country's stock market often showed significant negative abnormal returns on the next trading day (up to 49 basis points). This negative sentiment from a match loss does spill over into investment decisions, leading to market sell-offs.

But why is the impact considered not major? Wall Street has an old adage, "Sell in May and go away." The stock market itself exhibits seasonal patterns, with May through October typically being the weakest performance period of the year (especially June-August). Traditional summer World Cups (June-July) happen to fall within this seasonal lull window.
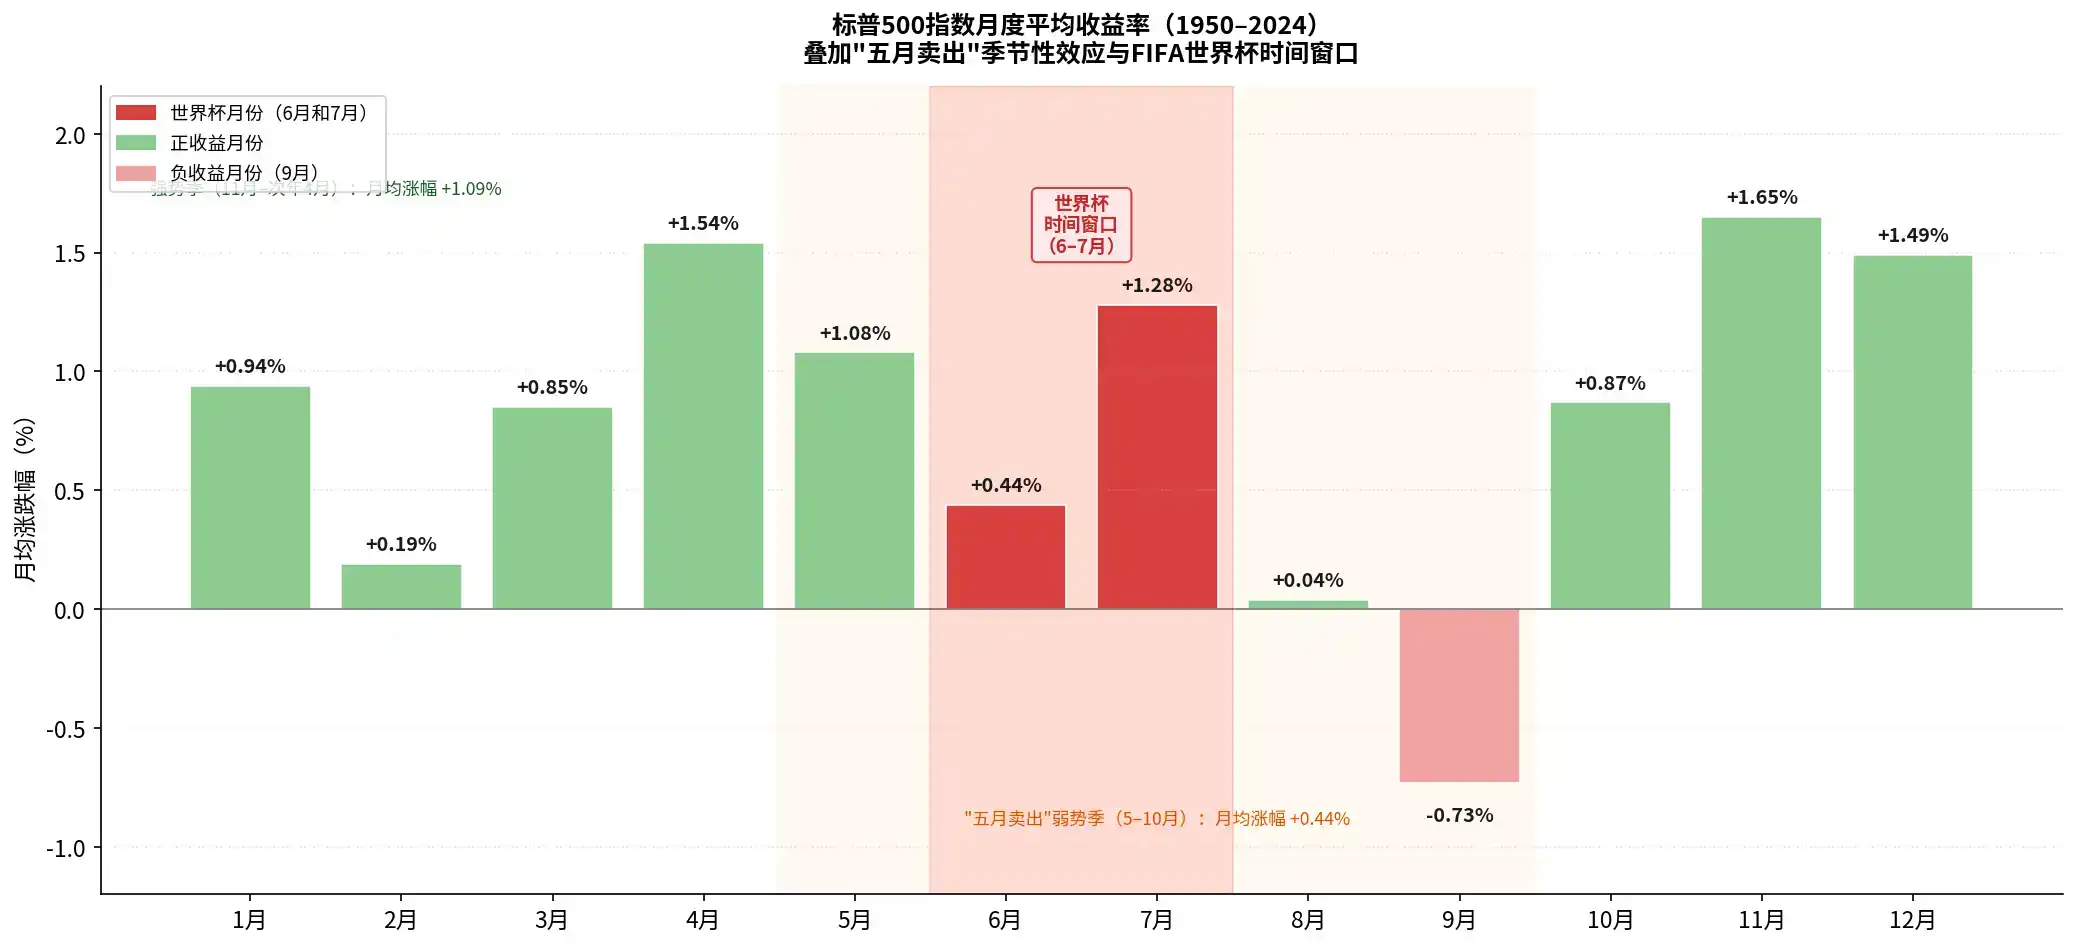
As shown in the chart above, among the average monthly returns throughout the year, June (+0.44%) and August-September are often the most lackluster or even negative months. This means traditional summer World Cups (typically held from mid-June to mid-July) coincide with the window in the year when the stock market has the least upward momentum.

The 2022 Qatar World Cup was the first World Cup historically held in the Northern Hemisphere winter (November-December). This unique timing provides a "controlled experiment" to test the above theory.
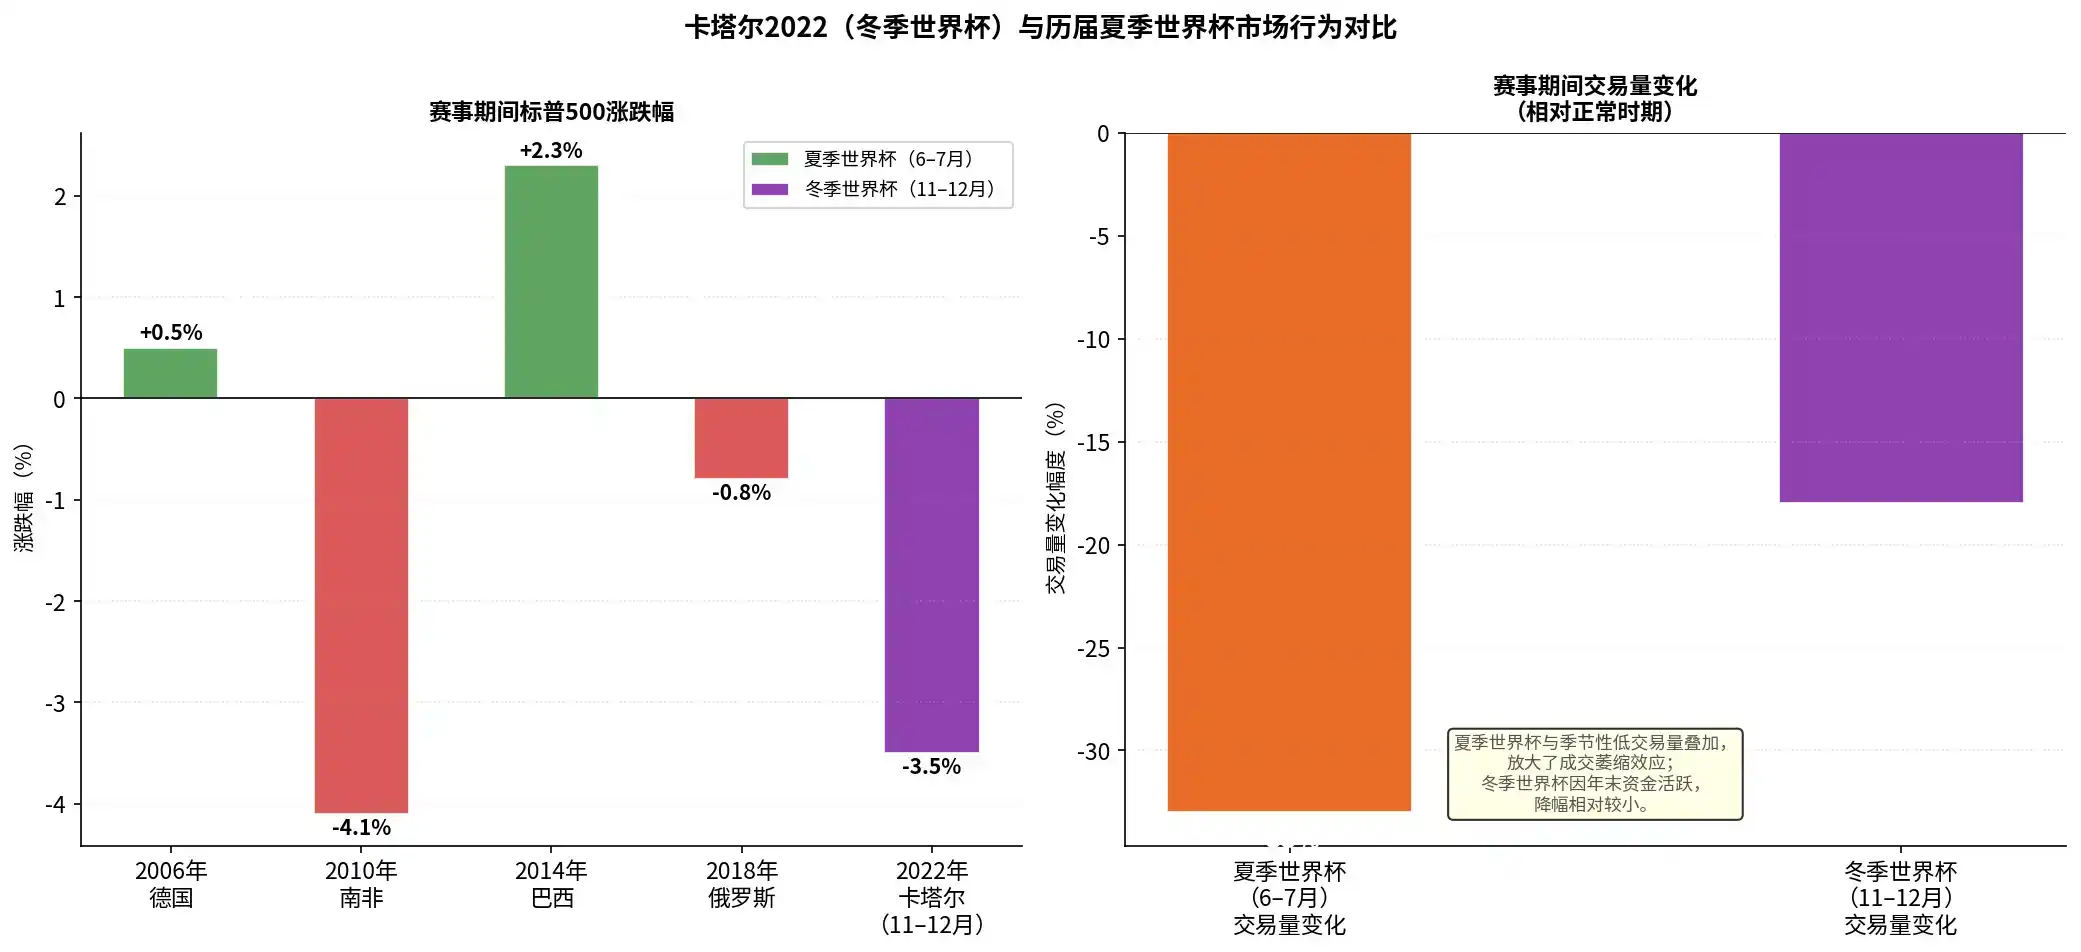
Although the S&P 500 still fell 3.5% during the Qatar World Cup (mainly driven by the Fed's aggressive rate hikes), looking at trading activity, the decline in trading volume during the winter World Cup (about -18%) was significantly smaller than during traditional summer World Cups (-33%). This suggests that when the World Cup is detached from the summer lull, its liquidity-draining effect on the market weakens. This also indicates that a significant portion of the "World Cup Curse" should be attributed to the seasonal low of June-July itself.

Compared to the stock market, the cryptocurrency market better proves that the World Cup's influence on markets isn't significant. From Bitcoin's inception to now, during the 4 World Cups, its price movements can actually be traced to more direct catalysts:

- 2010 South Africa World Cup: On May 22, 2010, a story we're all familiar with happened—programmer Laszlo Hanyecz used 10,000 bitcoins to buy two pizzas, completing Bitcoin's first real-world goods transaction, giving it initial real-world value consensus. Three days after the World Cup closing ceremony (July 17, 2010), the famous Mt.Gox exchange officially launched, marking Bitcoin's entry into the era of organized trading.

- 2014 Brazil World Cup period: Bitcoin was in a bear market following the burst of the 2013 bull market (which peaked above $1,100). In February 2014, Mt.Gox, then the world's largest Bitcoin exchange, declared bankruptcy after losing hundreds of thousands of bitcoins to a hack, dealing a devastating blow to the entire industry. During the World Cup, market sentiment remained fragile. Additionally, on June 27, the US Department of Justice auctioned nearly 30,000 bitcoins seized from the "Silk Road," further increasing selling pressure and uncertainty in the market.

- 2018 Russia World Cup period: A bear market adjustment following the end of the 2017 bull run. The ICO bubble had burst, and global regulation was tightening comprehensively. During the World Cup, the crypto market faced continuous negative news. On June 22, the major Korean exchange Bithumb was hacked, losing $30 million. In early July, the US SEC again delayed/rejected multiple Bitcoin ETF applications.

- 2022 Qatar World Cup period: In early November 2022 (the week before the World Cup opening), FTX collapsed. Meanwhile, the Fed announced a 50-basis-point rate hike on December 13, with continued tightening of macro liquidity, adding insult to injury.

It's also important to consider that Bitcoin, as an asset traded 24/7 globally, is less affected by traditional seasonal holiday patterns. Its own 4-year "halving cycle" is very pronounced. In the face of macro liquidity and its own cyclicality, the World Cup effect is essentially negligible.

Investment Opportunities During the World Cup

With technological advancement and changes in consumption habits, the landscape of World Cup beneficiary industries has changed over the past two decades (2006-2026).

In the past, we all watched the World Cup on TV. During the 2006 and 2010 World Cups, traditional TV and set-top box manufacturers often achieved significant excess returns.

But by the 2018 Russia World Cup, although traditional TV broadcasting rights revenue still accounted for a large portion, the excess returns for TV manufacturers had dropped to 0. By 2022, domestic TV sales during the World Cup decreased rather than increased, with the industry seeing both volume and price declines. Related listed companies' stock prices also underperformed the broader market.
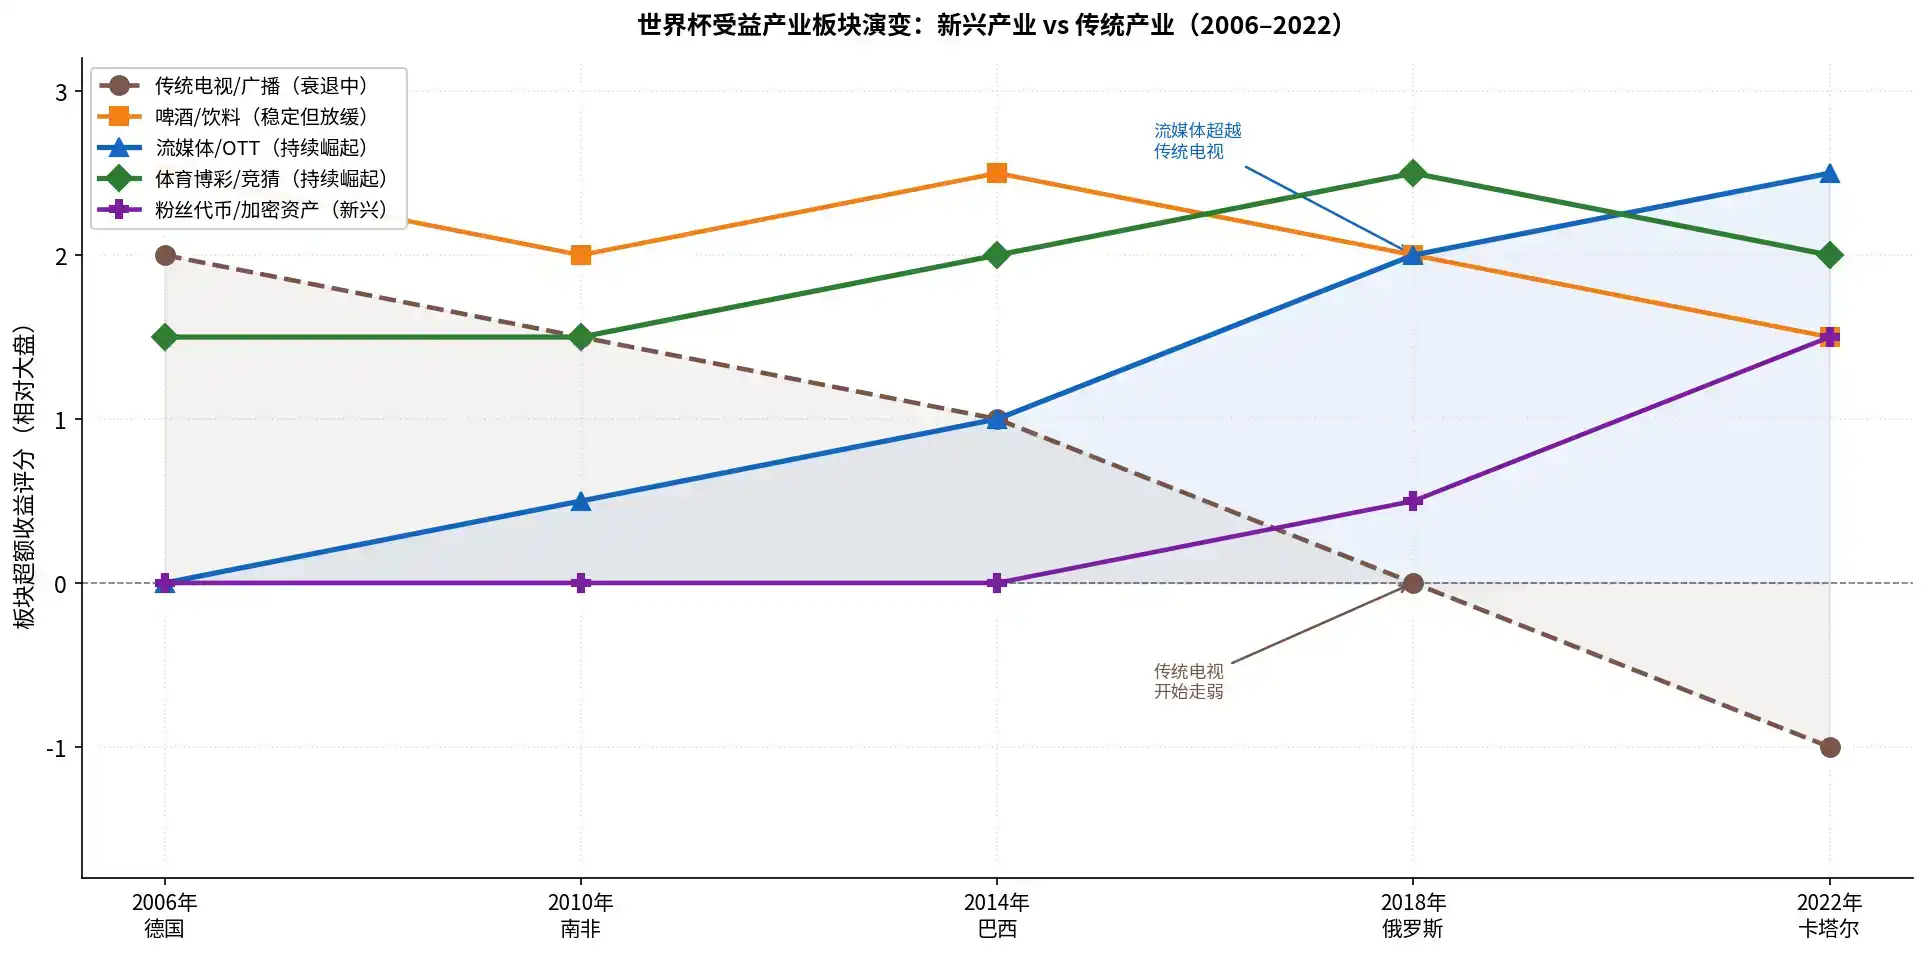
Streaming has officially replaced traditional TV as the core channel for watching the World Cup. The 2022 Qatar World Cup set a new record for streaming viewership. If you're bullish on World Cup viewership, perhaps more attention should be paid to streaming companies with exclusive broadcasting rights that can convert viewership into revenue.

Beer and sporting goods (like Nike, Adidas) are classic World Cup consumer categories, and their sector performance has been stable across past World Cups, but they also face slowing growth challenges in recent years.

Data from investment bank Jefferies shows that global beer sales grew by 3.6% during both the 2006 and 2010 World Cups. However, data from IWSR indicates that from 2014 to 2024, global overall beer consumption actually fell by 3%, with younger generations leaning more towards low-alcohol or alcohol-free beverages.

This means stocks like Budweiser and Tsingtao aren't hopeless, but new beverage stocks, new-style bars popular with young people, etc., might also perform well.

And compared to buying jerseys and shoes, young people might prefer trading cards, which can highlight advantages on-chain. For example, on the Base chain's fractionalized card platform Grail, the token price for Cristiano Ronaldo cards has surged nearly a hundredfold since May 5, and the token price for Kylian Mbappé cards has risen nearly 300-fold since May 5.

Sports betting is also a classic World Cup beneficiary sector, but the growth of prediction markets has been very rapid as well, though there aren't very good investment vehicles for prediction markets yet.

Conclusion

For a good World Cup viewing experience, stepping away from the market to relax is actually a good choice.

Israeli economists Guy Kaplanski and Haim Levy published a paper in the *Journal of Financial and Quantitative Analysis* in 2010 (cited over 261 times), which stated:

"The average return of the US stock market during World Cup periods is -2.58%, while the average return for all trading days in the same periods is +1.21%. The most natural investment strategy is to short stocks before the World Cup kicks off, which would further reinforce the stock price decline effect."

Although there's no famous instance of directly liquidating positions due to the World Cup, the World Cup window is indeed a period of poor liquidity. Regardless of the specific reasons for market movements being directly related to the World Cup, enjoying the World Cup itself might be the best defensive posture for facing a period of weaker market liquidity.


Domande pertinenti

QWhat is the 'World Cup Curse' in financial markets, and what does historical data show about its effect on major stock indices?

AThe 'World Cup Curse' refers to the observed phenomenon where global major stock markets tend to underperform and experience a significant drop in trading volume during the FIFA World Cup tournament. Historical data shows that during the 19 World Cups from 1950 to 2022, the S&P 500 index had an average expected return of approximately -1.5% to -2.11%, with negative returns recorded in 11 out of 19 instances (58%).

QAccording to the article, what are the two main reasons discussed for the existence of the 'World Cup Curse'?

AThe article discusses two main reasons: 1) Direct impact: Reduced market activity as investor attention shifts to matches. Studies show trading volume drops significantly, especially during games involving the home country. Also, negative investor sentiment following a national team's loss can lead to selling pressure. 2) Seasonal factors: Traditional summer World Cups (June-July) coincide with a historically weak seasonal period for stock markets, such as the 'Sell in May and go away' pattern, which naturally depresses performance.

QHow did the 2022 Qatar Winter World Cup serve as a 'controlled variable experiment' regarding the curse?

AThe 2022 Qatar World Cup, held in November-December, served as a 'controlled variable experiment' because it was the first World Cup not held in the traditional summer period. While the S&P 500 still fell 3.5% (primarily due to aggressive Fed rate hikes), the decline in trading volume (about -18%) was significantly smaller than the average drop seen during summer World Cups (-33%). This suggests the seasonal market weakness in summer is a major contributing factor to the curse.

QWhat shift in beneficiary industries for the World Cup has occurred over the past two decades, as mentioned in the article?

AOver the past two decades (2006-2026), the beneficiary industry landscape has shifted from traditional TV and television set manufacturers to streaming media platforms. While traditional TV sponsorships were key in 2006-2010, by 2022, streaming platforms with exclusive broadcasting rights became the core channel for viewership. Traditional sectors like beer and sportswear remain stable but face growth challenges, while new trends like tokenized digital collectibles (e.g., crypto-based player cards) have emerged.

QWhat investment strategy is suggested by the research from Guy Kaplanski and Haim Levy, and what is the article's concluding advice for investors during the World Cup?

AThe research by Kaplanski and Levy suggests a natural investment strategy of shorting stocks before the World Cup begins, based on the historically negative average returns during the tournament. The article's concluding advice is that, regardless of the direct causal link to the World Cup, the period is characterized by lower liquidity. Therefore, disengaging from the market to enjoy the World Cup itself might be the best defensive stance for investors.

Letture associate

After Three Consecutive Quarters of Decline, Can the Crypto Market Find a Window for Stabilization in Q3?

The cryptocurrency market has just concluded its worst-performing quarter since 2022, with total capitalization dropping 12.6% to $2.1 trillion. All core metrics indicate capital is leaving the sector, not just rotating within it. Bitcoin fell 14.2% and Ethereum dropped 25.4% in Q2, breaking their previous correlation with US tech stocks. A key driver is the reversal in US spot Bitcoin ETF flows, which saw a net outflow of approximately $4.67 billion in Q2, including a record monthly outflow near $4.5 billion in June. While recent data suggests long-term holders are accumulating again, sustained ETF outflows mean continued selling pressure. Market focus is now singularly on the Federal Reserve. The upcoming July FOMC meeting is seen as the most critical event for Q3. A dovish signal could support Bitcoin reclaiming a $68,000-$84,000 range, while a hawkish stance might establish a new trading band around $50,000-$56,000. Additionally, regulatory uncertainty persists, with the progress of the crucial *CLARITY Act* stalling in the Senate, reducing its perceived 2026 passage probability to 40-45%. Despite the broad downturn, a few sectors showed growth. Prediction markets saw nominal volume surge 48.7% year-over-year to $113.8 billion, and tokenized collectibles transaction volume rose 143% quarterly to $1.4 billion. The Real-World Asset (RWA) tokenization sector also continued steady growth, now representing ~$28.1 billion in on-chain value. The market's foundation for an extreme crash appears limited, with Bitcoin price hovering near its 200-week moving average. However, the trading paradigm has shifted from narrative-driven speculation to decisions based on price action, policy developments, and interest rate expectations, making a broad sentiment-driven rally unlikely in the near term.

marsbit47 min fa

After Three Consecutive Quarters of Decline, Can the Crypto Market Find a Window for Stabilization in Q3?

marsbit47 min fa

BIT Trading Moment: BTC Still Suppressed by Weekly 200 EMA, Rejection May Restart Decline; Storage and Semiconductors that Surged Last Night Begin Falling in Evening Trading

**Crypto & Stock Market Wrap: Bitcoin Tests Resistance, Stocks Retreat After AI Surge** Bitcoin consolidates around $66,000, facing key resistance near $68,000—an area seen as a major psychological and technical hurdle where previous rallies have failed. Analysts note the cryptocurrency is caught between its 200-week moving average (~$63,333) and 200-week EMA (~$68,328). A clear break above $68k is needed to signal a stronger bullish trend, while a rejection could lead to a retest of $63k support. Market sentiment remains cautious, with low futures open interest pointing to a low-liquidity rebound rather than a full bull market. Bitcoin spot ETFs saw another $203 million inflow. US stock futures pointed lower after a strong Tuesday session led by a massive rebound in semiconductors and memory stocks. The rally was fueled by renewed optimism about AI-driven hardware demand, with Micron, SanDisk, and SK Hynix surging. However, those gains reversed in pre-market trading. Super Micro Computer (SMCI) soared over 20% after hours on strong guidance and a record backlog. Other standouts included Rocket Lab and nuclear energy plays Oklo and X-Energy. Rising oil prices (Brent above $91) and climbing Treasury yields (10-year near 4.64%), however, are reigniting inflation concerns and acting as a headwind for equities. In Asia, markets were mixed. South Korea's KOSPI pared early gains to close slightly higher as semiconductor stocks like SK Hynix gave back initial surges. Japan's Nikkei edged lower as the yen hit a fresh 38-year low against the dollar, raising fears of potential market intervention. Key events to watch include the Samsung Galaxy launch, AMD's AI event, and a slew of major tech earnings from Alphabet, Tesla, and IBM after the close on Wednesday, followed by the ECB meeting and Intel's earnings on Thursday.

marsbit55 min fa

BIT Trading Moment: BTC Still Suppressed by Weekly 200 EMA, Rejection May Restart Decline; Storage and Semiconductors that Surged Last Night Begin Falling in Evening Trading

marsbit55 min fa

Former CFTC Chairman, Circle President Tarbert: Preaching Long-Termism While Cashing Out $30 Million Himself

Former CFTC Chairman and Circle President Heath Tarbert has consistently advocated for a long-term vision in public, urging patience from investors as Circle’s stock price has fallen significantly from its peak. However, it has been revealed that since Circle’s IPO, Tarbert has continuously sold his CRCL shares through pre-arranged trading plans, cashing out approximately $30 million, without making any public market purchases. This contrast between his public messaging and personal actions has drawn criticism. Tarbert joined Circle in July 2023 as Chief Legal Officer, leveraging his regulatory experience to help guide the company through its IPO and expansion. Despite promoting stablecoins as long-term infrastructure, he established a 10b5-1 trading plan just before Circle went public, leading to substantial stock sales over the following year. In March 2026, he initiated another plan to sell more shares. His career trajectory highlights a pattern of moving between high-level regulatory roles and influential positions in the financial sector. After resigning as CFTC Chairman in early 2021, he joined Citadel Securities as Chief Legal Officer just 27 days later, during a period of intense regulatory scrutiny for the firm. He later joined Circle, aiding its efforts to navigate regulatory challenges for its public listing. While Tarbert's expertise in policy and compliance is valuable to companies like Circle, his actions—advocating long-term confidence while personally divesting—raise questions about the alignment between his public statements and his private financial decisions, leaving investors who followed his advice to bear the market risks.

marsbit1 h fa

Former CFTC Chairman, Circle President Tarbert: Preaching Long-Termism While Cashing Out $30 Million Himself

marsbit1 h fa

Gate Research Institute: The 'Wall Street-ization' Wave of Crypto Financial Products – Competition or Integration?

The article titled "Gate Research Institute: Are Crypto Financial Products Sparking a 'Wall Street' Wave—Competition or Convergence?" explores the evolving relationship between the crypto ecosystem and traditional finance (TradFi). The piece begins by reflecting on Bitcoin's original 2009 vision of decentralization, disintermediation, and moving away from banks. It then contrasts this with the 2024 landscape, where key crypto assets like Bitcoin are increasingly held through Wall Street products like ETFs issued by giants like BlackRock. The article questions whether this signifies that TradFi is systematically taking over the rights to issue, price, custody, and distribute crypto financial assets. The core argument is that this is not a zero-sum takeover but rather a bidirectional convergence where each side addresses the other's weaknesses. Crypto offers 24/7 global markets, programmable settlement, and open access but lacks compliant channels, institutional-grade custody, deep fiat liquidity, and mainstream distribution. TradFi possesses these but is constrained by legacy systems, limited operating hours, and slow settlement. Two primary convergence paths are highlighted: * **Path A (CEX to TradFi):** Exemplified by Gate, which has progressed from offering tokenized stocks and CFDs to providing direct, real stock trading (US, Hong Kong, South Korea) within its platform, using USDT. * **Path B (TradFi to Crypto):** Exemplified by Robinhood, which has integrated crypto trading, acquired exchanges like Bitstamp, and is moving traditional assets like stocks onto the blockchain via tokenization and its own Layer 2. Both paths are ultimately competing to become the next-generation, unified financial account—a "super account" where users can seamlessly trade cryptocurrencies, stocks, ETFs, RWA (Real World Assets), and tokenized treasury products in one interface. The growth of RWA and tokenized treasuries (e.g., BlackRock's BUIDL) is presented as the asset-layer fusion, providing stable, yield-bearing assets on-chain and acting as a bridge between the two worlds. In conclusion, the "Wall Street-ization" of crypto is framed as a mutual transformation. Decentralized ideals persist in the protocol layer, while at the application layer, a more efficient, global, and accessible unified capital market is emerging from this convergence. The future competition lies not between crypto exchanges and stockbrokers, but between platforms vying to offer the most comprehensive asset coverage, liquidity, and user experience within a single account.

marsbit1 h fa

Gate Research Institute: The 'Wall Street-ization' Wave of Crypto Financial Products – Competition or Integration?

marsbit1 h fa

Trading

Spot
活动图片




