Hyperliquid with Trillions in Trading Volume: How to Break the Thin Profit Curse

比推Pubblicato 2025-12-18Pubblicato ultima volta 2025-12-18

Introduzione

Hyperliquid, a decentralized exchange, processes massive trading volumes (annualized $617B in perps) but captures minimal fees—only ~3.9 bps—compared to retail-centric platforms like Coinbase (35.5 bps) and Robinhood (33.5 bps). This reflects a structural divide: Hyperliquid operates at the "market layer" (like Nasdaq), offering low-margin execution, while brokers profit from higher-margin services like custody, lending, and subscriptions. Hyperliquid’s open architecture—via Builder Codes (third-party frontends) and HIP-3 (external product deployment)—fuels growth but risks commoditizing its core exchange, as third parties capture user relationships and routing leverage. Recent strategic shifts aim to defend its position: halting subsidies for external frontends, launching USDH (a native stablecoin) to capture reserve yields, and introducing portfolio margin to earn interest on lending. The protocol is evolving toward a hybrid model—balancing open infrastructure with broker-like revenue streams (e.g., balance-based earnings)—to avoid being trapped in low-margin wholesale execution. The key challenge for 2026 is achieving this shift without undermining its ecosystem-friendly approach.

Source: BlockRearch

Original Title: Hyperliquid crossroads: Robinhood or Nasdaq economics

Compiled and Edited by: BitpushNews


Hyperliquid is currently in the phase of clearing Nasdaq-level perpetual contract (Perp) trading volume, but earning only thin profits. Over the past 30 days, it cleared $205.6 billion in notional value of perpetual contracts (annualized quarterly rate of $617 billion), yet generated only $80.3 million in fees, with a monetization rate of just about 3.9 basis points.

Its monetization model resembles more of a wholesale execution venue.
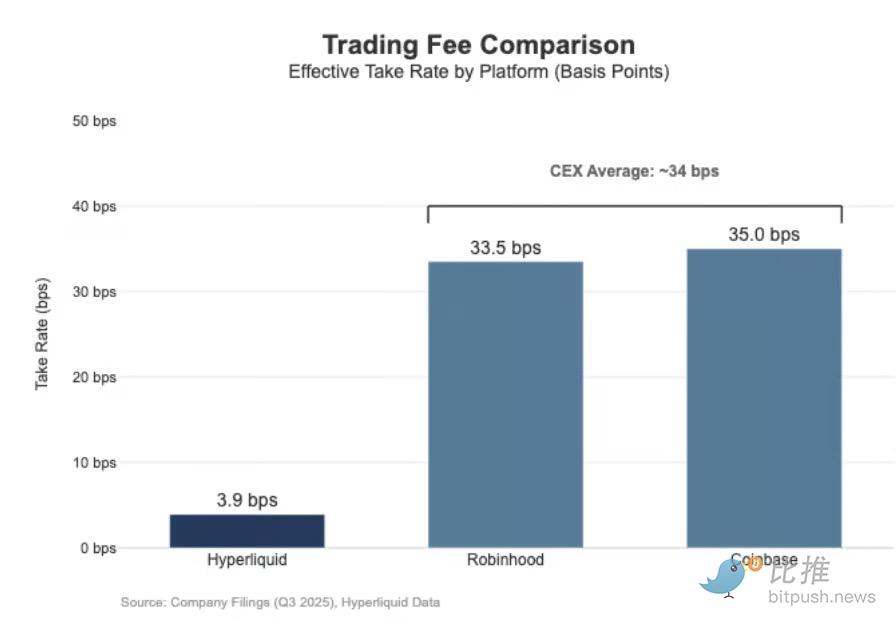
In comparison, Coinbase reported its Q3 2025 trading volume as $295 billion, with trading revenue of $1.046 billion, implying a Take Rate of 35.5 basis points.

Robinhood exhibits similar retail monetization characteristics in the cryptocurrency space: its $80 billion in cryptocurrency notional trading volume brought in $268 million in trading revenue, implying a monetization rate of 33.5 basis points; meanwhile, its stock trading notional value for Q3 2025 was $647 billion.

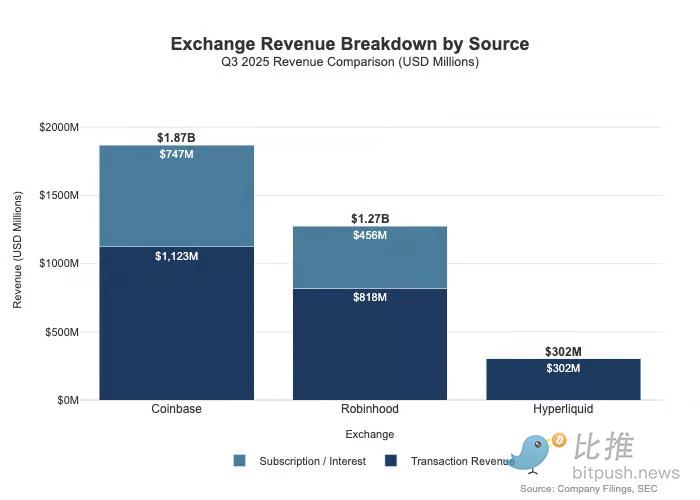
The gap is even larger than what the fee rates suggest, as retail platforms possess multi-dimensional monetization paths. In Q3 2025, Robinhood generated $730 million in transaction-based revenue, plus $456 million in net interest income and $88 million in other revenue (primarily driven by Gold subscription services).

In contrast, Hyperliquid currently relies heavily on trading fees, and these fees are structurally constrained at the protocol level to single-digit basis points.
The Difference in Positioning: Distributor vs. Market Layer

This difference is best explained by positioning: Coinbase and Robinhood belong to the broker/distribution business, monetizing through balance sheets and subscription services; whereas Hyperliquid is closer to the exchange layer (market layer). In traditional market structure, the profit pool is divided between these two layers.

The core divide in traditional finance (TradFi) is "Distribution" vs. "Market":

  • Distribution Layer (e.g., Robinhood and Coinbase): They own the customer relationship and occupy the high-margin环节.

  • Market Layer (e.g., Nasdaq): They exist as exchanges, with pricing power structurally constrained, and execution businesses tend towards "commoditized" economics due to competition.

1. Broker-Dealer = Distribution + Customer Balance Sheet

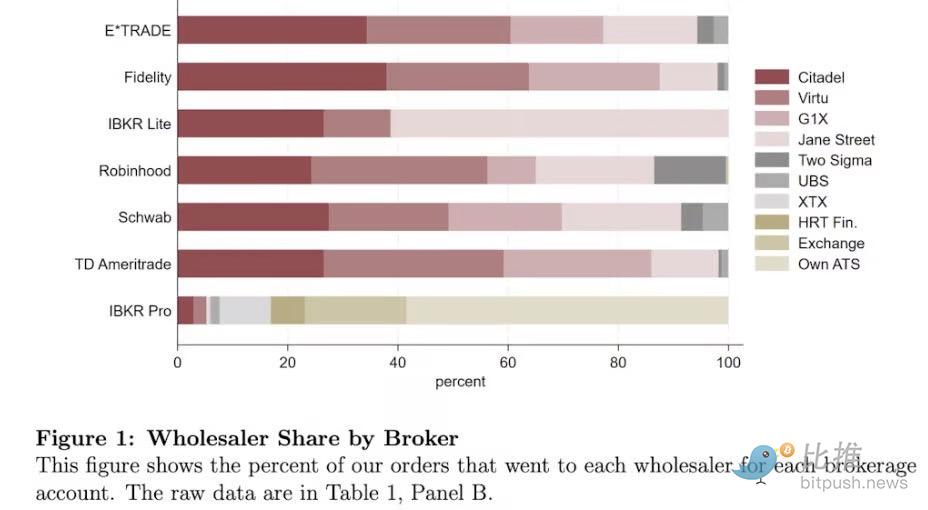
Brokers own the customer relationship. Most users do not access Nasdaq directly but enter the market through brokers. Brokers handle deposits, custody, margin/risk management, customer service, and tax documents, then route orders to various trading venues. This ownership of the relationship creates monetization capabilities beyond trading:

  • Balances: Cash sweep spreads, margin lending, securities lending.

  • Packaging: Subscription services, bundles, co-branded cards/advisory services.

  • Routing Economics: Brokers control the flow and can embed payments or revenue-sharing mechanisms in the routing chain.

    This is why brokers' profitability often surpasses that of trading venues: the profit pool is concentrated where distribution and balances reside.

2. Exchange = Matching + Rulebook + Infrastructure (Constrained Take Rate)

Exchanges operate the venue: matching, setting market rules, deterministic execution, and connectivity. Their monetization methods include:

  • Trading Fees: Compressed by competition in high-liquidity products.

  • Rebates/Liquidity Programs: Often forced to return most nominal fees to makers to attract liquidity.

  • Market Data, Connectivity/Co-location Services.

  • Listing Fees and Index Licensing.

Robinhood's routing logic clearly demonstrates this architecture: the broker (Robinhood Securities) owns the users and routes orders to third-party market centers, with routing revenue shared throughout the chain. Distribution is the high-margin layer: it controls customer acquisition and the monetization domains around execution (payment for order flow, margin, securities lending, subscriptions).

Nasdaq is the thin-margin layer. Its product is commoditized execution capability and queue access, and its pricing power is mechanically suppressed because venues need to pay maker rebates to win liquidity, regulation caps access fees, and routing is extremely flexible. In Nasdaq's disclosures, this is reflected in net cash equity capture per share of just fractions of a cent.
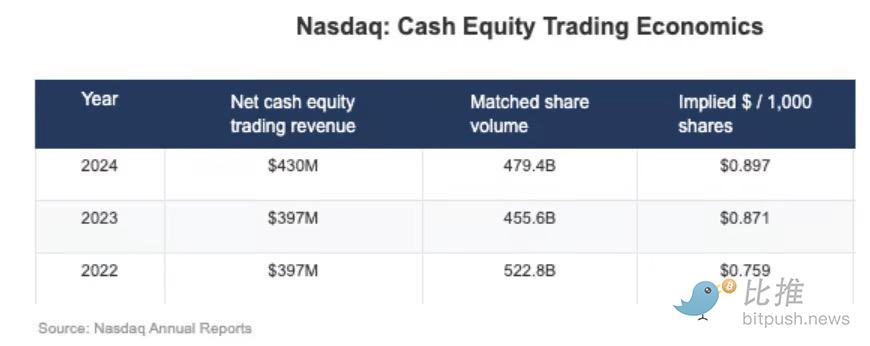
The strategic consequence of these low margins is evident in Nasdaq's revenue mix. In 2024, its Market Services revenue was $1.02 billion, accounting for only 22% of total revenue of $4.649 billion; this proportion was 39.4% in 2014 and 35% in 2019. This aligns with its strategy of shifting from market-sensitive execution business to more sustainable software/data businesses.

Hyperliquid's "Nasdaq Path"

Hyperliquid's effective take rate of about 4 basis points aligns with its deep focus on the "market layer." It is building an on-chain Nasdaq simulator: an architecture with high throughput, margin management, and a clearing stack (HyperCore), employing maker/taker pricing and maker rebates, aimed at optimizing execution quality and shared liquidity, rather than单纯的 retail monetization.

This is reflected in two design separations, similar to TradFi, that most crypto venues lack:
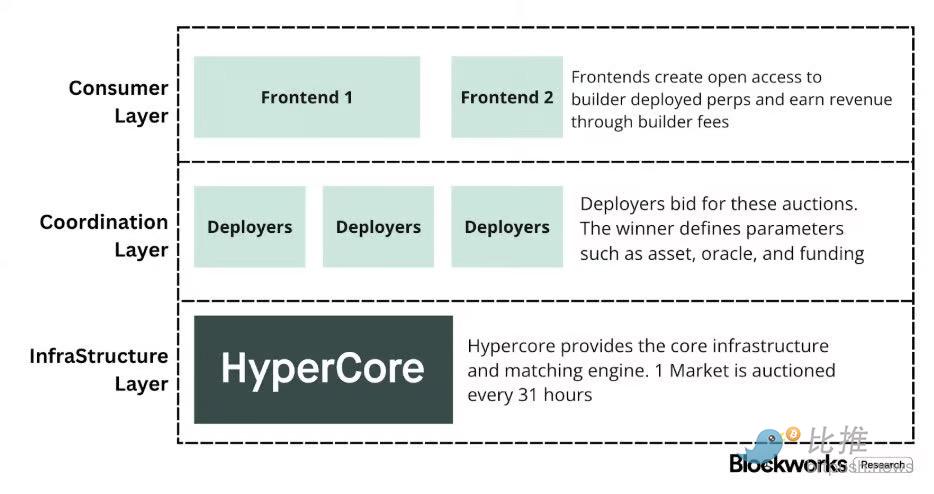
A) Permissioned Distribution/Layer (Builder Codes)

"Builder Codes" allow third-party interfaces to be deployed on top of the core trading venue and charge their own economic fees. Builder fees are capped at 0.1% (10 bps) for perps and 1% for spot, and can be set per order. This creates a competitive market for distribution, rather than a single-app monopoly.

B) Permissioned Listing/Product Layer (HIP-3)

In TradFi, exchanges control listings and product creation. The HIP-3 protocol externalizes this function: builders can deploy perpetual contracts that inherit the HyperCore stack and API, with the deployer responsible for defining and operating the market. Economically, HIP-3 formalizes revenue sharing between the venue and the product: spot and HIP-3 perp deployers can retain up to 50% of the trading fees from the deployed assets.

Builder Codes have already won on distribution; by mid-December, about one-third of users were trading through third-party frontends rather than the native UI.

Structural Pressure and Defense
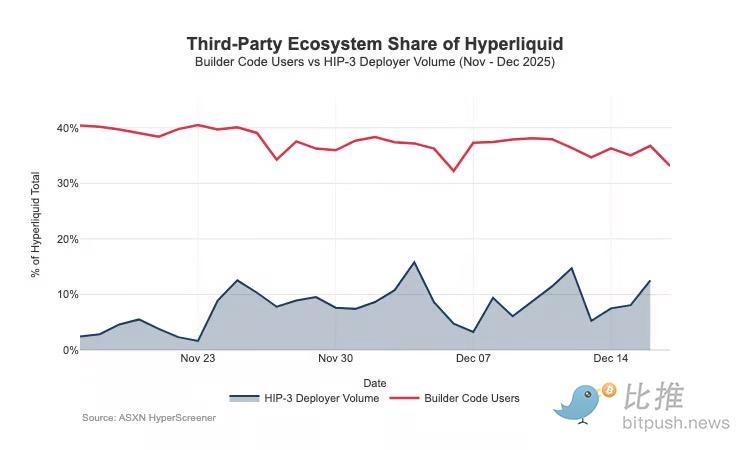
The problem is: this structure that fosters distribution growth will also predictably depress the venue's earnings:

  • Price Compression: Multiple frontends selling the same backend liquidity will push competition towards the lowest total cost; Builder fees can be adjusted per order, pushing pricing towards the bottom line.

  • Monetization Domain Drain: Frontends own deposits, bundling, subscriptions, and workflows; they capture the broker-layer profits, while Hyperliquid can only retain the thin venue earnings.

  • Strategic Routing Risk: If frontends become true cross-platform routers, Hyperliquid will be forced into a race for wholesale execution, retaining流量 only by cutting fees or increasing rebates.

Hyperliquid deliberately chose the thin-margin market layer (via HIP-3 and Builder Codes), while allowing a thick-margin broker layer to emerge on top of it. If third-party frontends continue to expand, they will increasingly dictate user-facing economics, control retention domains, and gain routing leverage, thereby structurally depressing Hyperliquid's take rate in the long term.

Commoditization is clearly the biggest risk. If third-party frontends can consistently underprice the native UI and eventually achieve cross-platform routing, Hyperliquid could be reduced to an extremely thin-margin wholesale clearing channel.

Strategic Pivot: Defending Distribution & Broadening Revenue

Recent design choices indicate that Hyperliquid is attempting to prevent the above outcome while broadening its revenue sources.
  1. Distribution Defense: Maintaining Native UI Economic Competitiveness

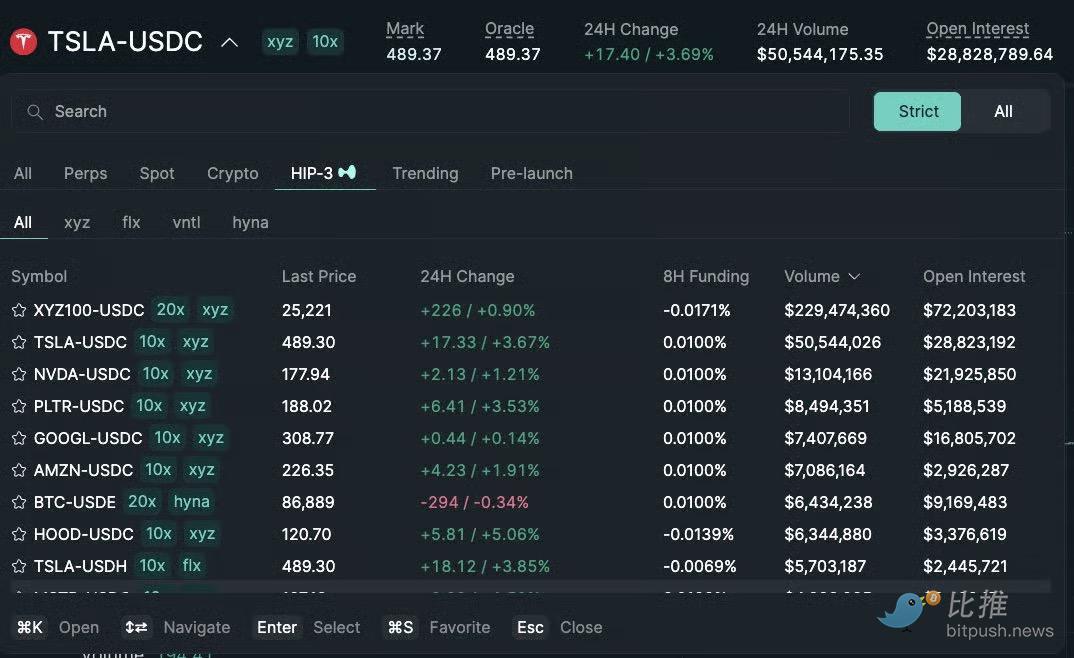
    A previously proposed staking discount would have allowed builders to receive up to a 40% discount by staking HYPE, which would have made third-party frontends structurally cheaper than Hyperliquid's own interface. Withdrawing this proposal removed direct price subsidies for external frontends. Meanwhile, HIP-3 markets, initially positioned for distribution by builders, are now being included in Hyperliquid's native frontend's "strict list." The signal is clear: Hyperliquid remains open at the builder level but is unwilling to compromise on core distribution rights.

  2. USDH: Shifting from Trading Monetization to Float Monetization

    The launch of USDH aims to recapture stablecoin reserve收益 that would otherwise flow externally. Its structure is a 50/50 split of reserve收益: 50% to Hyperliquid, 50% for USDH ecosystem growth. Fee discounts for USDH trading pairs further confirm this: Hyperliquid is willing to compress per-trade收益 for a larger, stickier profit pool from asset balances. Effectively, it adds an annuity-like revenue stream that scales with the monetary base (not just trading volume).

  3. Portfolio Margin: Introducing Prime Broker-like Financing Economics

    Portfolio margin unifies spot and perp margin, allowing risk offsetting, and introduces native borrowing loops. Hyperliquid retains 10% of the interest paid by borrowers. This makes the protocol's economics increasingly dependent on leverage utilization and interest rates, moving closer to a broker/prime broker economic model rather than a pure exchange model.

Conclusion: Moving into 2026

Hyperliquid has reached top-tier venue levels in terms of throughput scale, but its monetization still resembles a market layer: massive trading value paired with single-digit basis point effective take rates. Its gap with Coinbase or Robinhood is structural. Retail platforms occupy the broker layer, own user relationships and asset balances, and profit from multiple profit pools (financing, idle cash, subscriptions). Pure trading venues sell "execution," and execution is inherently commoditized due to liquidity and routing competition. Nasdaq is the epitome of this constraint in TradFi.

Hyperliquid initially leaned towards the "pure trading venue" prototype. By separating distribution and product creation, it accelerated ecosystem growth. The cost is that this architecture can lead to profit spillover.

However, recent moves can be interpreted as a deliberate pivot to defend distribution and enrich the revenue mix beyond trading fees. The protocol has become less willing to subsidize external frontends to be cheaper than the native UI, has started showcasing HIP-3 more natively, and has added balance-sheet-driven profit pools. USDH is a prime example of pulling back reserve收益, and portfolio margin introduces financing economics through a 10% cut of borrowing interest.

Hyperliquid is evolving towards a hybrid model: an execution轨道 as the underlying layer, overlaid with distribution defense and balance-driven profit pools. This reduces the risk of being trapped in the thin-margin wholesale环节, allowing it to move closer to a broker-like revenue组合 without abandoning its core advantages of unified execution and clearing.

Looking ahead to 2026, the core suspense is: Can Hyperliquid successfully pivot towards a broker-like profit model without破坏 its "outsourcing-friendly" model?

USDH (Hyperliquid's native stablecoin) is the clearest litmus test: the current supply of about $100 million indicates that the growth rate of this outsourced issuance is slow when a protocol does not directly control the distribution channels. An obvious alternative could have been setting defaults at the UI level, for example, automatically converting the protocol's ~$4 billion in USDC reserves into the native stablecoin (similar to Binance's当年 auto-conversion of user assets to BUSD).

If Hyperliquid wants to access broker-level profit pools, it might have to act more like a broker: stronger control, tighter native product integration, and drawing clearer boundaries with ecosystem teams that compete at the same distribution and asset balance layer.


Twitter:https://twitter.com/BitpushNewsCN

Bitpush TG Discussion Group:https://t.me/BitPushCommunity

Bitpush TG Subscription: https://t.me/bitpush

Original article link:https://www.bitpush.news/articles/7596866

Domande pertinenti

QWhat is Hyperliquid's current effective take rate on its massive perp trading volume, and how does it compare to retail platforms like Coinbase and Robinhood?

AHyperliquid's effective take rate is approximately 3.9 basis points (0.039%) on its perp trading volume. This is significantly lower than retail platforms; Coinbase reported a take rate of 35.5 basis points, while Robinhood Crypto's implied take rate was 33.5 basis points.

QAccording to the article, what is the fundamental structural difference in profit pools between the 'distribution layer' (like brokers) and the 'market layer' (like exchanges)?

AThe distribution layer (brokers like Robinhood and Coinbase) owns the customer relationship, which allows for high-margin monetization through multiple avenues beyond trading fees, such as balance sheet activities (cash sweep spreads, margin lending), subscriptions, and routing economics. The market layer (exchanges like Nasdaq) provides execution and infrastructure, but its pricing power is structurally constrained by competition, leading to commoditized, low-margin economics primarily from transaction fees, rebates, and data services.

QWhat two TradFi-like separation designs does Hyperliquid employ that most crypto venues do not?

AHyperliquid employs two key separation designs: 1) A permissioned distribution layer via Builder Codes, which allow third-party frontends to deploy on top of the core exchange and charge their own fees. 2) A permissioned listing/product layer via HIP-3, which externalizes market deployment and allows deployers to share up to 50% of the trading fees from their deployed assets.

QWhat are the three recent strategic shifts Hyperliquid has made to defend its economics and broaden its revenue, as mentioned in the article?

AThe three recent shifts are: 1) Distributive Defense: Withdrawing a proposed staking discount that would have made third-party frontends cheaper than its native UI and more natively featuring HIP-3 markets. 2) USDH: Launching a native stablecoin to recapture reserve yields that would otherwise flow externally, sharing the收益 50/50 between the protocol and ecosystem growth. 3) Portfolio Margin: Introducing a unified margin system that allows for risk netting and includes a native borrowing loop, with the protocol taking a 10% cut of the interest paid by borrowers.

QWhat does the article identify as the core悬念 (suspense) for Hyperliquid heading into 2026 regarding its business model evolution?

AThe core suspense is whether Hyperliquid can successfully shift towards a broker-like profit model with higher margins without破坏 (disrupting) its 'outsourcing-friendly' architecture that relies on third-party frontends and product deployers. The success of its native stablecoin, USDH, is cited as a key test case for this challenge.

Letture associate

After Three Consecutive Quarters of Decline, Can the Crypto Market Find a Window for Stabilization in Q3?

The cryptocurrency market has just concluded its worst-performing quarter since 2022, with total capitalization dropping 12.6% to $2.1 trillion. All core metrics indicate capital is leaving the sector, not just rotating within it. Bitcoin fell 14.2% and Ethereum dropped 25.4% in Q2, breaking their previous correlation with US tech stocks. A key driver is the reversal in US spot Bitcoin ETF flows, which saw a net outflow of approximately $4.67 billion in Q2, including a record monthly outflow near $4.5 billion in June. While recent data suggests long-term holders are accumulating again, sustained ETF outflows mean continued selling pressure. Market focus is now singularly on the Federal Reserve. The upcoming July FOMC meeting is seen as the most critical event for Q3. A dovish signal could support Bitcoin reclaiming a $68,000-$84,000 range, while a hawkish stance might establish a new trading band around $50,000-$56,000. Additionally, regulatory uncertainty persists, with the progress of the crucial *CLARITY Act* stalling in the Senate, reducing its perceived 2026 passage probability to 40-45%. Despite the broad downturn, a few sectors showed growth. Prediction markets saw nominal volume surge 48.7% year-over-year to $113.8 billion, and tokenized collectibles transaction volume rose 143% quarterly to $1.4 billion. The Real-World Asset (RWA) tokenization sector also continued steady growth, now representing ~$28.1 billion in on-chain value. The market's foundation for an extreme crash appears limited, with Bitcoin price hovering near its 200-week moving average. However, the trading paradigm has shifted from narrative-driven speculation to decisions based on price action, policy developments, and interest rate expectations, making a broad sentiment-driven rally unlikely in the near term.

marsbit2 h fa

After Three Consecutive Quarters of Decline, Can the Crypto Market Find a Window for Stabilization in Q3?

marsbit2 h fa

BIT Trading Moment: BTC Still Suppressed by Weekly 200 EMA, Rejection May Restart Decline; Storage and Semiconductors that Surged Last Night Begin Falling in Evening Trading

**Crypto & Stock Market Wrap: Bitcoin Tests Resistance, Stocks Retreat After AI Surge** Bitcoin consolidates around $66,000, facing key resistance near $68,000—an area seen as a major psychological and technical hurdle where previous rallies have failed. Analysts note the cryptocurrency is caught between its 200-week moving average (~$63,333) and 200-week EMA (~$68,328). A clear break above $68k is needed to signal a stronger bullish trend, while a rejection could lead to a retest of $63k support. Market sentiment remains cautious, with low futures open interest pointing to a low-liquidity rebound rather than a full bull market. Bitcoin spot ETFs saw another $203 million inflow. US stock futures pointed lower after a strong Tuesday session led by a massive rebound in semiconductors and memory stocks. The rally was fueled by renewed optimism about AI-driven hardware demand, with Micron, SanDisk, and SK Hynix surging. However, those gains reversed in pre-market trading. Super Micro Computer (SMCI) soared over 20% after hours on strong guidance and a record backlog. Other standouts included Rocket Lab and nuclear energy plays Oklo and X-Energy. Rising oil prices (Brent above $91) and climbing Treasury yields (10-year near 4.64%), however, are reigniting inflation concerns and acting as a headwind for equities. In Asia, markets were mixed. South Korea's KOSPI pared early gains to close slightly higher as semiconductor stocks like SK Hynix gave back initial surges. Japan's Nikkei edged lower as the yen hit a fresh 38-year low against the dollar, raising fears of potential market intervention. Key events to watch include the Samsung Galaxy launch, AMD's AI event, and a slew of major tech earnings from Alphabet, Tesla, and IBM after the close on Wednesday, followed by the ECB meeting and Intel's earnings on Thursday.

marsbit3 h fa

BIT Trading Moment: BTC Still Suppressed by Weekly 200 EMA, Rejection May Restart Decline; Storage and Semiconductors that Surged Last Night Begin Falling in Evening Trading

marsbit3 h fa

Former CFTC Chairman, Circle President Tarbert: Preaching Long-Termism While Cashing Out $30 Million Himself

Former CFTC Chairman and Circle President Heath Tarbert has consistently advocated for a long-term vision in public, urging patience from investors as Circle’s stock price has fallen significantly from its peak. However, it has been revealed that since Circle’s IPO, Tarbert has continuously sold his CRCL shares through pre-arranged trading plans, cashing out approximately $30 million, without making any public market purchases. This contrast between his public messaging and personal actions has drawn criticism. Tarbert joined Circle in July 2023 as Chief Legal Officer, leveraging his regulatory experience to help guide the company through its IPO and expansion. Despite promoting stablecoins as long-term infrastructure, he established a 10b5-1 trading plan just before Circle went public, leading to substantial stock sales over the following year. In March 2026, he initiated another plan to sell more shares. His career trajectory highlights a pattern of moving between high-level regulatory roles and influential positions in the financial sector. After resigning as CFTC Chairman in early 2021, he joined Citadel Securities as Chief Legal Officer just 27 days later, during a period of intense regulatory scrutiny for the firm. He later joined Circle, aiding its efforts to navigate regulatory challenges for its public listing. While Tarbert's expertise in policy and compliance is valuable to companies like Circle, his actions—advocating long-term confidence while personally divesting—raise questions about the alignment between his public statements and his private financial decisions, leaving investors who followed his advice to bear the market risks.

marsbit3 h fa

Former CFTC Chairman, Circle President Tarbert: Preaching Long-Termism While Cashing Out $30 Million Himself

marsbit3 h fa

Gate Research Institute: The 'Wall Street-ization' Wave of Crypto Financial Products – Competition or Integration?

The article titled "Gate Research Institute: Are Crypto Financial Products Sparking a 'Wall Street' Wave—Competition or Convergence?" explores the evolving relationship between the crypto ecosystem and traditional finance (TradFi). The piece begins by reflecting on Bitcoin's original 2009 vision of decentralization, disintermediation, and moving away from banks. It then contrasts this with the 2024 landscape, where key crypto assets like Bitcoin are increasingly held through Wall Street products like ETFs issued by giants like BlackRock. The article questions whether this signifies that TradFi is systematically taking over the rights to issue, price, custody, and distribute crypto financial assets. The core argument is that this is not a zero-sum takeover but rather a bidirectional convergence where each side addresses the other's weaknesses. Crypto offers 24/7 global markets, programmable settlement, and open access but lacks compliant channels, institutional-grade custody, deep fiat liquidity, and mainstream distribution. TradFi possesses these but is constrained by legacy systems, limited operating hours, and slow settlement. Two primary convergence paths are highlighted: * **Path A (CEX to TradFi):** Exemplified by Gate, which has progressed from offering tokenized stocks and CFDs to providing direct, real stock trading (US, Hong Kong, South Korea) within its platform, using USDT. * **Path B (TradFi to Crypto):** Exemplified by Robinhood, which has integrated crypto trading, acquired exchanges like Bitstamp, and is moving traditional assets like stocks onto the blockchain via tokenization and its own Layer 2. Both paths are ultimately competing to become the next-generation, unified financial account—a "super account" where users can seamlessly trade cryptocurrencies, stocks, ETFs, RWA (Real World Assets), and tokenized treasury products in one interface. The growth of RWA and tokenized treasuries (e.g., BlackRock's BUIDL) is presented as the asset-layer fusion, providing stable, yield-bearing assets on-chain and acting as a bridge between the two worlds. In conclusion, the "Wall Street-ization" of crypto is framed as a mutual transformation. Decentralized ideals persist in the protocol layer, while at the application layer, a more efficient, global, and accessible unified capital market is emerging from this convergence. The future competition lies not between crypto exchanges and stockbrokers, but between platforms vying to offer the most comprehensive asset coverage, liquidity, and user experience within a single account.

marsbit3 h fa

Gate Research Institute: The 'Wall Street-ization' Wave of Crypto Financial Products – Competition or Integration?

marsbit3 h fa

Trading

Spot
活动图片