
From Transaction Fees to Stablecoins: The Revenue Drivers and Economic Moats Behind Web3 Business Models

marsbitPubblicato 2026-07-11Pubblicato ultima volta 2026-07-11

Introduzione

"From Transaction Fees to Stablecoins: Revenue Drivers and Moats in Verified Web3 Business Models" This analysis explores five established Web3 revenue models, examining their drivers and long-term sustainability. 1. **Transaction Fees**: This model is highly cyclical, with income tied to market activity and user risk appetite (formula: volume × fee rate). Growth depends on expanding the market, gaining market share, and maintaining stable fees amid intense competition. 2. **Stablecoin Reserve Yield**: Revenue stems from the scale of issued stablecoins and the interest earned on their underlying reserves (like US Treasuries). While predictable with strong moats (high user migration costs), growth is tied to adoption as on-chain dollar infrastructure and is sensitive to interest rate cycles. 3. **Funding Rate Arbitrage & Lending Spreads**: Protocols like Aave and Ethena profit from capital supply-demand imbalances. Similar to transaction fees, this model is cyclical and driven by user leverage demand during bullish market phases. 4. **Block Space Sales**: Chains sell computational resources (formula: demand × gas price). A key challenge is the ongoing decline in gas fees due to technological advances and competition among L1s and L2s. Future viability hinges on whether demand growth can offset falling unit prices. 5. **Protocol-Level Service Fees**: Similar to SaaS, this model involves charging other protocols for essential services (e.g., oracles like Chainlink). Revenu...

Author: Eric SJ

Web3 is transitioning from the “user growth era” to the “business model validation era.” In a previous article, I discussed five already-validated Web3 business models:

  • Transaction Fees

  • Stablecoin Reserve Yield

  • Funding Rate Spread

  • Block Space Sales

  • Protocol-Level Service Fees

These models answer the question: How do they make money? But two more critical questions remain:

  • Some revenue streams look “sexy,” but may not be sustainable long-term.

  • Some revenue streams appear slow but may hold greater business value.

A formula to explain: Revenue = User Demand × Usage Scale × Pricing Power × Market Environment

For example, a protocol earning $100 million a year might represent a genuine commercial loop, or it might just be riding a market cycle. The question is the sustainability of that cycle (e.g., the previous Pump).

Money earned during a casino's peak season and money earned from infrastructure rent might both be revenue, but their future prospects differ.

This article will deconstruct these five validated Web3 business models from the perspectives of their revenue drivers and long-term economic moats.

1. Transaction Fee Revenue: Looking at Trading Volume and User Activity

Transaction fees are the easiest-to-understand business model in Web3. The logic is simple: Trading Revenue = Trading Volume × Fee Rate

Thus, the factors influencing revenue are easy to break down.

Trading volume and market activity show a positive correlation, the most obvious variable in the transaction fee model.

In bull markets, asset prices rise, users' willingness to trade increases, leverage demand grows, and trading volume naturally rises. Therefore, revenue for CEXs, DEXs, and Perp DEXs grows rapidly.

But in bear markets, user trading and leverage demand decline simultaneously, and fee revenue also drops significantly.

  • This is why the transaction fee model's revenue is the most cyclical.

At the same time, an increase in trading volume doesn't necessarily mean the business model and its loop are stronger. What's more important is whether your volume comes from genuine user growth or just short-term incentive-driven traffic.

Take Hyperliquid @HyperliquidX as an example. Its future revenue growth depends not only on the overall perpetual contract market size but also on whether it can continue to attract: on-chain traders and market makers, which are the foundation of liquidity.

Because what trading platforms are truly competing for is not the product, but the liquidity network.

Next is the fee rate.

Trading platforms cannot raise fees indefinitely because the fee itself is a competitive tool. When competition intensifies: reducing fees, rebating fees, and increasing user incentives all affect the final revenue.

Therefore, the long-term growth of the transaction fee model requires simultaneously satisfying: market expansion, increasing market share, and stable fee rates.

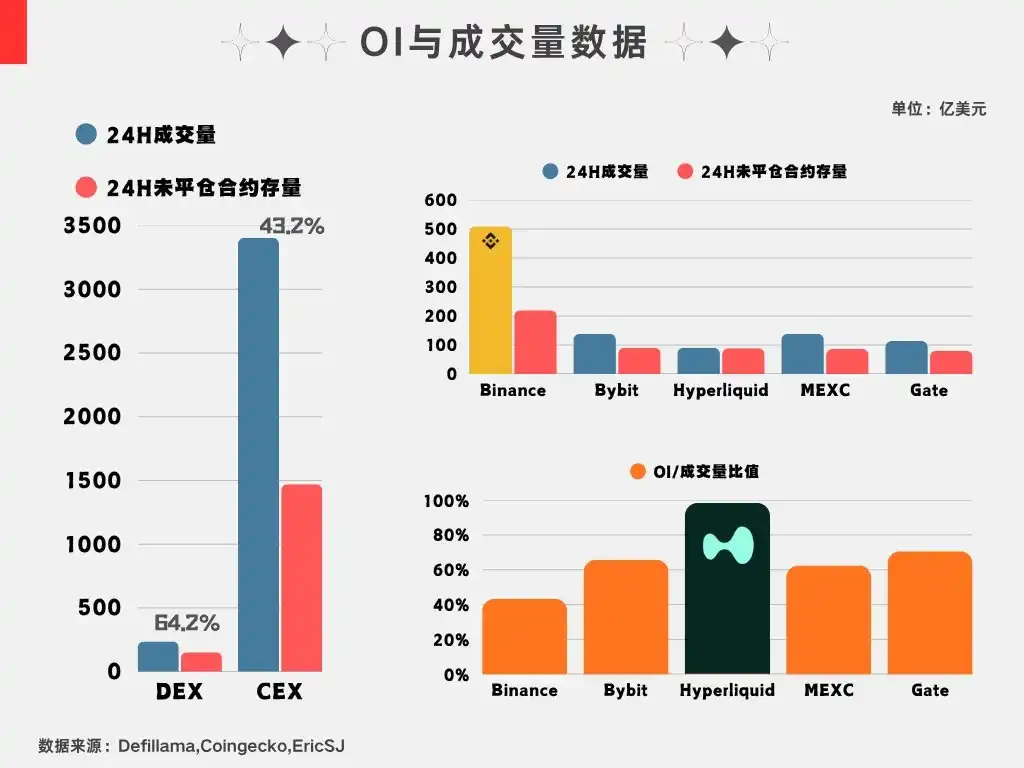
Early DEXs and current Perp DEXs, to compete, have attracted funds into their protocols for trading through 0% fees to increase their market share. But this raises a question worth pondering: When fees return to normal levels, are those funds still willing to stay in the protocol?

The OI indicator is a good parameter. The chart below shows OI data I compiled last month. In the current environment with no major overall changes, this to some extent reflects the willingness of funds to keep their risk exposure in a particular place.
2. Stablecoin Revenue: Primarily Looking at Scale and Interest Rate Environment

The stablecoin reserve yield model is essentially: Revenue = Stablecoin Scale × Reserve Asset Yield Rate. Therefore, the influencing factors are these two.

First, scale, the most critical variable. USDT and USDC revenue come from how much dollar-denominated assets are deposited on-chain.

If the stablecoin supply grows, reserve scale expands, and revenue naturally increases; conversely, if the scale decreases, revenue is also affected.

  • The chart below shows Tether's scale for Q1 2026, achieving approximately $1.04 billion in net profit at such scale.
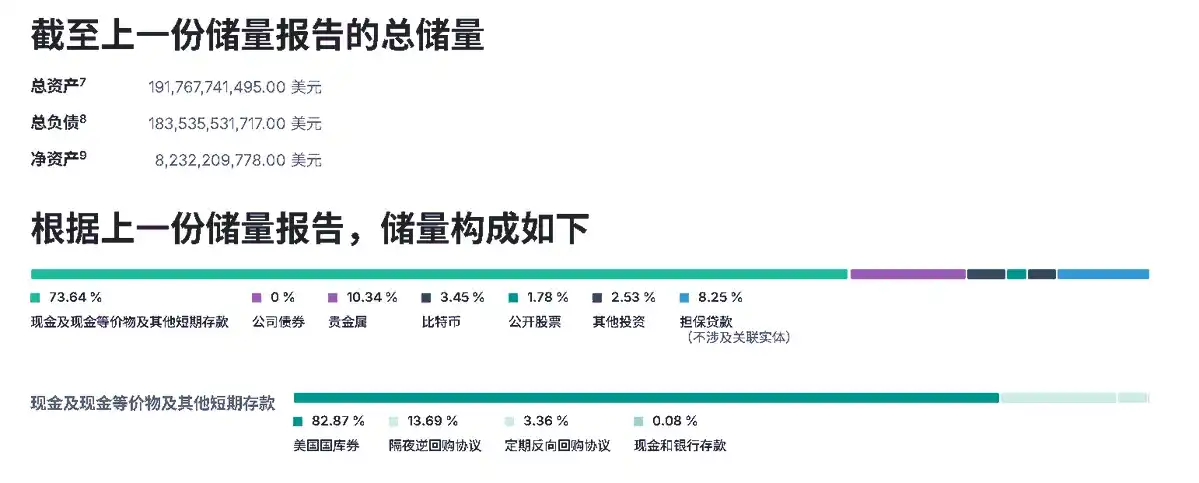
Therefore, the core competition for stablecoins is not just issuing more tokens, but which one can become the dollar infrastructure on-chain. In other words, in the current compliance context, which stablecoin can become the issuance entry point determines the thickness of its future economic moat.

The second factor is the interest rate environment.

Stablecoin issuers typically allocate to: US Treasuries, money market funds, and cash equivalents. Thus, their revenue is highly dependent on the risk-free interest rate. Reserve yield increases in a high-rate environment; it decreases in a low-rate environment.

Therefore, even if stablecoin scale continues to grow, issuer revenue can still be affected by interest rate cycles. However, this model has a remarkable point: it doesn't experience huge volatility, growth is predictable (the flip side is a lack of imagination), and once funds enter, they are not easily moved in the short term.

Moreover, large funds tend to gravitate towards time-tested “brands.” That is, the longer something exists, the thicker its moat becomes, which is why it's increasingly difficult for new stablecoins to capture market share.

And this market is slowly opening up new incremental channels. Once a project is adopted as a traditional entry point onto the chain, it becomes a stable cash cow.

3. Funding Rate Spread Revenue: Looking at Capital Demand and Risk Management

In the funding rate spread model, I previously gave two examples: Aave lending and Ethena funding rate arbitrage.

Their essence is profiting from the supply-demand imbalance of capital.

Take Aave as an example. Revenue comes from borrowing demand. In an uptrend cycle, user risk appetite increases, using loans to amplify leverage further. This is the source of demand, driving capital utilization and protocol revenue growth. The logic is the same as the transaction fee cycle, both stemming from risk appetite.

4. Block Space Revenue: Primarily Looking at On-Chain Activity

The block space sales model is also clear: Revenue = Block Space Demand × Gas Unit Price.

The structure is simple, but it's worth discussing because this model has some revenue expectation issues (in my opinion).

Theoretically, the more on-chain users, transactions, and applications, the higher the block space demand, and revenue naturally increases, because an unused highway has no fee-collecting value.

However, the Gas unit price is a hard constraint. Looking at industry trends, Gas has been on a declining trend, which actually impacts revenue.

Add competition between different chains—Ethereum, Solana, L2s, DA layers all form competitive relationships—and Gas fees become even more competitive. Many chains frequently launch 0-Gas activities to attract liquidity and boost on-chain activity.

This involves a game between demand growth and unit price decline.

Take Ethereum. Two cycles ago, Ethereum's logic was simple: Limited block space → users compete for transaction ordering → demand increases → Gas rises → network revenue increases;
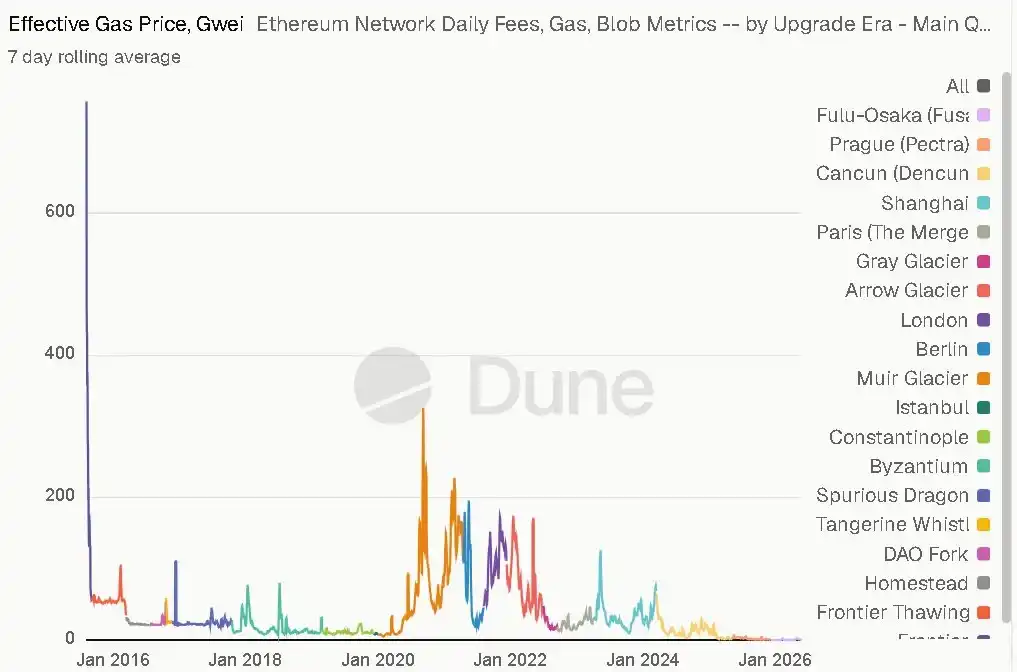
But with the emergence of more chains, improved transaction execution efficiency, and more alternative options in the market, Gas has been driven down. This creates a commercial contradiction:

  • On one hand: More users and applications need block space;

  • On the other hand: Technological advancements continuously reduce block space costs.

For users, this is good because transactions become cheaper. But for chains acting as “block space suppliers”: unit revenue declines.

This is somewhat similar to internet infrastructure development. Early on, bandwidth was scarce and expensive. Later, as bandwidth continually expanded, prices kept falling. Ultimately, market value doesn't solely belong to those providing underlying resources, but concentrates more on those with users, ecosystems, and platform capabilities.

Therefore, the core question for the future block space business model isn't just: “Is there demand?”

But rather: Can demand growth offset the decline in unit price?

5. Protocol-Level Service Fees: Looking at Usage Scale and Positioning

Infrastructure service fees are more like the Web3 version of SaaS. Oracles are a typical example.

Its revenue mainly comes from the B-side: continuous usage by project teams.

The more projects using the protocol, the larger the revenue scale, and migration costs become significant. Once integrated, the cost to replace is high.
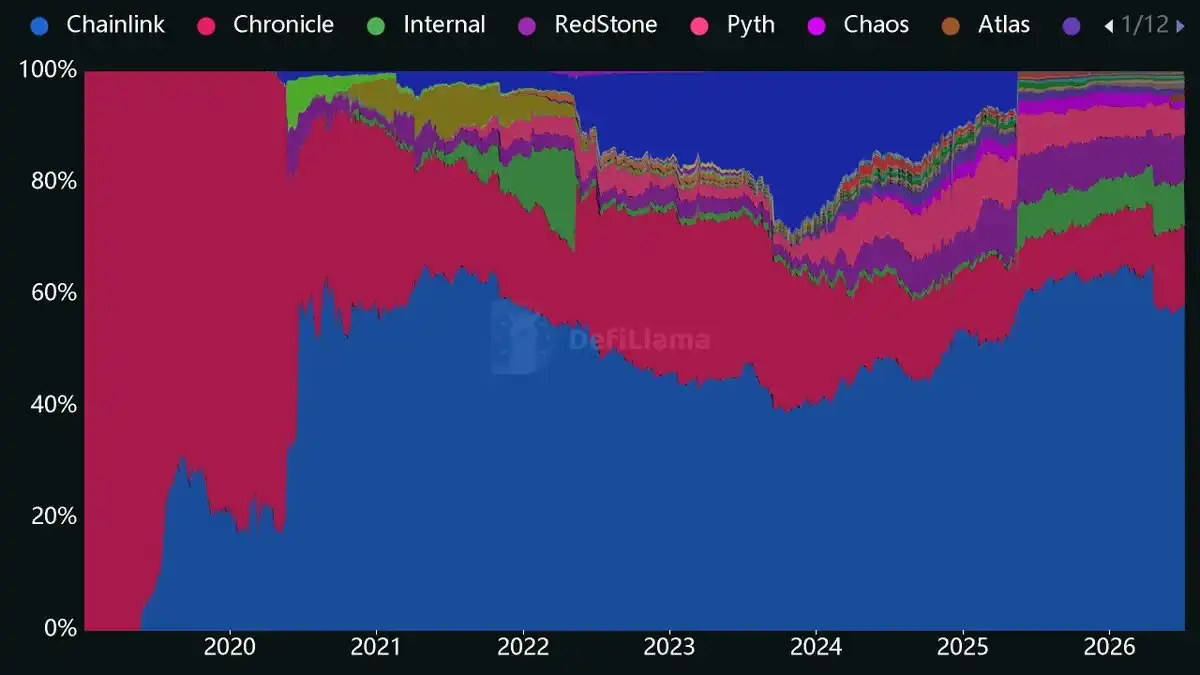
However, there's a prerequisite: it must become the industry standard itself. For example, the current Chainlink occupies well over half of the oracle market share. As a result, other projects in this sector have little competitive space; the moat is very thick. Even if a cheaper product appears, it's difficult to easily displace existing B-side integrations.

This type of infrastructure sells not a one-time product, but rather: an ecosystem position. Therefore, its long-term value depends on: whether more and more projects build around it.

Summary

Comparing the five business models together:

1. Both the transaction fee and funding rate spread models are highly cyclical, driven fundamentally by the risk appetite of on-chain capital.

2. Both the stablecoin reserve yield and protocol-level service fee models, once established, have very thick moats, rooted in the high migration costs on the supply side.

3. The block space sales model faces the persistent issue of declining unit prices. It requires consideration of the trade-off between scale and unit price. Valuing it purely based on revenue is quite unreasonable (at least currently).


Crypto di tendenza

Domande pertinenti

QWhat are the main drivers of revenue for the transaction fee model in Web3?

AThe main drivers are trading volume and user activity, which are highly correlated with market cycles. The formula is Transaction Revenue = Trading Volume × Fee Rate. The model is highly cyclical, as trading volume and user leverage demand increase during bull markets and decrease during bear markets.

QWhat are the two core variables that determine the revenue of the stablecoin reserve model?

AThe two core variables are stablecoin scale (circulating supply) and the interest rate environment. Revenue = Stablecoin Scale × Reserve Asset Yield Rate. The model's growth is predictable but lacks high volatility, and it benefits from high switching costs for large capital, creating a thick moat for established players.

QWhat is the central contradiction or business challenge faced by the 'block space selling' revenue model?

AThe central contradiction is the tension between increasing demand for block space and the continuous decline in Gas unit prices due to technological progress (e.g., scaling solutions) and intense competition among different chains. The key question is whether demand growth can outpace the drop in unit price to sustain and grow revenue.

QHow does the moat for a 'protocol-level service fee' model, like an oracle, form?

AThe moat forms by becoming the industry standard. When many projects integrate the service (e.g., Chainlink for oracles), the switching costs for these B2B clients become very high. The revenue depends on the number of projects using it, and its long-term value is tied to its entrenched position in the ecosystem.

QAccording to the article, which revenue models share a similar cyclical nature and underlying driver?

AThe Transaction Fee model and the Funding Spread model (e.g., Aave lending, Ethena) share a strong cyclical nature. Their underlying driver is the risk appetite of on-chain capital, which increases leverage and demand during bullish cycles and decreases during bearish ones.

Letture associate

Wall Street Morning Report: Nvidia Falls for 7 Consecutive Days, AI Stocks Continue to Bleed Out; U.S. Treasury Buybacks Criticized as Temporary Fix, Inflation and Deficit Are the Real Big Problems

Wall Street Morning Report: Tech and Treasury Tensions U.S. stocks were mixed. The Dow gained 0.26%, supported by defensive and consumer staples stocks, while the S&P 500 fell 0.28% and the Nasdaq dropped 0.76% amid a sell-off in AI hardware. The U.S. announced new sanctions targeting Iran's key economic sectors, temporarily easing oil prices (Brent -2.35%). However, concerns over potential disruption to the Strait of Hormuz could pressure European natural gas prices. Meanwhile, the Treasury's upcoming bond buyback plan faced criticism from major banks (Goldman Sachs, Deutsche Bank, Citadel), who argue it doesn't address the root causes of high long-term yields: persistent inflation and the massive fiscal deficit. The 10-year Treasury yield dipped slightly to around 4.70%. Gold rose, with Citi raising its short-term target to $4,800/oz. The AI hardware and semiconductor sector saw intense selling. The Philadelphia Semiconductor Index fell nearly 3%. NVIDIA dropped 2.91%, marking its seventh consecutive daily decline—its longest losing streak since 2022—due to pre-earnings caution despite strong analyst estimates. Memory chip stocks (Micron -6%, others down 5-6%) fell after Samsung's shareholder returns disappointed, raising cycle peak fears. Optical communications was also a big loser, led by Applied Optoelectronics (-14%) on equity dilution concerns. Wall Street is growing wary of off-balance-sheet credit risks in AI infrastructure financing. In other moves, Tesla fell 3.83% on a major China recall. Meta rose 1.66% on news of its upcoming "Hatch" AI platform. Defensive stocks like Visa and Walmart supported the Dow. Key upcoming events include the Jefferies Semiconductor Conference (Aug 25-26), Gamescom (Aug 26-30), and NVIDIA's earnings report (Aug 28).

marsbit1 min fa

Wall Street Morning Report: Nvidia Falls for 7 Consecutive Days, AI Stocks Continue to Bleed Out; U.S. Treasury Buybacks Criticized as Temporary Fix, Inflation and Deficit Are the Real Big Problems

marsbit1 min fa

Analog Chip Giants TI and ADI Are Stepping Up

Analog chip giants Texas Instruments (TI) and Analog Devices (ADI) have both reported strong quarterly results, signaling an industry recovery. TI's Q2 2026 revenue reached $5.463 billion, a 23% year-over-year (YoY) increase. ADI's Q3 FY2026 revenue hit $4.022 billion, up 40% YoY, marking a new quarterly record. Both companies benefited from rising demand in industrial and data center markets, though their growth paths differed. TI experienced broad-based strength across its segments. Industrial revenue (33% of total) grew approximately 30% YoY, while data center revenue (9%) doubled. The automotive segment (33%) also showed a strong rebound, attributed to demand from China's EV/hybrid market and low inventory levels at automakers. ADI's growth was led by its industrial (49% of revenue, +53% YoY) and communications (16%, +84% YoY) segments, with data center products constituting 80% of the latter. Management highlighted a significant "AI exposure," with data center and ATE-related businesses now accounting for 20% of total revenue. Key differences emerged in their strategies and supply chain dynamics. ADI attributed a larger portion of its growth to AI infrastructure demand and has built "strategic inventory" to a record high of ~$1.93 billion to support future growth, despite channel inventory being below target levels. Its product lead times have extended to up to six months, and price increases are contributing to margin expansion. TI's inventory remained high at $4.6 billion but saw improved turnover. The company emphasized that its growth is primarily volume-driven, with minimal contribution from recent price hikes. TI maintains a competitive lead time below 13 weeks and expressed confidence in its capacity sufficiency for the next three years. In summary, both companies are riding a recovery wave fueled by industrial and AI/data center demand. TI's approach leverages its broad market presence and prepared capacity, while ADI is more focused on AI-driven growth and strategic inventory buildup. Their differing paths highlight the evolving structure of demand within the analog semiconductor market's rebound.

marsbit27 min fa

Analog Chip Giants TI and ADI Are Stepping Up

marsbit27 min fa

Trading

Spot

Articoli Popolari

Come comprare ERA

Benvenuto in HTX.com! Abbiamo reso l'acquisto di Caldera (ERA) semplice e conveniente. Segui la nostra guida passo passo per intraprendere il tuo viaggio nel mondo delle criptovalute.Step 1: Crea il tuo Account HTXUsa la tua email o numero di telefono per registrarti il tuo account gratuito su HTX. Vivi un'esperienza facile e sblocca tutte le funzionalità,Crea il mio accountStep 2: Vai in Acquista crypto e seleziona il tuo metodo di pagamentoCarta di credito/debito: utilizza la tua Visa o Mastercard per acquistare immediatamente CalderaERA.Bilancio: Usa i fondi dal bilancio del tuo account HTX per fare trading senza problemi.Terze parti: abbiamo aggiunto metodi di pagamento molto utilizzati come Google Pay e Apple Pay per maggiore comodità.P2P: Fai trading direttamente con altri utenti HTX.Over-the-Counter (OTC): Offriamo servizi su misura e tassi di cambio competitivi per i trader.Step 3: Conserva Caldera (ERA)Dopo aver acquistato Caldera (ERA), conserva nel tuo account HTX. In alternativa, puoi inviare tramite trasferimento blockchain o scambiare per altre criptovalute.Step 4: Scambia Caldera (ERA)Scambia facilmente Caldera (ERA) nel mercato spot di HTX. Accedi al tuo account, seleziona la tua coppia di trading, esegui le tue operazioni e monitora in tempo reale. Offriamo un'esperienza user-friendly sia per chi ha appena iniziato che per i trader più esperti.

556 Totale visualizzazioniPubblicato il 2025.07.17Aggiornato il 2026.06.02

Come comprare ERA

Discussioni

Benvenuto nella Community HTX. Qui puoi rimanere informato sugli ultimi sviluppi della piattaforma e accedere ad approfondimenti esperti sul mercato. Le opinioni degli utenti sul prezzo di ERA ERA sono presentate come di seguito.

活动图片