DEXE surges 17% as buyers dominate: Will a breakout push toward $7?

ambcryptoPubblicato 2026-03-09Pubblicato ultima volta 2026-03-09

Introduzione

DEXE surged 17.74% to $4.37, with trading volume up 111.72% to $14.63M, indicating strong buyer interest and new capital inflow. The price is testing a key resistance level at $4.79 after forming a bottom structure. If this neckline is broken, the rally could extend toward $7.00. The RSI near 75 shows strong momentum but suggests potential short-term consolidation. Both spot and derivatives markets show aggressive buying, with Open Interest rising 51.45% to $11.12M, reflecting leveraged positioning. Overall, buyer dominance suggests continued upward movement if key resistance is reclaimed.

DEXE surged 17.74% to $4.37, while trading volume climbed 111.72% to $14.63M, signaling rapidly expanding market participation.

This sharp rise in activity reflects renewed demand as traders react to the latest breakout attempt.

The rally has unfolded after weeks of gradual recovery from lower levels. DEXE has climbed steadily while buyers increasingly dominate order flow.

However, the surge in trading volume suggests that fresh capital has entered the market rather than short-term rotation alone.

Such behavior typically emerges when traders anticipate a structural breakout. At the same time, derivatives participation has expanded alongside Spot activity.

This alignment between Spot demand and derivatives positioning suggests that traders currently expect continuation toward higher resistance zones.

Is DEXE challenging a major neckline barrier?

DEXE has advanced toward a crucial neckline resistance near $4.79 after forming a large bottom structure on the daily chart.

Price previously dropped to roughly $1.93, where strong demand stabilized the decline and initiated the recovery phase.

Since then, the chart has developed a gradual rounded structure that signals accumulation over several weeks. However, the current rally now tests a decisive resistance level that previously acted as structural support.

Buyers have already reclaimed the $3.27 zone, which earlier limited upward movement during the recovery phase. As a result, the market now confronts the neckline area that defines the broader reversal structure.

If buyers maintain control above this level, the pattern projection indicates a possible expansion toward the $7.00 resistance zone.

The Relative Strength Index currently reads near 75, indicating strong buyer activity during the recent recovery phase. This elevated reading reflects persistent demand as price climbs toward higher resistance zones.

RSI has also remained above its moving average, which reinforces the current bullish structure.

However, the indicator now approaches overbought territory, which occasionally triggers short consolidation periods during strong rallies. Such pauses often allow the market to reset before continuation attempts emerge.

Buyers dominate order flow across Spot markets

Spot Taker CVD has flipped to buyer dominance, revealing aggressive market orders lifting offers across exchanges.

This indicator measures the cumulative difference between buy and sell taker activity. When the metric rises, it shows that buyers actively execute market orders rather than placing passive bids.

Such behavior often accompanies early stages of strong market rallies. Traders increasingly accept higher prices to secure positions quickly.

As a result, the current rally reflects genuine demand rather than passive liquidity absorption. The dominance of taker buying also aligns with the surge in trading volume recorded during the rally.

Together, these signals show that Spot traders continue driving the upward move while competing for available liquidity.

Leveraged traders enter as OI climbs

Open Interest has expanded 51.45% to $11.12M, reflecting a rapid increase in derivatives participation.

This sharp rise indicates that traders have opened new leveraged positions while price advances toward resistance. Expanding Open Interest typically suggests growing confidence in the prevailing trend.

However, it also increases the probability of volatility because leverage amplifies price movements. The derivatives market now contributes a larger share of overall trading activity.

Such participation often intensifies when traders anticipate a decisive breakout attempt. The increase in leverage also aligns with the aggressive buying observed in Spot markets.

Together, these dynamics indicate that both Spot traders and derivatives participants now actively position around the same resistance zone.

Can DEXE push toward $7?

DEXE now trades directly beneath the $4.79 neckline resistance, which defines the next decisive market test. Buyers currently dominate Spot activity while derivatives participation expands rapidly.

This alignment suggests that traders expect further upside attempts. If buyers successfully reclaim this neckline level, the broader bottom structure could extend toward $7.00.

However, failure near resistance could trigger short consolidation before another breakout attempt emerges.


Final Summary

  • Strong buyer participation continues driving DEXE upward as traders increasingly anticipate a structural breakout beyond neckline resistance levels.
  • If buyers sustain pressure above key resistance, the broader reversal structure could extend the rally toward higher macro targets.


Crypto di tendenza

Domande pertinenti

QWhat was the percentage increase in DEXE's price and its trading volume as mentioned in the article?

ADEXE surged 17.74% to $4.37, and its trading volume climbed 111.72% to $14.63M.

QWhat is the crucial neckline resistance level that DEXE is approaching according to the technical analysis?

AThe crucial neckline resistance level is near $4.79.

QWhat does the Relative Strength Index (RSI) reading of 75 indicate about the current market condition for DEXE?

AAn RSI reading near 75 indicates strong buyer activity and that the market is approaching overbought territory, which can sometimes lead to short consolidation periods.

QHow has Open Interest (OI) in the derivatives market changed, and what does this signify?

AOpen Interest expanded by 51.45% to $11.12M, indicating a rapid increase in derivatives participation and growing confidence in the prevailing trend, though it also increases the potential for volatility.

QWhat is the projected price target for DEXE if buyers successfully break through the neckline resistance?

AIf buyers successfully reclaim the neckline resistance, the pattern projection indicates a possible expansion toward the $7.00 resistance zone.

Letture associate

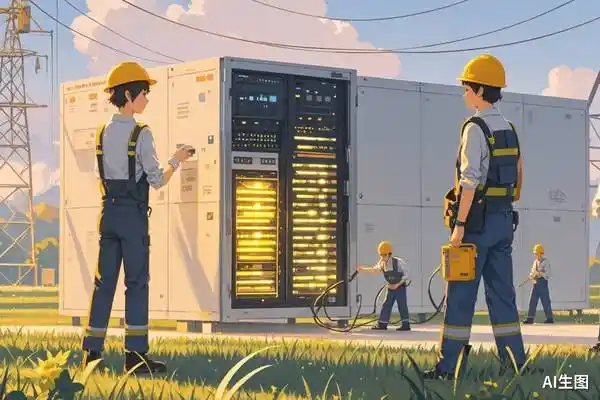
Annual Salary of Millions Competing for Electricians, Meta Rushes to Open Its Own Technical School

The AI boom is facing an unexpected bottleneck: a severe shortage of skilled construction workers and electricians. As tech giants like Meta, OpenAI, and Alphabet race to build massive data centers—such as OpenAI's $16 billion "Stargate" project—they are hitting a critical labor wall. The U.S. needs an estimated 130,000 more electricians, 240,000 construction workers, and 150,000 supervisors by 2030 for AI infrastructure alone, but tens of thousands of electrician jobs go unfilled each year. While AI companies offer high premiums, with electricians earning up to $280,000 annually, worker scarcity still causes massive losses—delays on a single project can cost $14.2 million per month. The complexity of building AI data centers, which require immense power (equivalent to powering hundreds of thousands of homes), sophisticated electrical systems, and advanced liquid cooling solutions, demands highly skilled technicians who are in short supply. To combat this, companies are investing heavily in training. Meta has committed $115 million to a free training school offering tuition, housing, and stipends, targeting 5,000 new workers. OpenAI is partnering with unions to secure skilled labor. These efforts are paying off, with a significant rise in Gen Z interest in trade schools over college. However, the power demands are staggering. AI data centers are driving a rapid surge in electricity consumption, projected to account for up to 12% of U.S. power use by 2028 and raising costs for consumers. Furthermore, the construction boom is project-based, leading to a potential future glut of trained workers once building peaks, which could depress wages industry-wide. The race for AI supremacy now depends as much on skilled hands as on advanced chips.

marsbit9 min fa

Annual Salary of Millions Competing for Electricians, Meta Rushes to Open Its Own Technical School

marsbit9 min fa

OpenAI No Longer Sells Its Most Expensive Model for Profit

OpenAI is shifting its business strategy away from promoting its most expensive, flagship models for every task. Recent price cuts—80% for GPT-5.6 Luna and 20% for Terra—signal a deeper change: the company now actively advises users that many tasks don't require the most powerful model. Instead, OpenAI recommends a tiered approach: use the high-end GPT-5.6 Sol for complex planning and analysis, then delegate execution to cheaper models like Luna. This mirrors moves by Anthropic, which recently launched Claude Opus 5 at half the price of its top model, Fable 5. Both companies are de-emphasizing flagship models as primary revenue drivers, using them instead for brand prestige and technological showcases. The industry is entering a "mass-market" phase, similar to automotive, where high-volume, cost-effective models handle daily operations and drive scale. OpenAI's price reductions are partly enabled by AI models themselves optimizing underlying code and infrastructure, creating a self-reinforcing cycle of efficiency gains and cost reduction. Competition is shifting from "who is smartest" to "who offers the best value." The goal is no longer selling individual models but fostering widespread API adoption and ecosystem lock-in. By making AI calls cheap and ubiquitous, companies like OpenAI aim to become the indispensable, utility-like infrastructure powering automated workflows—the "water and electricity" of software, quietly embedded everywhere.

marsbit9 min fa

OpenAI No Longer Sells Its Most Expensive Model for Profit

marsbit9 min fa

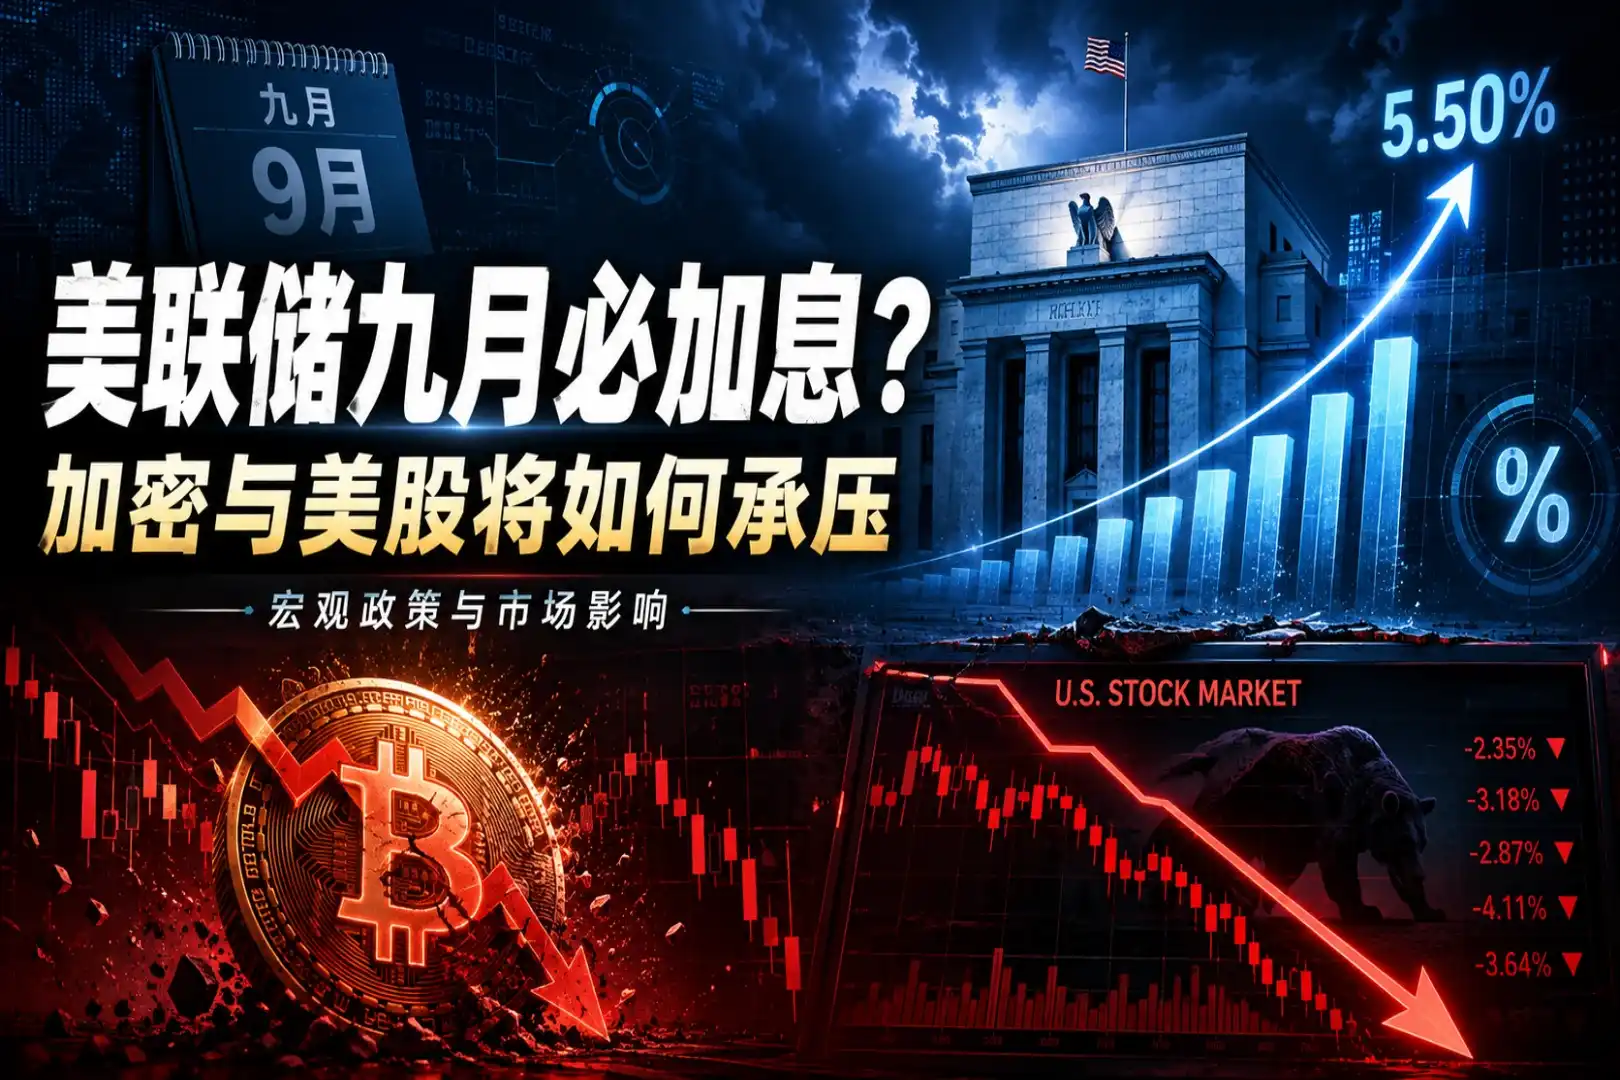
Will the Fed Definitely Raise Interest Rates in September? How Will Crypto and U.S. Stocks Withstand the Pressure?

The market's expectation for a September Fed rate hike surged dramatically in early August, jumping from under 50% to over 80% within a week. This shift followed a contentious July FOMC meeting, where a 9-3 vote to hold rates revealed growing dissent from hawkish members advocating for an immediate hike to combat persistent inflation. The primary catalyst for this repricing is rising oil prices, driven by renewed geopolitical tensions around the Strait of Hormuz, which threaten global supply. Energy costs directly influence inflation metrics, making the upcoming July CPI report (due August 12th) a critical data point. If it shows inflation reaccelerating, the probability of a September hike will solidify. For Bitcoin and crypto assets, this is typically bearish news. Bitcoin continues to behave as a high-beta, liquidity-sensitive risk asset. A rate hike raises the opportunity cost of holding non-yielding assets and could drive capital toward money markets, pressuring crypto prices in the short term. However, historical patterns suggest that if a hike is perceived as the end of a tightening cycle rather than the start, any negative price impact may be brief. U.S. stocks, particularly crypto-linked equities like Coinbase and growth-oriented tech stocks, are also vulnerable. Higher rates increase discount rates in valuation models, putting pressure on high-multiple companies. This coincides with a pivotal tech earnings season where investor focus has shifted from massive AI capital expenditure to tangible revenue and cash flow generation. Companies with negative cash flow and weak growth narratives could face heightened volatility if borrowing costs rise in September. In summary, a September Fed hike has evolved into a mainstream market scenario. Key factors to watch are oil prices, the July CPI report, and Fed communications, which will determine the final decision and its impact on volatile crypto and equity markets.

marsbit19 min fa

Will the Fed Definitely Raise Interest Rates in September? How Will Crypto and U.S. Stocks Withstand the Pressure?

marsbit19 min fa

Trading

Spot

Articoli Popolari

Come comprare PUSH

Benvenuto in HTX.com! Abbiamo reso l'acquisto di Push Protocol (PUSH) semplice e conveniente. Segui la nostra guida passo passo per intraprendere il tuo viaggio nel mondo delle criptovalute.Step 1: Crea il tuo Account HTXUsa la tua email o numero di telefono per registrarti il tuo account gratuito su HTX. Vivi un'esperienza facile e sblocca tutte le funzionalità,Crea il mio accountStep 2: Vai in Acquista crypto e seleziona il tuo metodo di pagamentoCarta di credito/debito: utilizza la tua Visa o Mastercard per acquistare immediatamente Push ProtocolPUSH.Bilancio: Usa i fondi dal bilancio del tuo account HTX per fare trading senza problemi.Terze parti: abbiamo aggiunto metodi di pagamento molto utilizzati come Google Pay e Apple Pay per maggiore comodità.P2P: Fai trading direttamente con altri utenti HTX.Over-the-Counter (OTC): Offriamo servizi su misura e tassi di cambio competitivi per i trader.Step 3: Conserva Push Protocol (PUSH)Dopo aver acquistato Push Protocol (PUSH), conserva nel tuo account HTX. In alternativa, puoi inviare tramite trasferimento blockchain o scambiare per altre criptovalute.Step 4: Scambia Push Protocol (PUSH)Scambia facilmente Push Protocol (PUSH) nel mercato spot di HTX. Accedi al tuo account, seleziona la tua coppia di trading, esegui le tue operazioni e monitora in tempo reale. Offriamo un'esperienza user-friendly sia per chi ha appena iniziato che per i trader più esperti.

577 Totale visualizzazioniPubblicato il 2024.12.13Aggiornato il 2026.06.02

Come comprare PUSH

Discussioni

Benvenuto nella Community HTX. Qui puoi rimanere informato sugli ultimi sviluppi della piattaforma e accedere ad approfondimenti esperti sul mercato. Le opinioni degli utenti sul prezzo di PUSH PUSH sono presentate come di seguito.

活动图片