Data Suggest Bitcoin May Be Entering A New Bear Phase, Warns CryptoQuant

bitcoinistPubblicato 2025-12-25Pubblicato ultima volta 2025-12-25

Introduzione

Bitcoin may be transitioning into a new bear market phase, according to a CryptoQuant analysis by Woominkyu. The Bitcoin Cycle Momentum Indicator (BCMI) has declined to between 0.4 and 0.5, signaling a cooling period rather than a temporary pullback. Historically, cycle bottoms occur when BCMI falls to 0.25–0.35, suggesting further downside potential. Demand has sharply declined since early October, with institutional demand contracting. US spot Bitcoin ETFs became net sellers in Q4 2025, selling approximately 24,000 BTC. Perpetual futures funding rates dropped to their lowest since December 2023, indicating reduced risk appetite. Bitcoin's price has fallen below its 365-day moving average, a key bull-bear market indicator. If a bear market is confirmed, the realized price could be around $56,000, representing a 55% drawdown from recent all-time highs. Intermediate support is seen near $70,000. Bitcoin was trading at $87,635 at the time of writing, down 10% year-to-date and 30.5% from its peak above $126,000.

As Bitcoin (BTC) continues to trade below the pivotal $90,000 mark with no signs of recovery, the prospect of a bear market is becoming increasingly relevant. Analyst Woominkyu from CryptoQuant has shared insights suggesting that the current market dynamics indicate a transition rather than just a temporary pullback.

Could Bitcoin Be Shifting Into A Bear Phase?

In a report released recently, Woominkyu examined the Bitcoin Cycle Momentum Indicator (BCMI), noting that its return to the 0.5 zone on October 21 was interpreted as a cooling phase, rather than indicative of a market peak.

In the weeks following this observation, Bitcoin’s price has seen a noticeable decline alongside a similar drop in BCMI, suggesting that the market is not only experiencing a cooling period but has also reset in terms of price and on-chain momentum.
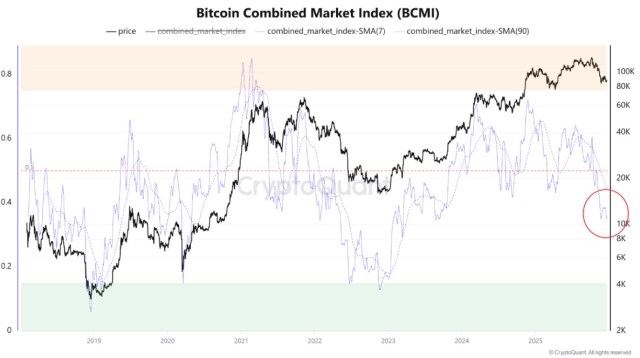
The BCMI index hovering between 0.4 and 0.5 levels. Source: CryptoQuant

Historically, significant cycle bottoms for Bitcoin in 2019 and 2023 occurred when BCMI levels fell between the 0.25 and 0.35 range. These levels are often associated with full sentiment compression and a structural reset within the market.

Currently, while BCMI remains below equilibrium as seen in the chart above, and it is still above the historical bottom zones. This data suggests that Bitcoin may be shifting into a bear phase rather than recovering from a simple pullback.

According to Woominkyu, a more stable bottom may only materialize if BCMI revisits levels seen during the previous cycles from 2019 to 2023.

Bear Market Conditions

In a separate analysis, CryptoQuant indicated that demand for Bitcoin has sharply declined, reinforcing the idea of a bear market. The report pointed to the significant drop in Bitcoin demand growth that has occurred since early October 2025.

Moreover, the report highlights that institutional and large-holder demand is contracting instead of expanding. US spot Bitcoin exchange-traded funds (ETFs) have converted into net sellers during the fourth quarter of 2025, offloading approximately 24,000 BTC.

Additionally, the number of addresses holding between 100 and 1,000 BTC, which typically represent ETFs and treasury firms, is also increasing at a rate below the trend, reflecting the demand deterioration that preceded the bear market of 2022.

The condition of the derivatives markets further corroborates the weakening appetite for risk. Funding rates in perpetual futures have dropped to their lowest levels since December 2023.

Historically, such declines in funding rates indicate a reduced willingness to maintain long positions, a phenomenon commonly associated with bear market conditions rather than bullish trends.

Technical analysis also reveals the deterioration of Bitcoin’s price structure, with the cryptocurrency falling below its 365-day moving average—a crucial long-term support level that has historically delineated bull and bear markets.

Looking ahead, historical data suggests that Bitcoin’s bear market bottoms typically align with its realized price, currently estimated around $56,000. This implies a potential drawdown of approximately 55% from the recent all-time high.

Intermediate support is anticipated around the $70,000 level, suggesting a relatively shallow bear market compared to previous cycles.

The daily chart shows BTC’s price trending downwards since October highs. Source: BTCUSDT on TradingView.com

At the time of writing, BTC was trading at $87,635. This represents year-to-date losses of 10%, as well as a 30.5% gap compared to all-time highs of just above $126,000.

Featured image from DALL-E, chart from TradingView.com

Crypto di tendenza

Domande pertinenti

QWhat does the CryptoQuant analyst suggest about the current Bitcoin market phase based on the BCMI indicator?

AThe analyst suggests that Bitcoin may be shifting into a bear phase rather than recovering from a simple pullback, as the BCMI has returned to the 0.5 zone and then declined alongside the price, indicating a market reset in terms of price and on-chain momentum.

QAccording to the article, what historical BCMI levels are associated with significant cycle bottoms for Bitcoin?

AHistorically, significant cycle bottoms for Bitcoin in 2019 and 2023 occurred when BCMI levels fell between the 0.25 and 0.35 range, which are associated with full sentiment compression and a structural reset within the market.

QWhat evidence does the article provide to show that Bitcoin demand has declined?

AThe article states that demand for Bitcoin has sharply declined since early October 2025, with US spot Bitcoin ETFs becoming net sellers in Q4 2025 (offloading ~24,000 BTC) and the number of addresses holding 100-1,000 BTC increasing below trend, reflecting demand deterioration similar to the 2022 bear market.

QHow does the condition of the derivatives markets support the bear market argument?

AFunding rates in perpetual futures have dropped to their lowest levels since December 2023, indicating a reduced willingness to maintain long positions, which is commonly associated with bear market conditions rather than bullish trends.

QWhat key technical level has Bitcoin fallen below, and what is the potential bottom price mentioned in the article?

ABitcoin has fallen below its 365-day moving average, a crucial long-term support level. The article suggests bear market bottoms typically align with the realized price, currently estimated around $56,000, representing a potential 55% drawdown from the all-time high, with intermediate support around $70,000.

Letture associate

Stocks Fell Even More Violently Than Crypto, Where Did the Money Go?

From June to late July 2026, global stock markets, particularly technology and semiconductor stocks, experienced severe declines, with South Korea's KOSPI index facing historic circuit breakers and shedding 40% from its June peak. Key catalysts included SK Hynix's earnings miss despite record profits and competitive pressures from China's CXMT IPO. A global forced deleveraging event unfolded, devastating highly leveraged instruments like the 2x leveraged SK Hynix ETF, which lost over 80% of its value. Surprisingly, Bitcoin showed relative stability during this period, rising roughly 15% from its July low. The article clarifies this wasn't due to an inflow of equity flight capital but because Bitcoin had already undergone a significant correction in May and June, with U.S. spot Bitcoin ETFs seeing record outflows. True safe-haven flows went to gold, severing Bitcoin's short-term "digital gold" narrative. The sell-off is characterized not as an AI story collapse but a liquidity-driven清算 of crowded leveraged positions, potentially halfway through according to some analysts. For substantial capital to return to Bitcoin, the article cites necessary conditions: eased global liquidity pressure, a soft-landing Fed rate cut, and regulatory clarity from the stalled U.S. CLARITY Act. The conclusion is that Bitcoin is not a current safe haven but a pre-cleared asset. Its decoupling from tech stocks highlights its potential future role as a non-correlated asset for institutional portfolios, positioning it favorably for when global capital reallocates post-crisis.

marsbit7 min fa

Stocks Fell Even More Violently Than Crypto, Where Did the Money Go?

marsbit7 min fa

"The Final Phase Before the New Cycle". What Will Happen to Bitcoin in August

"Bitcoin Faces Crucial Test in August: Experts Predict Consolidation or Further Decline" The price of Bitcoin (BTC) is expected to remain under pressure in August, with experts anticipating either consolidation within a narrow range or a potential drop below $60,000. Despite a double-digit recovery from its July low near $58,000, BTC ended the month trading around $63,500, still roughly 50% below its October 2025 peak of $126,200. Analysts cite several headwinds: a challenging macroeconomic environment with high US interest rates and persistent inflation, which makes fixed-income assets more attractive than speculative ones like crypto. Furthermore, competition for capital is intense, with many investors favoring AI-related stocks. This is reflected in significant outflows from US spot Bitcoin ETFs, with a record $4.5 billion leaving in June and a net outflow of $5.4 billion for the first half of the year. Historically, August is a weak month for crypto, with a median return of -7.49% from 2013 to 2025. Experts also note regulatory uncertainty in the US, particularly the stalled CLARITY Act, as a dampening factor. Despite the bearish near-term outlook, several experts view the current phase as the "last phase before a new Bitcoin cycle" begins, potentially in Q4 2024. This makes it a favorable time for accumulating Bitcoin for the long term. Key price levels to watch are support at $60,000-$61,000, with a break below $58,000 potentially leading to $53,000-$55,000. A move above $67,000 could target $70,000-$75,000, though this is considered a lower probability scenario.

cryptonews.ru13 min fa

"The Final Phase Before the New Cycle". What Will Happen to Bitcoin in August

cryptonews.ru13 min fa

What Structural Changes Have Occurred in the Cryptocurrency Industry by 2026?

By 2026, the crypto industry is undergoing profound structural shifts, moving beyond price speculation towards deeper integration with the real-world economy. Major changes are driven by four key areas. First, stablecoins, now a $300B+ market, are evolving from crypto-native trading tools into real-world payment and B2B settlement backbones, extending business chains and creating complex accounting and tax obligations. Second, global regulation is maturing. Frameworks like the EU's MiCA are moving from legislation to active enforcement, determining market access. Anti-money laundering rules, such as the Travel Rule, see wider adoption but face enforcement and cross-border challenges. Third, AI Agents are emerging as autonomous transaction entities. Protocols like Coinbase's x402 enable machine-to-machine micropayments using stablecoins, necessitating new frameworks for transaction authorization, tax attribution, and audit trails. Finally, tax transparency is entering an implementation phase. Initiatives like the OECD's CARF, EU's DAC8, and the US Form 1099-DA are shifting reporting burdens to platforms, requiring them to reconcile on-chain data with user identity and tax residency information. Collectively, these trends signify that crypto compliance is becoming foundational infrastructure, requiring consistent data and control systems to meet cross-border operational, regulatory, and audit demands.

marsbit34 min fa

What Structural Changes Have Occurred in the Cryptocurrency Industry by 2026?

marsbit34 min fa

Trading

Spot

Articoli Popolari

Come comprare O

Benvenuto in HTX.com! Abbiamo reso l'acquisto di O1 exchange (O) semplice e conveniente. Segui la nostra guida passo passo per intraprendere il tuo viaggio nel mondo delle criptovalute.Step 1: Crea il tuo Account HTXUsa la tua email o numero di telefono per registrarti il tuo account gratuito su HTX. Vivi un'esperienza facile e sblocca tutte le funzionalità,Crea il mio accountStep 2: Vai in Acquista crypto e seleziona il tuo metodo di pagamentoCarta di credito/debito: utilizza la tua Visa o Mastercard per acquistare immediatamente O1 exchangeO.Bilancio: Usa i fondi dal bilancio del tuo account HTX per fare trading senza problemi.Terze parti: abbiamo aggiunto metodi di pagamento molto utilizzati come Google Pay e Apple Pay per maggiore comodità.P2P: Fai trading direttamente con altri utenti HTX.Over-the-Counter (OTC): Offriamo servizi su misura e tassi di cambio competitivi per i trader.Step 3: Conserva O1 exchange (O)Dopo aver acquistato O1 exchange (O), conserva nel tuo account HTX. In alternativa, puoi inviare tramite trasferimento blockchain o scambiare per altre criptovalute.Step 4: Scambia O1 exchange (O)Scambia facilmente O1 exchange (O) nel mercato spot di HTX. Accedi al tuo account, seleziona la tua coppia di trading, esegui le tue operazioni e monitora in tempo reale. Offriamo un'esperienza user-friendly sia per chi ha appena iniziato che per i trader più esperti.

428 Totale visualizzazioniPubblicato il 2026.06.19Aggiornato il 2026.06.29

Come comprare O

Come comprare PROS

Benvenuto in HTX.com! Abbiamo reso l'acquisto di Pharos (PROS) semplice e conveniente. Segui la nostra guida passo passo per intraprendere il tuo viaggio nel mondo delle criptovalute.Step 1: Crea il tuo Account HTXUsa la tua email o numero di telefono per registrarti il tuo account gratuito su HTX. Vivi un'esperienza facile e sblocca tutte le funzionalità,Crea il mio accountStep 2: Vai in Acquista crypto e seleziona il tuo metodo di pagamentoCarta di credito/debito: utilizza la tua Visa o Mastercard per acquistare immediatamente PharosPROS.Bilancio: Usa i fondi dal bilancio del tuo account HTX per fare trading senza problemi.Terze parti: abbiamo aggiunto metodi di pagamento molto utilizzati come Google Pay e Apple Pay per maggiore comodità.P2P: Fai trading direttamente con altri utenti HTX.Over-the-Counter (OTC): Offriamo servizi su misura e tassi di cambio competitivi per i trader.Step 3: Conserva Pharos (PROS)Dopo aver acquistato Pharos (PROS), conserva nel tuo account HTX. In alternativa, puoi inviare tramite trasferimento blockchain o scambiare per altre criptovalute.Step 4: Scambia Pharos (PROS)Scambia facilmente Pharos (PROS) nel mercato spot di HTX. Accedi al tuo account, seleziona la tua coppia di trading, esegui le tue operazioni e monitora in tempo reale. Offriamo un'esperienza user-friendly sia per chi ha appena iniziato che per i trader più esperti.

394 Totale visualizzazioniPubblicato il 2026.06.22Aggiornato il 2026.06.29

Come comprare PROS

Cosa è VERONA

I. Introduzione al Progetto VERONA è una blockchain costruita per tutti, ovunque attraverso l'astrazione della catena. Utilizzando il suo livello di astrazione generalizzato, VERONA si distingue integrando funzionalità blockchain complesse, come conti, firme e interoperabilità, direttamente a livello di protocollo. Questo approccio consente di interagire con le applicazioni blockchain senza la necessità di comprendere le tecnologie sottostanti.1) Informazioni di Base Nome:VERONA(VERONA)III. Link Correlati Link al sito ufficiale:https://xion.burnt.com/ Whitepaper:https://xion.burnt.com/whitepaper.pdf Esploratori:https://explorer.burnt.com/ Social Media: https://x.com/burnt_xion Nota: L'introduzione al progetto proviene dai materiali pubblicati o forniti dal team ufficiale del progetto, che è solo a scopo di riferimento e non costituisce consulenza per investimenti. HTX non si assume responsabilità per eventuali perdite dirette o indirette risultanti.

361 Totale visualizzazioniPubblicato il 2026.06.22Aggiornato il 2026.06.22

Cosa è VERONA

Discussioni

Benvenuto nella Community HTX. Qui puoi rimanere informato sugli ultimi sviluppi della piattaforma e accedere ad approfondimenti esperti sul mercato. Le opinioni degli utenti sul prezzo di A A sono presentate come di seguito.

活动图片