Author: Dune
Compiled by: Felix, PANews
Recently, Dune collaborated with Steakhouse Financial to launch a stablecoin dataset. This dataset covers dimensions such as holder composition, capital flow, on-chain behavior classification, and velocity, providing a basis for institutional-level analysis, research reports, compliance monitoring, and high-level decision-making. By interpreting the dataset, Dune published an article revealing some of the true realities of the stablecoin market. Details are as follows.
Everyone cites stablecoin supply data. It's everywhere—in every report, every earnings call, every policy hearing. But beyond the number "over $300 billion in circulation," how much do we really know about stablecoins?
Who holds them? How concentrated is the ownership? How fast do they circulate? On which blockchains do they operate? What are their actual uses? Are they for DeFi liquidity, payments, or simply idle capital?
With Meta announcing plans to integrate third-party stablecoin payments on its platform; Bridge receiving approval from the U.S. Office of the Comptroller of the Currency (OCC) to form a national trust bank; Payoneer enabling stablecoin functionality for 2 million merchants; and Anchorage Digital launching compliant stablecoin services for non-U.S. banks. Institutions and regulators are entering the scene in full force, and they need answers far deeper than a single supply figure.
We use Dune's newly released stablecoin dataset to answer these questions. Here's what the data reveals:
Supply Overview
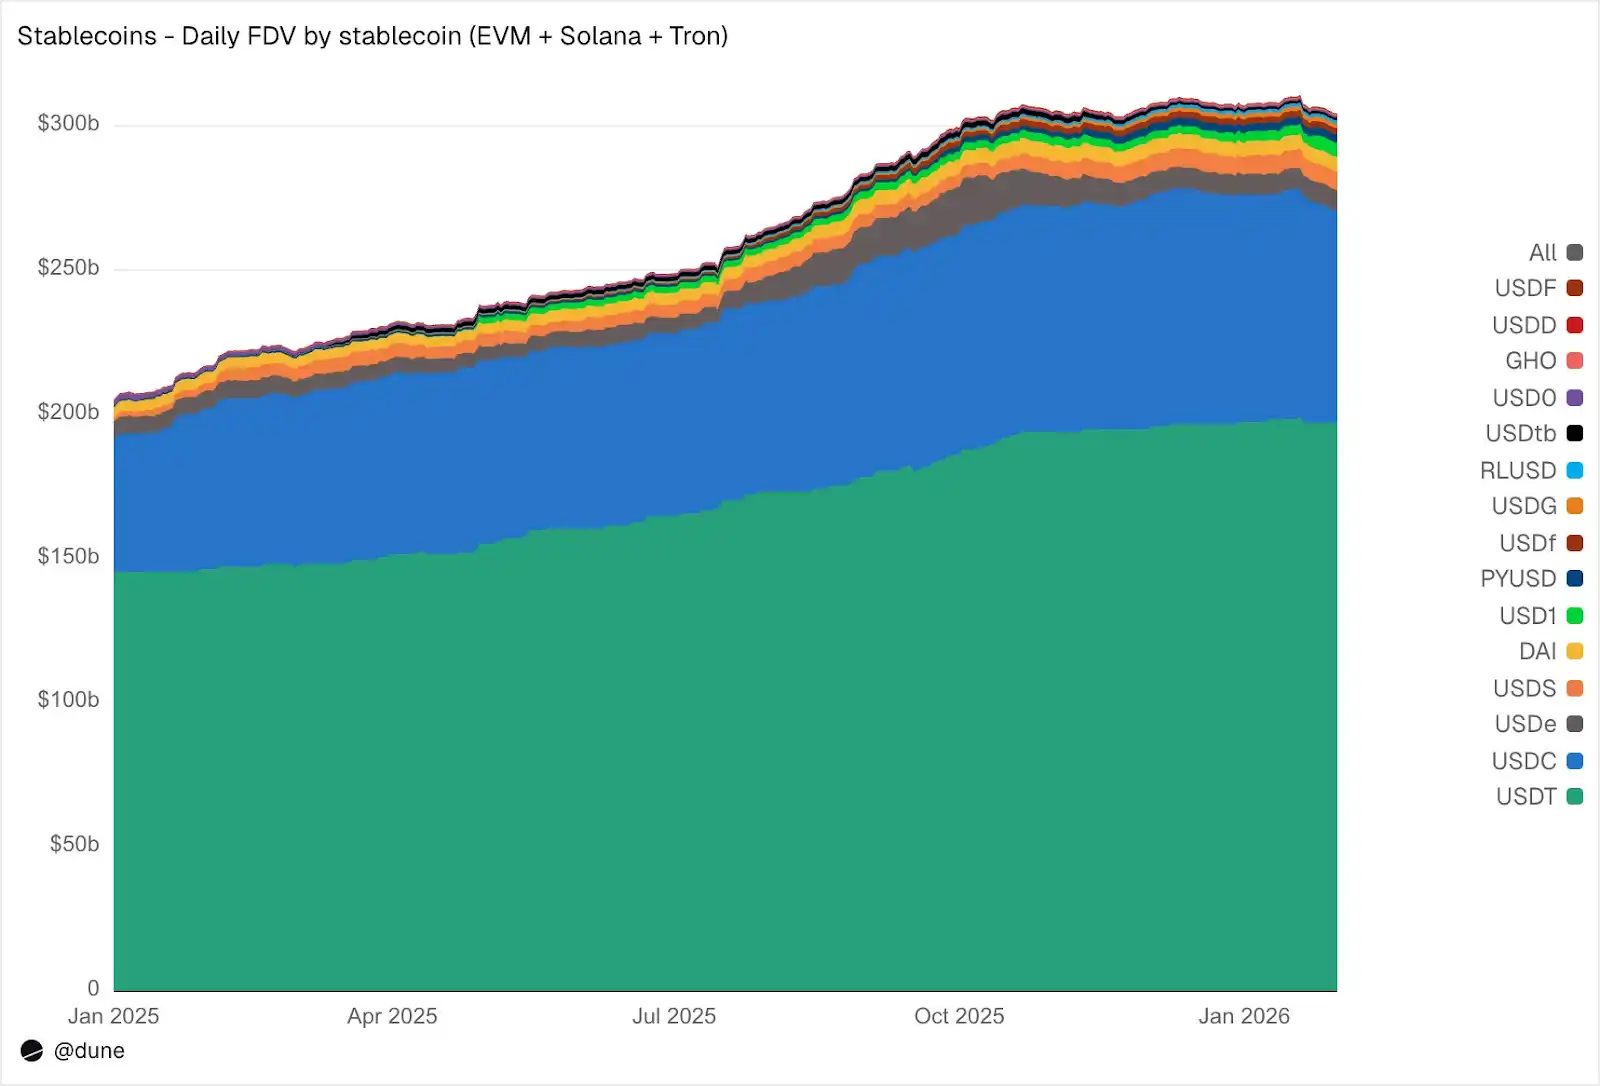
As of January 2026, the fully diluted supply of the 15 largest stablecoins on EVM-compatible chains, Solana, and Tron reached $304 billion, a year-on-year increase of 49%. Tether's USDT ($197 billion) and Circle's USDC ($73 billion) still dominate with an 89% market share.
By chain, Ethereum holds $176 billion (58%); Tron holds $84 billion (28%); Solana holds $15 billion (5%); BNB Chain holds $13 billion (4%). Although the total supply has nearly doubled, the distribution across chains has changed little over the past year.
Source: Dune
But beyond the two major stablecoins, 2025 was the "year of the challengers." USDS (Sky Ecosystem) market cap grew 376% to $6.3 billion. PYUSD (PayPal) market cap grew 753% to $2.8 billion. RLUSD (Ripple) market cap soared from $58 million to $1.1 billion, a staggering 1803% increase. USDG market cap grew 52 times. And USD1 market cap jumped from zero to $5.1 billion.
But not all challengers grew. USD0 fell by 66%, and Ethena's USDe, after peaking in October (almost tripling), ended the year up 23%. Even so, the group of competitors beneath USDT and USDC has expanded significantly.
Who Holds Stablecoins
Most stablecoin datasets can only tell you the total supply. Because our dataset tracks wallet-level balances and address labels, it can tell you *who* holds these stablecoins.
Source: Dune
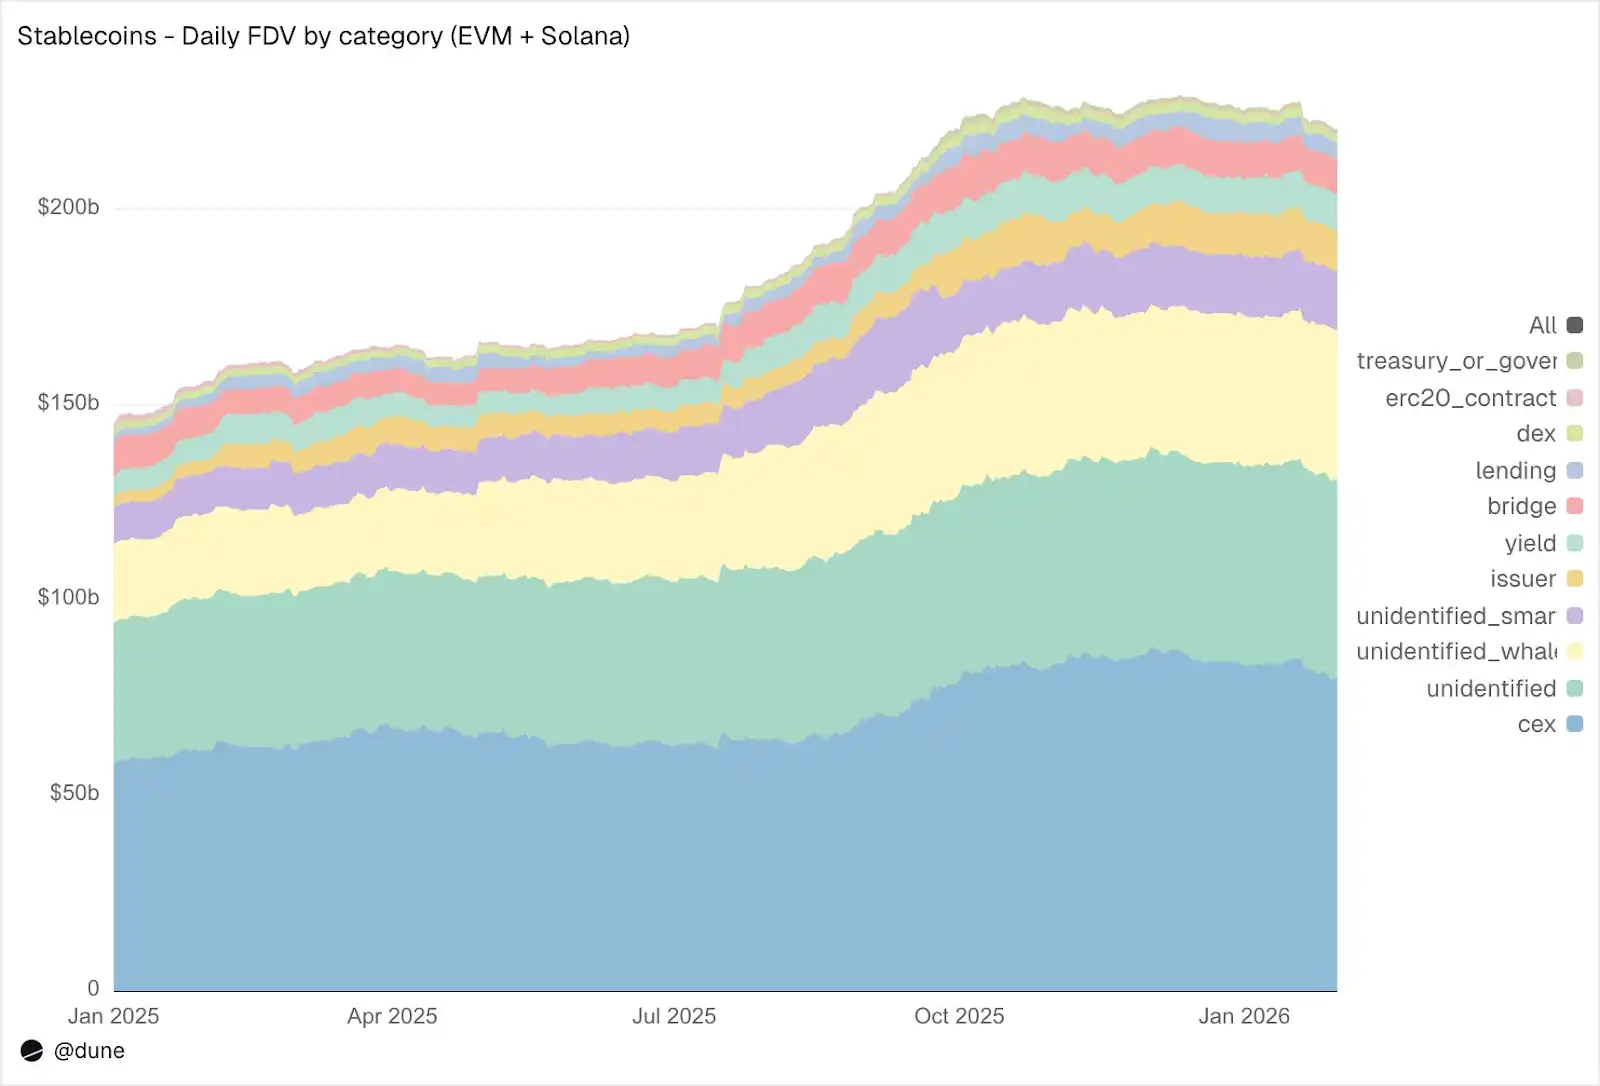
On EVM and Solana, CEXs are the largest known holding group, at $80 billion (up from $58 billion last year). The primary function of stablecoins remains trading and settlement infrastructure on exchanges. Whale wallets hold $39 billion. Holdings in yield protocols nearly doubled to $9.3 billion, reflecting the growth of on-chain yield strategies. Issuer addresses (treasuries and mint/burn contracts) jumped 4.6 times from $2.2 billion to $10.2 billion, directly reflecting the scale of new supply entering the market.
On label quality: Only 23% of the supply is in completely unidentified addresses. This is an extremely high identification rate for on-chain data. And this is crucial for understanding the actual sources of risk for stablecoins.
170 Million Holders, But Highly Concentrated
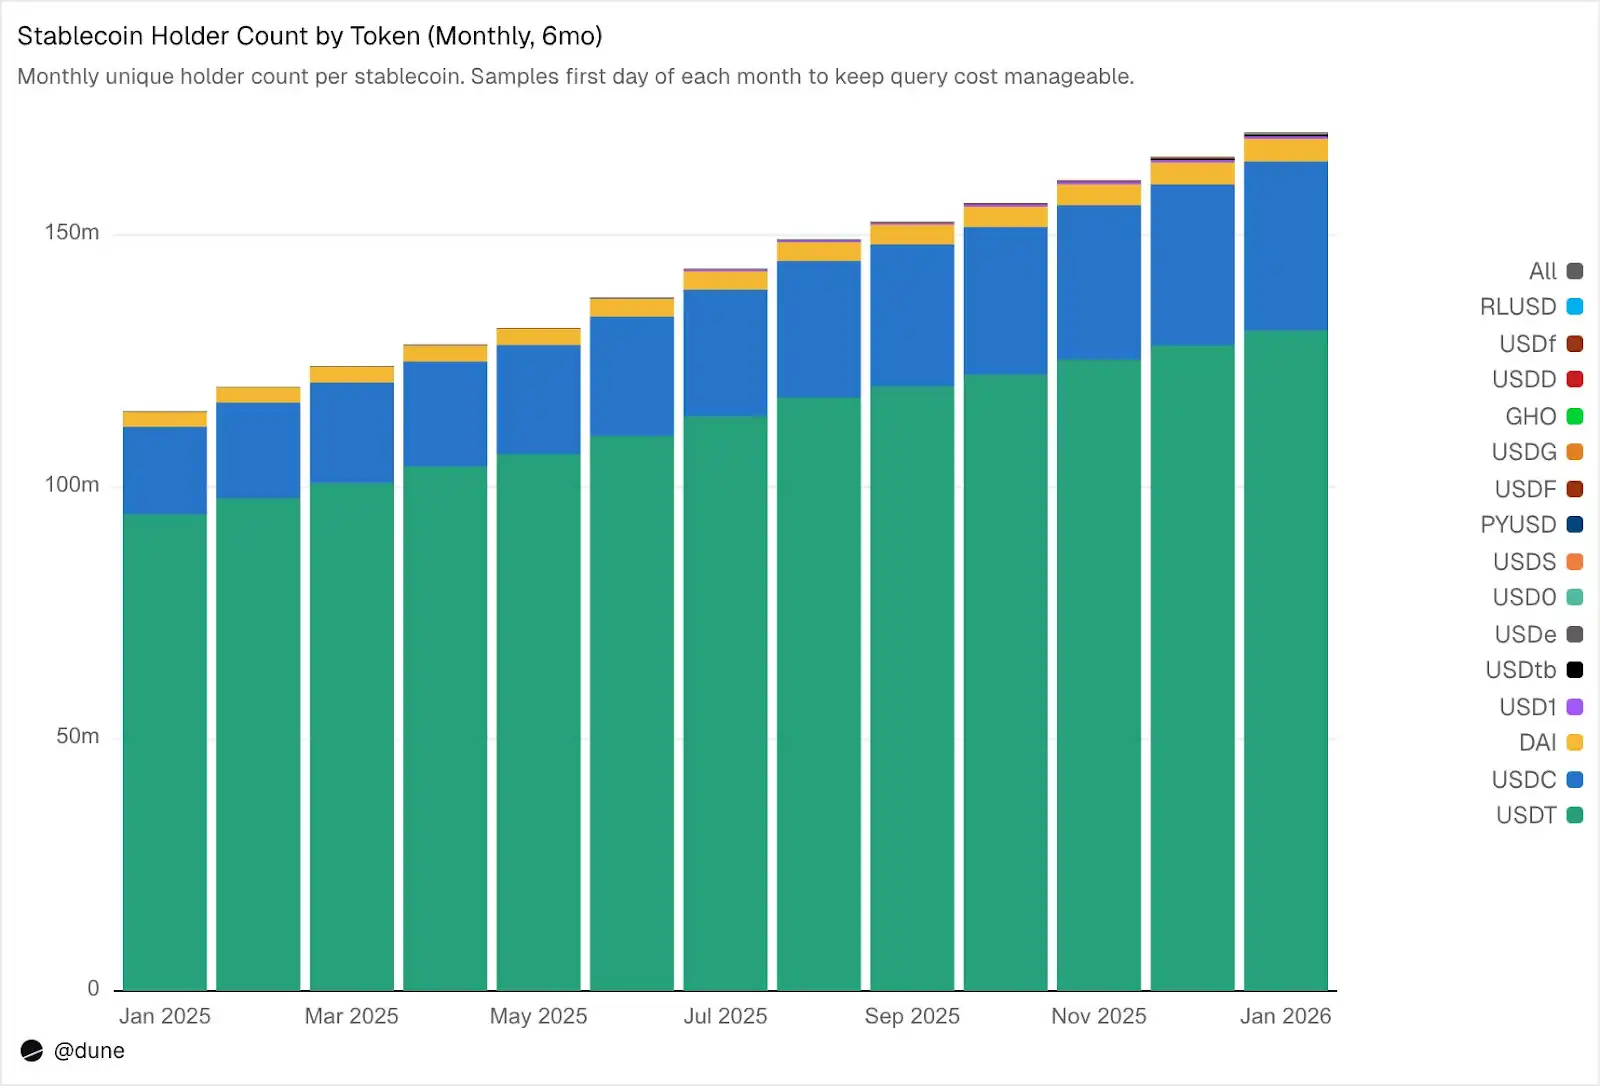
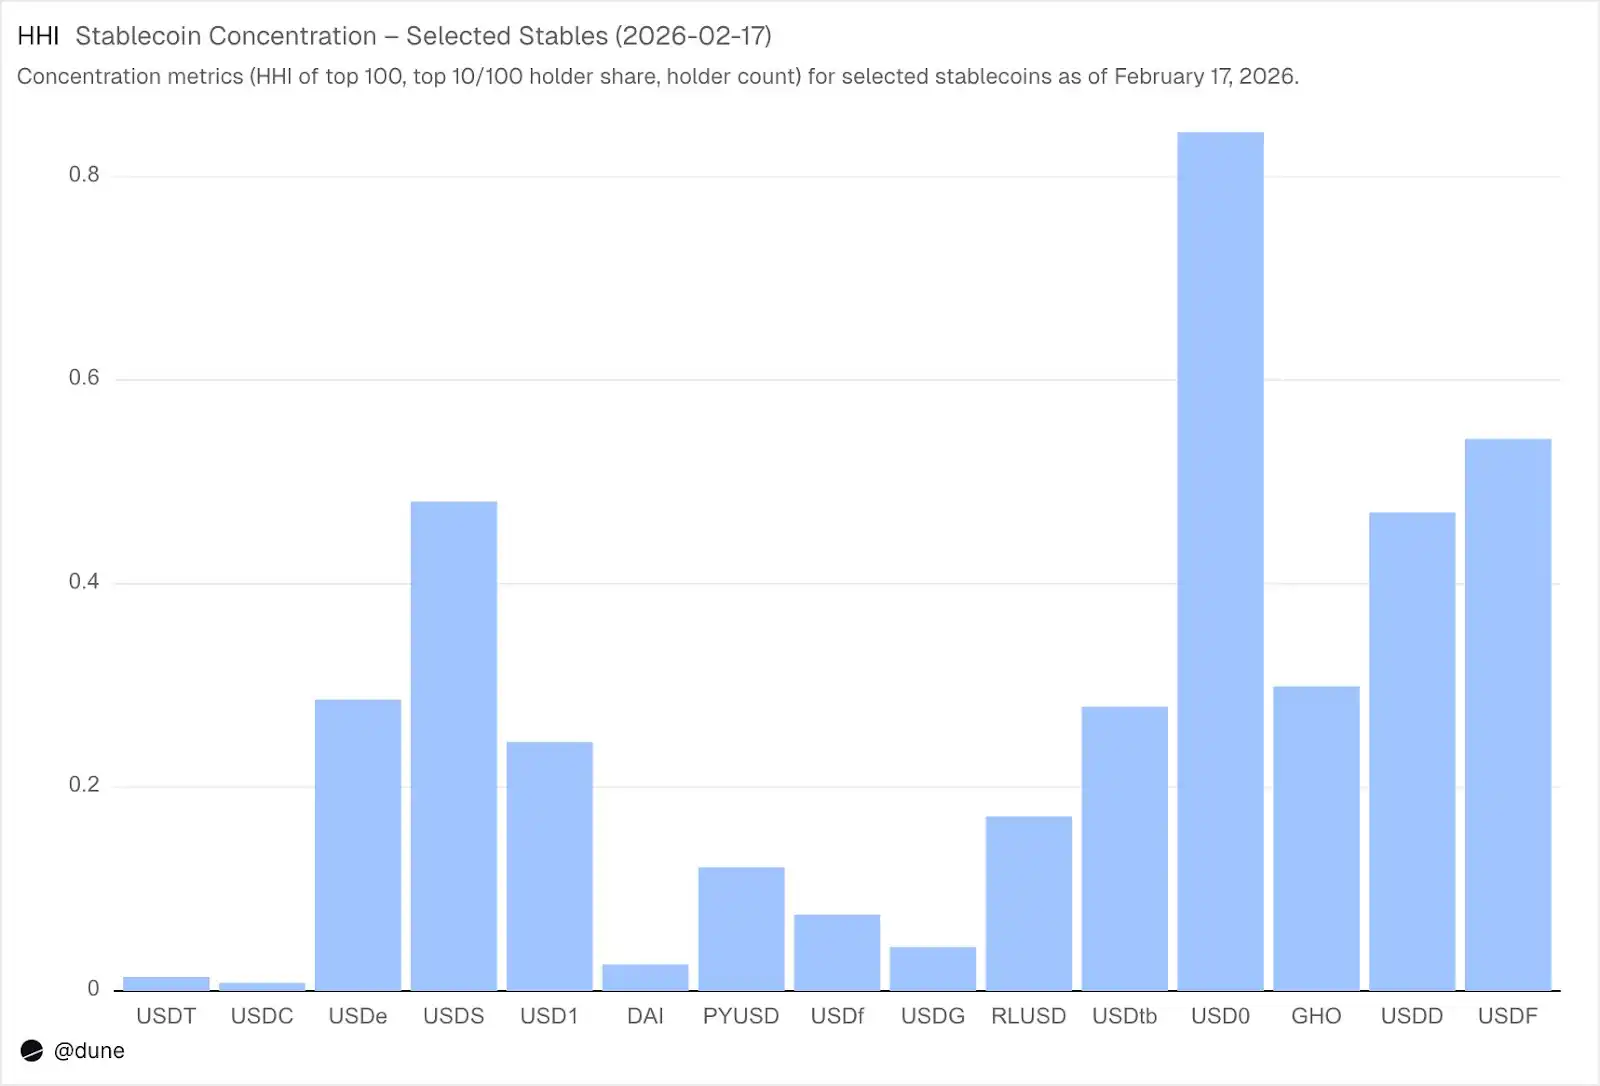
As of February 2026, 172 million unique addresses hold at least one of these 15 stablecoins. USDT accounts for 136 million, USDC for 36 million, and DAI for 4.7 million. The distribution of these three is very broad: their top 10 wallets hold only 23-26% of the supply, with an HHI (Herfindahl-Hirschman Index, a standard economic concentration measure where 0 is perfectly dispersed and 1.0 is a single holder) below 0.03.
Source: Dune
However, the story is completely different for other stablecoins. The top 10 wallets hold 60-99% of the supply. USDS, despite a circulating supply of $6.9 billion, is 90% concentrated in 10 wallets (HHI 0.48); USDF is 99% concentrated in the top 10 (HHI 0.54); USD0 is the most extreme, with 99% concentration in the top 10 (HHI 0.84), meaning even among these large holders, the supply is dominated by one or two wallets.
Source: Dune
This doesn't mean these stablecoins are problematic; some are newer, some are institutionally focused by design. But it does mean their supply data should be treated differently from USDT or USDC. Concentration affects de-pegging risk, liquidity depth, and whether the supply reflects natural demand or that of a few large participants. This type of analysis is only possible when you have the balances of all holders, not just aggregated data from mint/burn events.
$10.3 Trillion in Transfer Volume in January
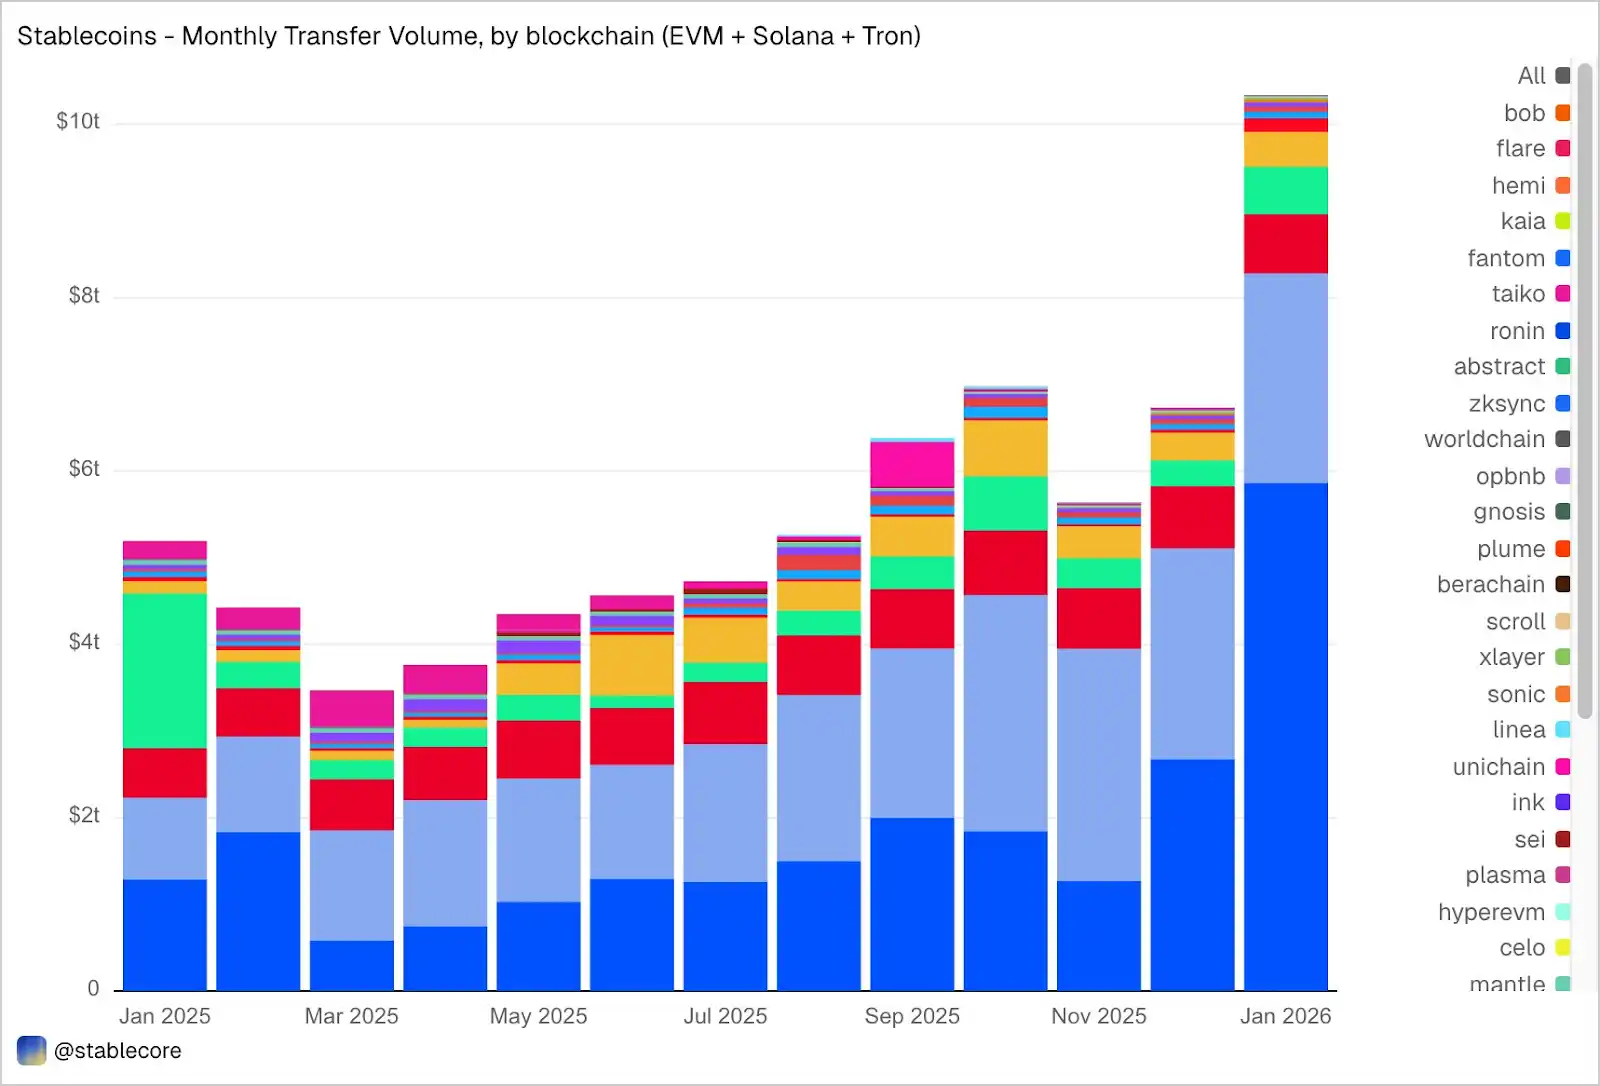
Stablecoin transfer volume on EVM, Solana, and Tron reached $10.3 trillion in January, more than double that of January 2025. The distribution of on-chain volume is striking and differs markedly from supply share: Base, with a supply of only $4.4 billion, led with $5.9 trillion in volume; Ethereum had $2.4 trillion; Tron had $682 billion; Solana had $544 billion; BNB Chain had $406 billion.
Source: Dune
By token, USDC dominated with $8.3 trillion, almost five times that of USDT ($1.7 trillion), despite having a supply 2.7 times smaller. USDC clearly transfers much faster and more frequently than USDT. DAI volume was $138 billion, USDS was $92 billion, USD1 was $43 billion.
Importantly, this data is neutral. The dataset does not pre-filter transfers based on a fixed interpretation of "real" economic activity, so the totals may include flows related to arbitrage, bots, internal routing, or other automated behavior. Our goal is to present an objective, complete picture of on-chain activity, giving users the flexibility to apply their own filters. For example, removing bot-driven volume, separating organic usage, or defining transaction activity measures that better match reality.
What Are Stablecoins Actually Doing?
The transfers in this dataset are not just labeled as "volume" but are categorized into specific on-chain activities:
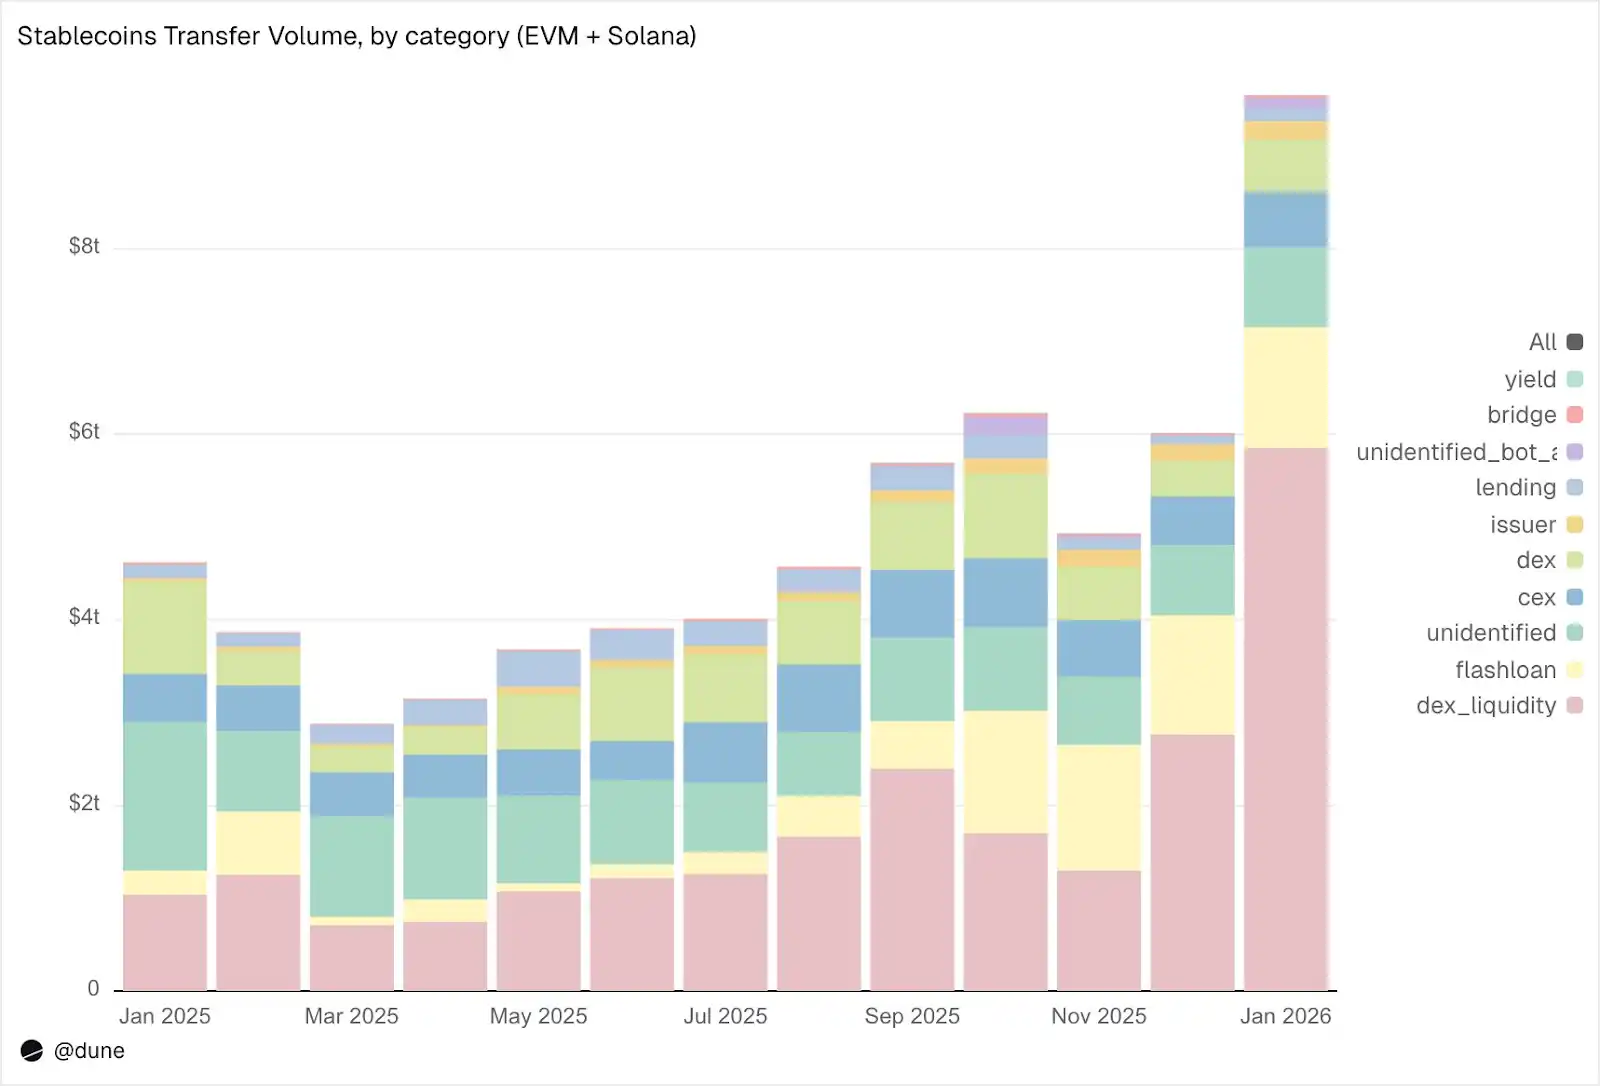
January breakdown:
1. Market Infrastructure (DEX Trading & Liquidity):
DEX Liquidity Supply & Withdrawal: $5.9 trillion. This is the single largest use case, reflecting the role of stablecoins as the base asset for on-chain market making.
DEX Swaps: $376 billion. Direct trading activity through automated market makers.
Together, these two categories show that stablecoins primarily function as trading collateral and liquidity infrastructure. It's noteworthy that the volume is concentrated in incentive-driven activities (like yield farming and active capital optimization) rather than pure trading demand.
2. Leverage & Capital Efficiency (Lending + Flash Loans)
Flash Loans (Borrow & Repay): $1.3 trillion. Automated arbitrage and liquidation loops.
Lending Activity: Supply, Borrow, Repay, Withdraw, $137 billion. Represents short-term capital efficiency and structured credit on-chain.
3. Access Channels (CEX & Bridges)
CEX Flow: Deposits ($224 billion), Withdrawals ($224 billion), Internal Transfers ($151 billion), Total $599 billion.
Cross-chain Bridge Deposits & Withdrawals: $28 billion. These flows indicate the important role stablecoins play in settlement between CEXs and across chains.
4. Issuance Layer (Monetary Operations)
Issuer Operations: Mint ($28 billion), Burn ($20 billion), Depeg Operations ($23 billion), Other Activities, Total $106 billion. Nearly 5 times the $42 billion from the same period last year.
5. Yield Protocols
Yield Protocol Activity: $2.7 billion. This is a smaller but structurally important segment, closely tied to structured strategies and on-chain asset management.
Overall, 90% of the transfer volume flows through identified activity categories, providing a detailed view of how stablecoins move through every layer of the on-chain tech stack.
Velocity: Same Token, Different Worlds
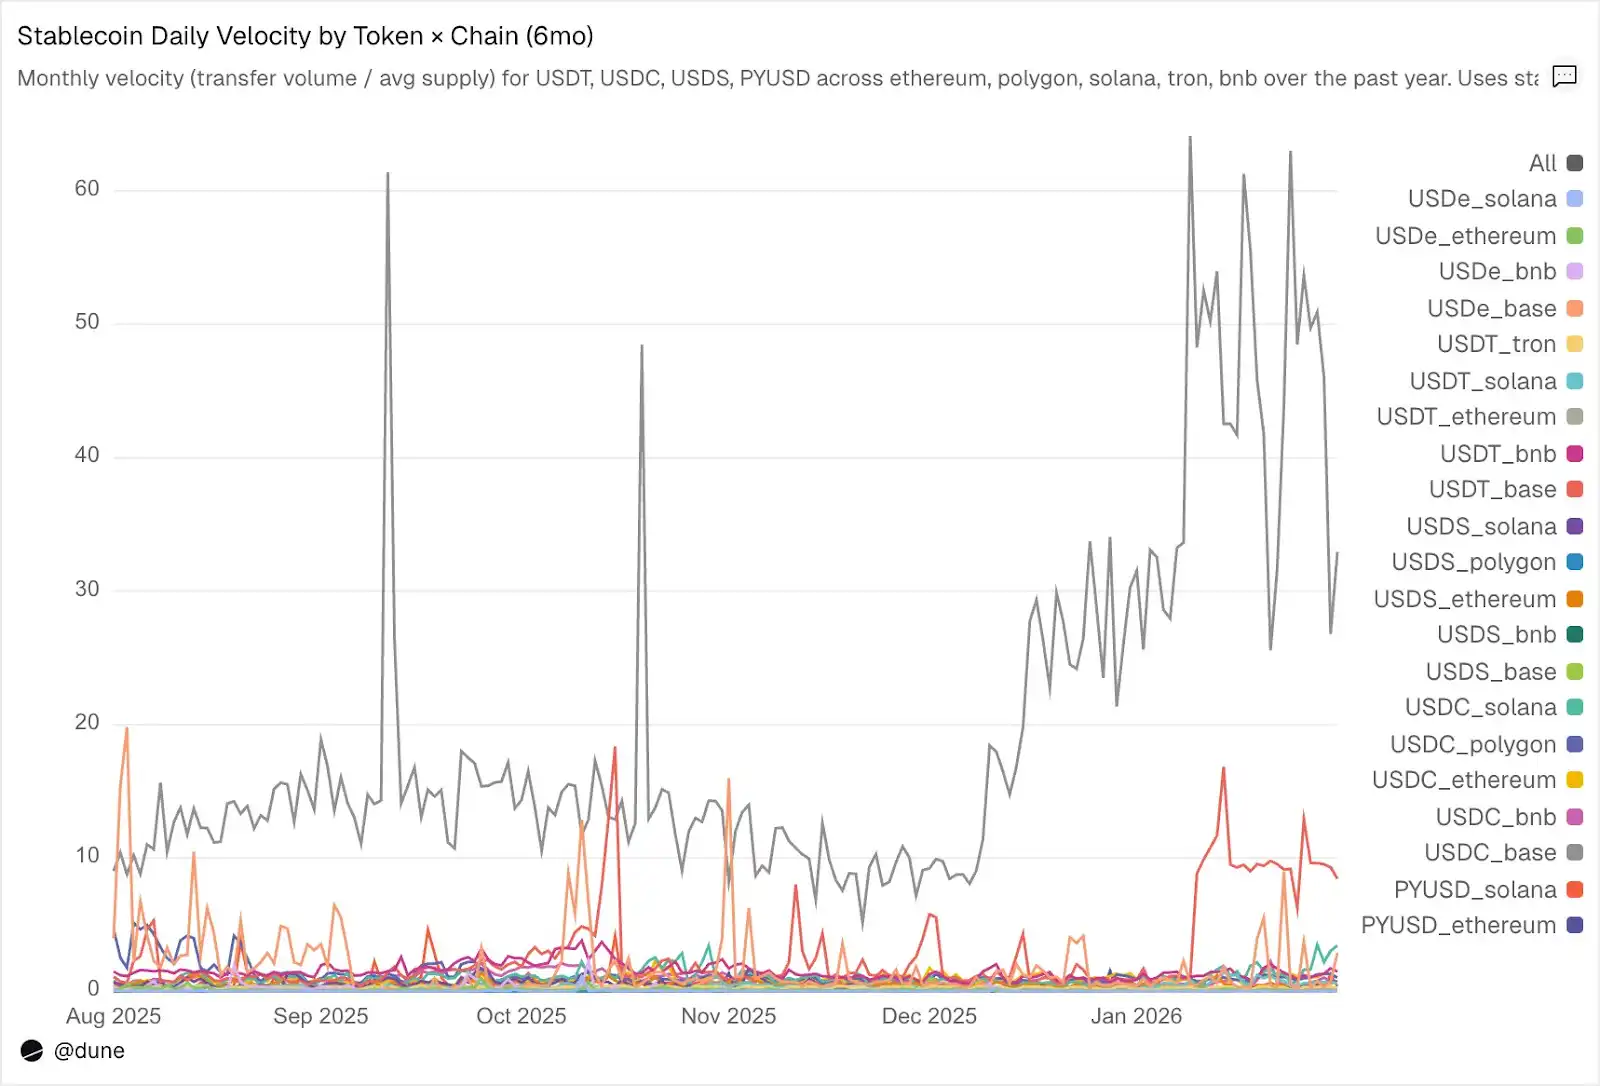
Daily Turnover Rate (transfer volume divided by supply) is perhaps the most underrated metric in stablecoin analysis. It reflects how actively a stablecoin is used as a medium of exchange, not just held.
Among the tokens we analyzed, USDC and USDT again stand out, albeit with differences between them.
Source: Dune
USDC has the fastest velocity on L2s and Solana. On Base, USDC's average daily velocity is a staggering 14x, a figure driven largely by high-frequency trading activity in DeFi. On Solana and Polygon, it's around 1x; on Ethereum, it's also 0.9x, meaning almost its entire supply is traded every day.
USDT is fastest on BNB and Tron. Its average daily velocity on BNB Chain is 1.4x, reflecting active trading; on Tron, the average daily velocity is 0.3x, lower volume but exceptionally stable, consistent with its role as a primary channel for cross-border payments. On Ethereum, however, USDT's average daily velocity is only 0.2x, with over $100 billion in supply largely sitting idle.
USDe and USDS have slower velocities, by design. USDe on Ethereum has an average daily velocity of just 0.09x, while USDS's is 0.5x. Both are designed as yield-bearing stablecoins: USDe is often staked into sUSDe to capture yield from Ethena's delta-neutral strategy; USDS is deposited into the Sky Savings Rate for protocol-subsidized yield. Thus, a large portion of the supply remains idle in savings contracts, lending markets like Aave, or structured yield loops. Low velocity is not a disadvantage but a feature: these assets are designed to accrue yield, not circulate.
The chain matters more than the token. PYUSD on Solana has a daily velocity of 0.6x, four times its velocity on Ethereum (0.1x). The same token, but vastly different usage patterns in different ecosystems.
Supply and volume each tell part of the story. Velocity connects them, measuring in a single metric whether a stablecoin on a specific chain is functioning as active infrastructure or exists as idle capital.
Beyond the Dollar
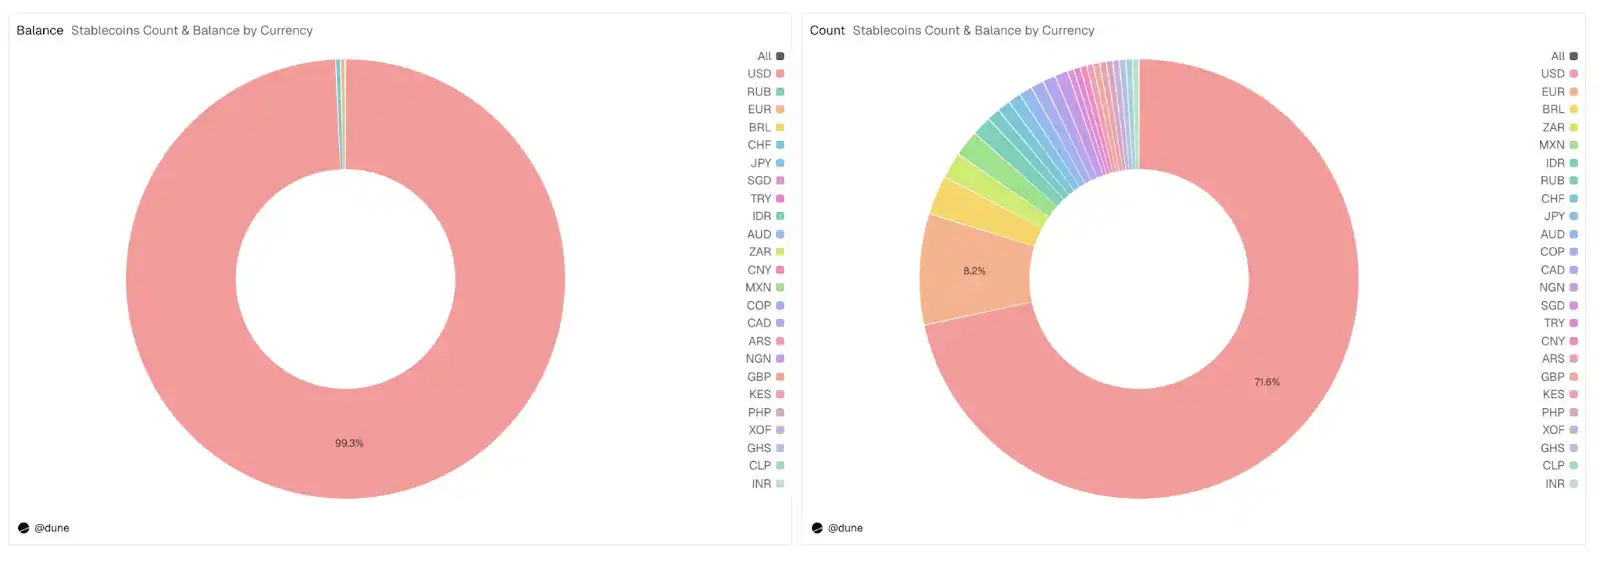
This analysis focused on 15 USD stablecoins, but the full dataset is broader. It tracks over 200 stablecoins, representing 20+ currencies: Euro (17 tokens, $990 million supply), Brazilian Real ($141 million), Japanese Yen ($13 million), as well as tokens denominated in Nigerian Naira, Kenyan Shilling, South African Rand, Turkish Lira, Indonesian Rupiah, Singapore Dollar, and more.
Source: Dune
Non-USD stablecoin supply is currently only $1.2 billion, but with 59 tokens spanning six continents, they represent nearly 30% of the total tokens in the dataset. The infrastructure for local currency stablecoins is being built on-chain, and the data to track their development is ready.
Related reading: The Hidden War Behind Stablecoins: Who Becomes the "Biggest Winner" Among Issuers, Applications, and Users?