Bitcoin's Weak Rebound Fails to Mask Adjustment Trend, HYPE's Top Signal Warns of Short-Term Risks | Invited Analysis

marsbitPubblicato 2026-06-01Pubblicato ultima volta 2026-06-01

Introduzione

**Title:** Bitcoin's Weak Rebound Fails to Mask Downtrend; HYPE Top Signal Alerts of Short-Term Risks | Exclusive Analysis **Abstract:** This weekly market analysis examines the current technical structures of Bitcoin and HYPE, outlining key trading strategies. Bitcoin's daily chart shows it has broken below the median line of its primary ascending channel, indicating structural weakness. It is currently experiencing a weak rebound within a short-term descending channel, targeting resistance at $75,000-$76,000. Failure to break above this zone could lead to a resumption of the downtrend, testing support at $69,500-$70,500. Trading strategies include positioning for a rebound rejection (Plan A) or a breakdown below key support (Plan B) with controlled short positions. For HYPE, the 4-hour chart reveals a potential seven-wave advance from the May 14 low, now showing signs of exhaustion. A bearish divergence (momentum weakening) has been observed, coupled with a top signal from the proprietary "Spread Trading Model" at potential endpoint 47. The key this week is to monitor if a confirmed top forms here, especially upon a breach of the $62.5-$64.57 support area. If broken, a larger corrective move towards $54-$56.30 is anticipated. The short-term strategy for HYPE focuses on cautious long entries only upon confirmed stabilization within the support zone. The report also details a successful short BTC trade from the previous week, yielding a ~5.07% profit, executed based on mod...

This Week's Core: Has Bitcoin's daily structure weakened? Can the short-term rebound effectively break through the upper boundary of the descending channel? Has the HYPE's seven-segment rise reached its end? The following sections analyze the current market structure from multiple timeframes, systematically sort out the current market pattern, and formulate this week's medium- and short-term trading strategies for reference.

Summary of This Week's Core Trading Views:

• Analysis of BTC's multi-timeframe trend structure. (Detailed in Part 1)

• BTC's market outlook and medium/short-term trading strategies for this week. (Detailed in Part 2)

• Analysis of HYPE's hourly chart structure. (Detailed in Part 3)

• HYPE's market outlook and short-term trading strategies for this week. (Detailed in Part 4)

Market Validation of Last Week's Trading Strategies and Core Views:

• Effectiveness of BTC short-term trades: Bitcoin completed one short-term short trade last week (1x leverage), achieving a profit of approximately 5.07%. (Detailed in Table 1)

• Market validation of BTC trend forecast: Last week's article pointed out that Bitcoin was continuing its adjustment pattern with a volatile downtrend, with the short-term strategy focusing on "selling on rallies." The current market movement has validated our previous forecast.

一、Analysis of Bitcoin's Multi-Timeframe Trend Structure

1、BTC Daily Chart Structure Analysis

Bitcoin _ Daily Candlestick Chart:
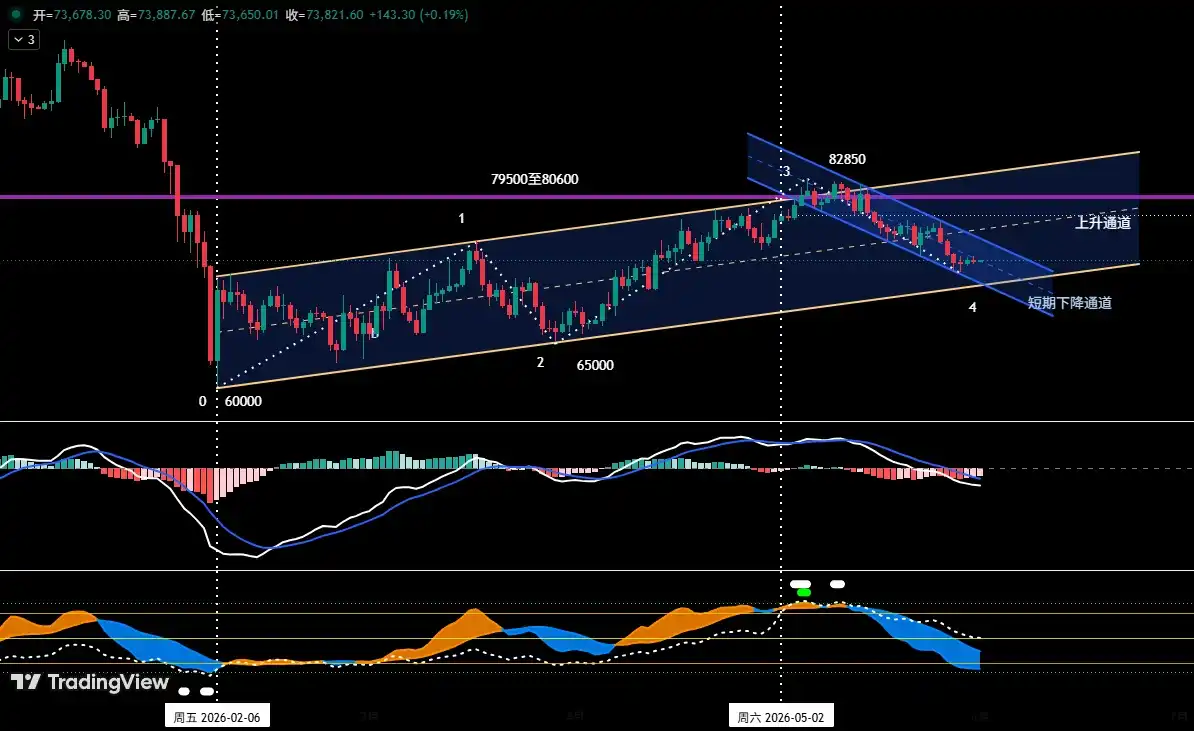
Figure 1

Ascending Channel (Yellow): As shown in (Figure 1), since the low on February 6, 2026, Bitcoin has maintained a volatile uptrend within an ascending channel. (Lower boundary: connecting the lows of Feb 6 and Mar 29; Upper boundary: a line drawn parallel to the lower boundary through the high of Mar 17)

Short-Term Descending Channel (Blue): After touching the high of $82,850 on May 6, Bitcoin has been operating within a short-term descending channel. (Upper boundary: connecting the two rebound highs on May 14 and May 26; Lower boundary: connecting the two adjustment lows on May 7 and May 23)

Based on the Ascending Channel (Yellow), the price has broken below the channel's median line and is seeking stronger support near the lower boundary.

Based on the Short-Term Descending Channel (Blue), the price found brief support after falling to the channel's lower boundary (around $72,500) and is currently in a period of weak rebound towards the channel's upper boundary.

Comprehensive Judgment: Technically, Bitcoin is facing dual influences from both long-term and short-term channels. The current rebound is mainly a correction for short-term oversold conditions, targeting the upper boundary of the short-term descending channel (Blue). However, as the price has broken below the median line of the ascending channel (Yellow), the overall technical structure has weakened. It is expected that after the rebound ends, the price will likely resume the previous downtrend and further test the support strength of the ascending channel's lower boundary.

2、In-Depth Analysis of BTC's Hourly Chart Structure: (Using the 4-hour chart as the analysis period)

Bitcoin _ 4-Hour Candlestick Chart
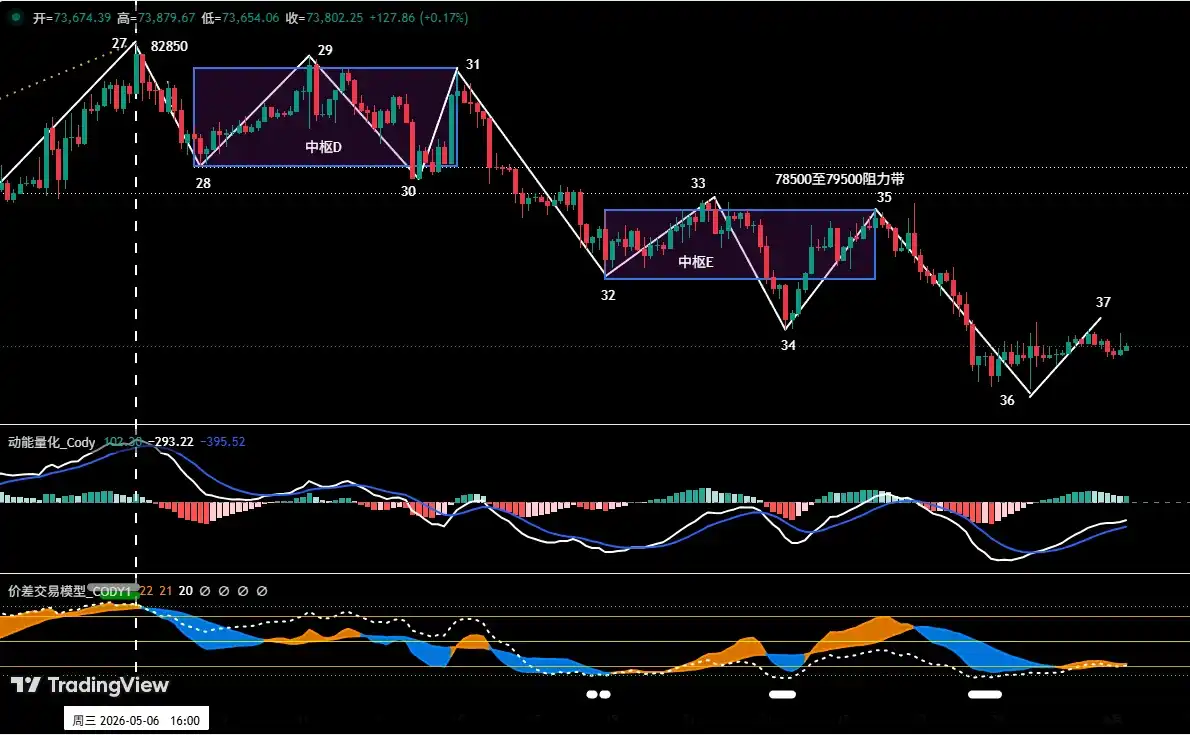
Figure 2

1、As shown in (Figure 2), from the high of $82,850 on May 6 to the present adjustment, the 4-hour chart reveals a detailed structure that can be subdivided into a 10-segment adjustment pattern from "Segment 27-28" to "Segment 36-37." This includes two descending pivot zones:

• Pivot Zone D: Formed by the overlapping of segments 28-29, 29-30, and 30-31.

• Pivot Zone E: Formed by the overlapping of segments 32-33, 33-34, and 34-35.

2、From the 4-hour structure, the current rebound is segment 36-37. If the price rebounds to the $75,000~$76,000 area and faces resistance, unable to form an effective breakout, the market is likely to continue its previous volatile downtrend and test the support level around $69,500~$70,500.

二、Bitcoin Market Outlook and Trading Strategy for This Week

1、BTC Market Outlook for This Week:

Core view for this week: Monitor the results of the test by both bulls and bears on the resistance zone of $75,000~$76,000 and the support zone of $69,500~$70,500.

2、Key Resistance Levels:

• First Resistance Zone: $75,000~$76,000 area (near the lower boundary of Pivot Zone E)

• Second Resistance Zone: $78,500~$79,500 area (near the boundaries of the two pivot zones)

3、Key Support Levels:

• First Support Level: $69,500~$70,500 area (previous important support level)

• Second Support Level: Around $65,000 (previous important support level)

4、This Week's Trading Strategy (Excluding the impact of sudden news)

1、Medium-Term Strategy:

Bitcoin _ Daily Candlestick Chart: (Position Monitoring Model)
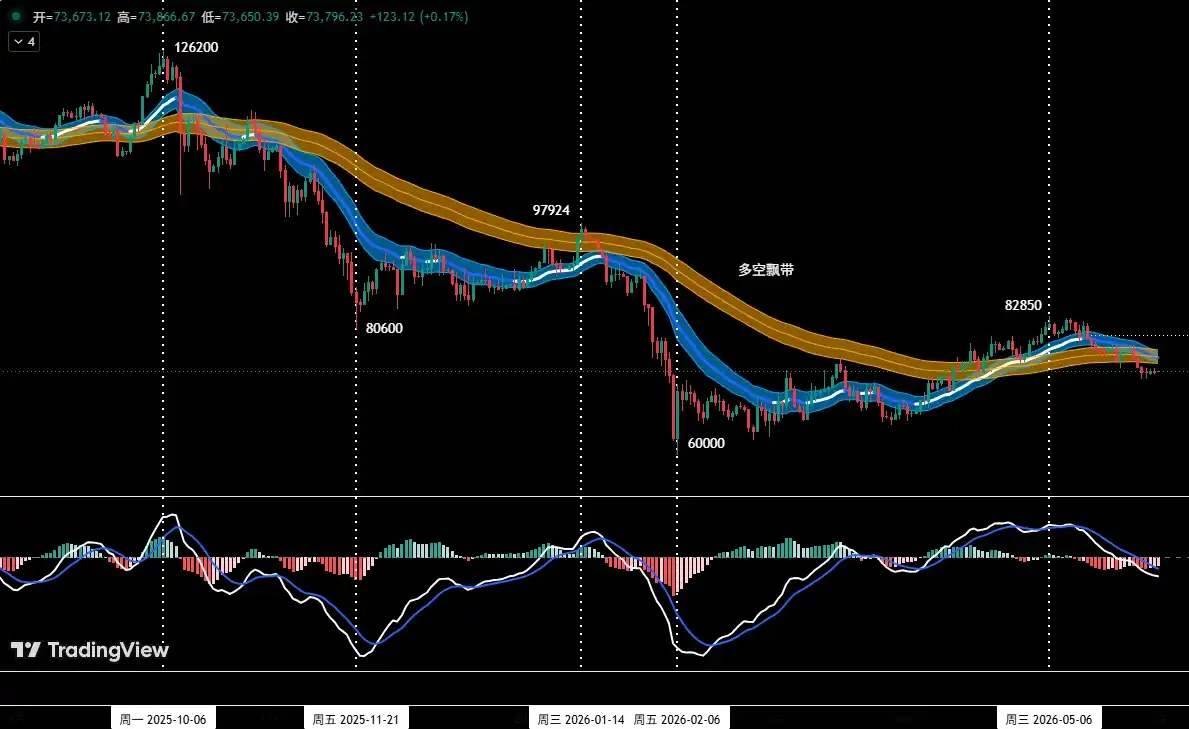
Figure 3

Position Monitoring Model: As shown in (Figure 3), the price has fallen below the "Bull-Bear Channel," entering a technically weak area. This week, monitor its retest result of the Bull-Bear Channel (around $75,000~$76,000). If the price rebounds to this level and shows signs of stagnation, resistance, or a pullback, it will signal the start of medium-term short position allocation. To control risk, the initial position can be kept below 30% of total capital; subsequently, if the price breaks below the lower boundary of the ascending channel (Yellow), increase the medium-term position to around 60%.

2、Short-Term Strategy: Utilize 30% of the position, set stop-loss points, and look for "spread" trading opportunities based on support and resistance levels. (Use the 30-minute/60-minute chart as the operation cycle).

3、To dynamically respond to the complex evolution of the market during short-term operations, we have prepared two specific operational plans in advance: A/B.

Plan A:Rebound Meets Resistance, Sell on Rallies.

• Entry: When the price rebounds and meets resistance in the $75,000~$76,000 area, combined with a top signal from the quantitative model, a short position below 30% can be established.

• Risk Control: Initial stop-loss set above $77,000.

• Exit: Gradually close the position to take profits when the price adjusts near important support levels combined with model signals.

Plan B: Effectively Breaks Support, Follow the Trend Short.

• Entry: When the price effectively breaks below the support zone of $69,500~$70,500 combined with a model top signal, a short position below 30% can be established.

• Risk Control: Initial stop-loss set above $72,000.

• Exit: Gradually close the position to take profits when the price falls to important support levels combined with model signals.

三、Analysis of HYPE's Hourly Chart Structure:

HYPE_4-Hour Candlestick Chart
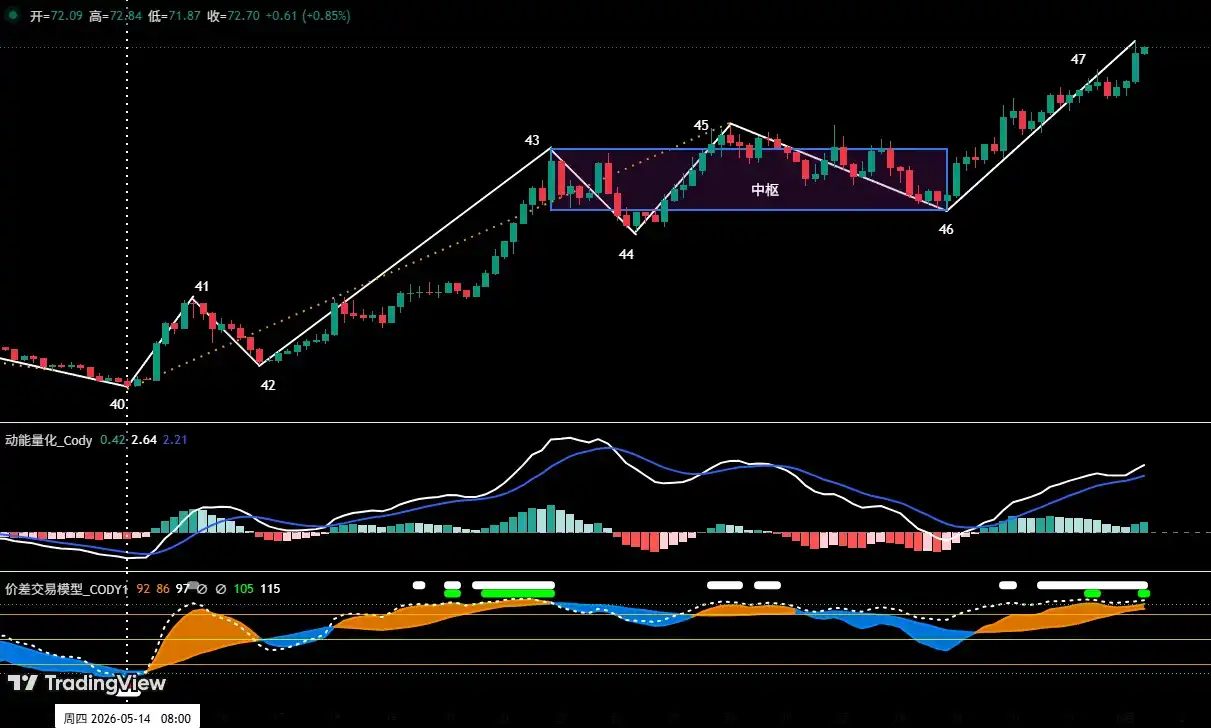
Figure 4

1、As shown in (Figure 4), on the 4-hour chart, since the low of $38.14 on May 14, HYPE has clearly constructed a seven-segment structure (segments 40-41 to 46-47) including a "rising pivot zone." Segments 43-44, 44-45, and 45-46 overlap, forming the "rising pivot zone."

2、The previous weekly review warned: Due to a momentum top divergence state at "Endpoint 45," combined with a top warning signal from the "Spread Trading Model," the two resonated. Therefore, the probability of forming a short-term high here was significant. Market movements confirmed this judgment: the price adjusted from "Endpoint 45" ($64.75) to "Endpoint 46" ($56.30), with a maximum decline of 13.05%.

3、Currently, comparing the pivot exit segment (46-47) with the entry segment (42-43), its upward momentum appears weak, forming a potential "momentum divergence."

4、Analysis from our self-built "Spread Trading Model" shows that "Endpoint 47" has triggered a strong top warning signal (red dot + white dot).

5、In summary, if the price forms a topping signal at "Endpoint 47" and the "momentum divergence" signal remains valid, the probability of this point becoming the terminal point of the rise since "Endpoint 40" will significantly increase. Subsequent price movements require close attention to the test results of the key area between $62.5 and $64.57.

四、HYPE Market Outlook and Short-Term Trading Strategy for This Week

1、HYPE Market Outlook for This Week:

Core view for HYPE this week:

• Observe whether "momentum divergence" is established when "Endpoint 47" issues a clear topping signal.

• If this phenomenon occurs, and the price subsequently effectively breaks below the support zone of $62.5 to $64.57, it can be considered that "Endpoint 47" has become the terminal point of the rally since the May 14 low.

2、HYPE Short-Term Trading Strategy for This Week: (Buy on Support)

This week's HYPE short-term trading should follow the strategy of "buying on dips, avoiding chasing rallies." The core is to observe the test results of the price pullback to the $62.5 to $64.75 area:

Strategy One:Test Long on Support Zone Stabilization

If the price pulls back to this zone, shows signs of stopping the decline and stabilizing, and combines with bottom signals triggered by the two major models, consider a light long position trial. The position must be controlled below 30%, strictly adhering to stop-loss discipline.

Strategy Two: Support Fails, Transitioning to a Larger Correction

If the price effectively breaks below this zone, the short-term correction will escalate into a larger-scale (e.g., daily level) adjustment, prolonging its duration and extending the downside target to the $54 to $56.3 area first.

五、Bitcoin Trade Review

1、Short-Term Trade Review:(See Table 1)

Strictly following the operational plan and based on trading signals issued by our self-built "Spread Trading Model" and "Momentum Quantification Model," we completed one short-term (short) trade last week, achieving a profit of 5.07%.

1、Bitcoin Short-Term Trade Details Summary:(Leverage *1)
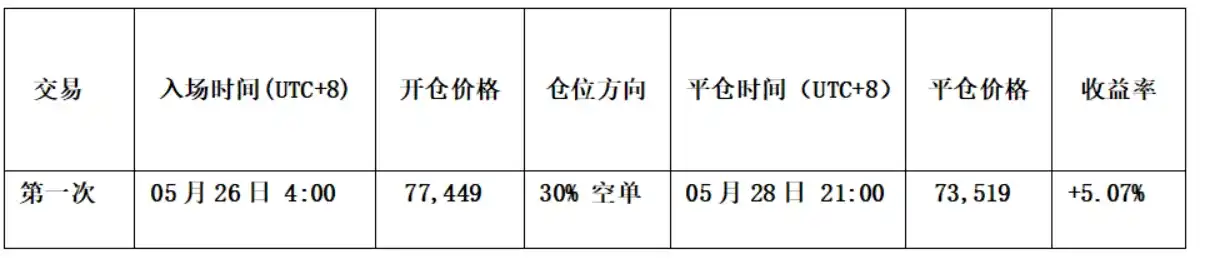
Table 1

2、Short-Term Trade Review:(See Figure 5)

• Entry Strategy:

a、When the price rebounded near $78,000, it showed resistance signals, and the candlestick formed a "top reversal" bearish pattern;

b、The "Spread Trading Model" triggered a top warning signal (white dot);

c、The "Momentum Quantification Model" issued a momentum top divergence signal.

Therefore, we established a 30% short position at $77,449.

• Exit Strategy:

a、When the price fell near $73,000, it showed signs of stopping the decline, and the candlestick formed a "bottom reversal";

b、The "Spread Trading Model" triggered a strong bottom warning signal (red dot + white dot), forming a bottom resonance signal with the "Momentum Quantification Model."

Therefore, we closed all positions near $73,519.

• Summary: This trade successfully achieved a profit of approximately 5.07%.

BTC_60-Minute Candlestick Chart: (Momentum Quantification Model + Spread Trading Model)
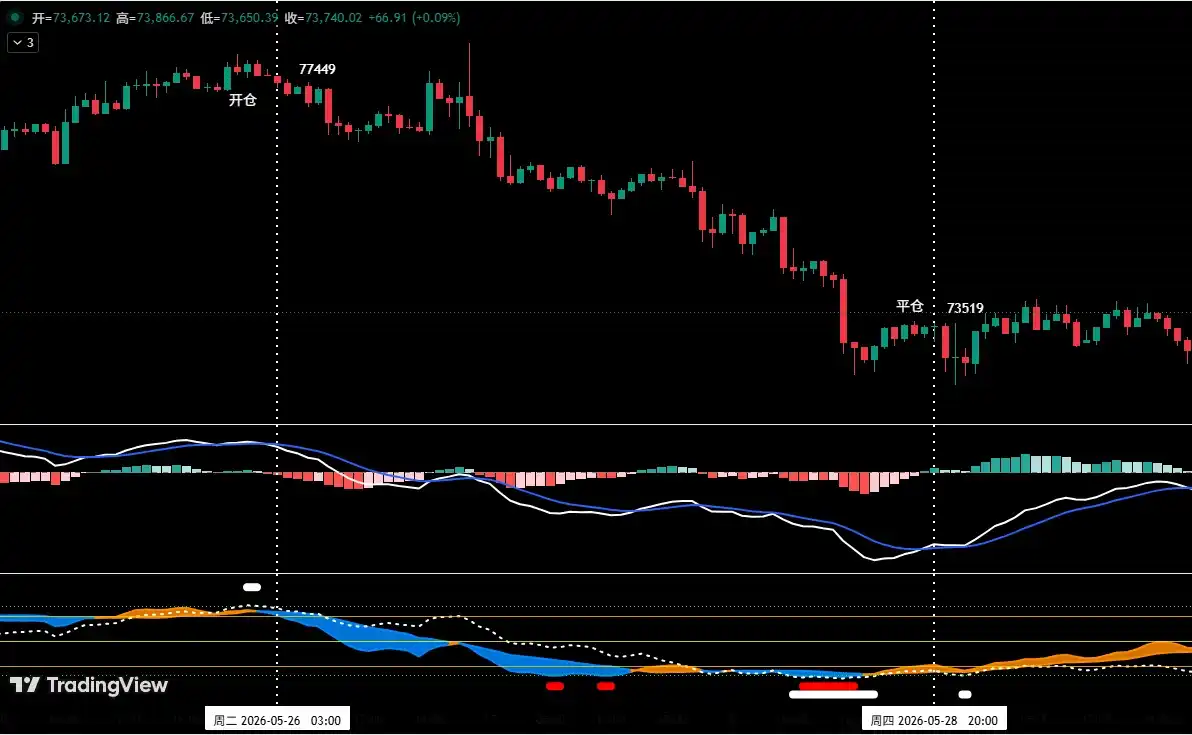
Figure 5 (Short-Term Trade Illustration)

六、Special Reminders:​​

1. Upon Entry: Immediately set the initial stop-loss.

2. When Profit Reaches 1%: Move the stop-loss to the entry price (breakeven point) to ensure capital safety.

3. When Profit Reaches 2%:​​ Move the stop-loss to the 1% profit level.

4. Continuous Tracking: Thereafter, for every additional 1% profit, move the stop-loss up by 1% accordingly to dynamically protect and lock in profits.

Financial markets are constantly changing. All market analysis and trading strategies require dynamic adjustments. All views, analytical models, and operational strategies mentioned in this article are derived from personal technical analysis, intended solely for personal trading log purposes, and do not constitute any investment advice or basis for operation. The market carries risks; investing requires caution. Please do not make decisions based on this.


Crypto di tendenza

Domande pertinenti

QWhat is the main concern for Bitcoin (BTC) according to the article's analysis?

AThe main concern is that Bitcoin's technical structure has weakened, evidenced by it falling below the median line of its long-term rising channel. The current rebound is seen as weak and likely just a correction from oversold conditions. The article expects the price to resume its downtrend after testing resistance near the $75,000-$76,000 zone, potentially seeking stronger support near the lower boundary of the long-term rising channel.

QBased on the article, what are the two primary scenarios (A and B) proposed for BTC short-term trading strategies this week?

AScenario A (反弹承压,逢高做空): Enter a short position if the price rebounds and faces resistance in the $75,000-$76,000 area, confirmed by top signals from the quantitative model. Stop loss is set above $77,000. Scenario B (有效跌破支撑,顺势做空): Enter a short position if the price effectively breaks below the $69,500-$70,500 support zone, confirmed by model signals. Stop loss is set above $72,000. Both strategies suggest using less than 30% of capital initially.

QWhat key technical phenomenon is highlighted for HYPE that suggests a potential local top?

AThe article highlights that HYPE's current uptrend, structured as a seven-segment pattern on the 4-hour chart, shows signs of a potential 'kinetic divergence' (动能背驰). This means the upward momentum in the segment leaving the central pivot (46-47) appears weaker compared to the segment entering it (42-43). This potential divergence is coupled with strong top warning signals from the author's proprietary 'Price Difference Trading Model' at the 'endpoint 47'.

QWhat is the core condition for HYPE's short-term Strategy 1 (支撑区域企稳试多)?

AStrategy 1 suggests a potential long position if the price retraces to the $62.5-$64.75 support area, shows signs of stabilization and a rebound there, and this is confirmed by bottom signals from the two proprietary trading models (likely the 'Price Difference Trading Model' and the 'Momentum Quantification Model'). The position must be kept under 30% of capital with strict stop-loss discipline.

QHow does the article describe the trade management rules, specifically regarding stop-loss movement?

AThe article outlines a dynamic stop-loss trailing process: 1. Set an initial stop-loss immediately upon opening a position. 2. When profit reaches 1%, move the stop-loss to the entry price (breakeven point). 3. When profit reaches 2%, move the stop-loss to lock in a 1% profit. 4. Thereafter, for every additional 1% of profit gained, move the stop-loss up by 1% to dynamically protect and lock in profits.

Letture associate

After Three Consecutive Quarters of Decline, Can the Crypto Market Find a Window for Stabilization in Q3?

The cryptocurrency market has just concluded its worst-performing quarter since 2022, with total capitalization dropping 12.6% to $2.1 trillion. All core metrics indicate capital is leaving the sector, not just rotating within it. Bitcoin fell 14.2% and Ethereum dropped 25.4% in Q2, breaking their previous correlation with US tech stocks. A key driver is the reversal in US spot Bitcoin ETF flows, which saw a net outflow of approximately $4.67 billion in Q2, including a record monthly outflow near $4.5 billion in June. While recent data suggests long-term holders are accumulating again, sustained ETF outflows mean continued selling pressure. Market focus is now singularly on the Federal Reserve. The upcoming July FOMC meeting is seen as the most critical event for Q3. A dovish signal could support Bitcoin reclaiming a $68,000-$84,000 range, while a hawkish stance might establish a new trading band around $50,000-$56,000. Additionally, regulatory uncertainty persists, with the progress of the crucial *CLARITY Act* stalling in the Senate, reducing its perceived 2026 passage probability to 40-45%. Despite the broad downturn, a few sectors showed growth. Prediction markets saw nominal volume surge 48.7% year-over-year to $113.8 billion, and tokenized collectibles transaction volume rose 143% quarterly to $1.4 billion. The Real-World Asset (RWA) tokenization sector also continued steady growth, now representing ~$28.1 billion in on-chain value. The market's foundation for an extreme crash appears limited, with Bitcoin price hovering near its 200-week moving average. However, the trading paradigm has shifted from narrative-driven speculation to decisions based on price action, policy developments, and interest rate expectations, making a broad sentiment-driven rally unlikely in the near term.

marsbit4 h fa

After Three Consecutive Quarters of Decline, Can the Crypto Market Find a Window for Stabilization in Q3?

marsbit4 h fa

BIT Trading Moment: BTC Still Suppressed by Weekly 200 EMA, Rejection May Restart Decline; Storage and Semiconductors that Surged Last Night Begin Falling in Evening Trading

**Crypto & Stock Market Wrap: Bitcoin Tests Resistance, Stocks Retreat After AI Surge** Bitcoin consolidates around $66,000, facing key resistance near $68,000—an area seen as a major psychological and technical hurdle where previous rallies have failed. Analysts note the cryptocurrency is caught between its 200-week moving average (~$63,333) and 200-week EMA (~$68,328). A clear break above $68k is needed to signal a stronger bullish trend, while a rejection could lead to a retest of $63k support. Market sentiment remains cautious, with low futures open interest pointing to a low-liquidity rebound rather than a full bull market. Bitcoin spot ETFs saw another $203 million inflow. US stock futures pointed lower after a strong Tuesday session led by a massive rebound in semiconductors and memory stocks. The rally was fueled by renewed optimism about AI-driven hardware demand, with Micron, SanDisk, and SK Hynix surging. However, those gains reversed in pre-market trading. Super Micro Computer (SMCI) soared over 20% after hours on strong guidance and a record backlog. Other standouts included Rocket Lab and nuclear energy plays Oklo and X-Energy. Rising oil prices (Brent above $91) and climbing Treasury yields (10-year near 4.64%), however, are reigniting inflation concerns and acting as a headwind for equities. In Asia, markets were mixed. South Korea's KOSPI pared early gains to close slightly higher as semiconductor stocks like SK Hynix gave back initial surges. Japan's Nikkei edged lower as the yen hit a fresh 38-year low against the dollar, raising fears of potential market intervention. Key events to watch include the Samsung Galaxy launch, AMD's AI event, and a slew of major tech earnings from Alphabet, Tesla, and IBM after the close on Wednesday, followed by the ECB meeting and Intel's earnings on Thursday.

marsbit4 h fa

BIT Trading Moment: BTC Still Suppressed by Weekly 200 EMA, Rejection May Restart Decline; Storage and Semiconductors that Surged Last Night Begin Falling in Evening Trading

marsbit4 h fa

Former CFTC Chairman, Circle President Tarbert: Preaching Long-Termism While Cashing Out $30 Million Himself

Former CFTC Chairman and Circle President Heath Tarbert has consistently advocated for a long-term vision in public, urging patience from investors as Circle’s stock price has fallen significantly from its peak. However, it has been revealed that since Circle’s IPO, Tarbert has continuously sold his CRCL shares through pre-arranged trading plans, cashing out approximately $30 million, without making any public market purchases. This contrast between his public messaging and personal actions has drawn criticism. Tarbert joined Circle in July 2023 as Chief Legal Officer, leveraging his regulatory experience to help guide the company through its IPO and expansion. Despite promoting stablecoins as long-term infrastructure, he established a 10b5-1 trading plan just before Circle went public, leading to substantial stock sales over the following year. In March 2026, he initiated another plan to sell more shares. His career trajectory highlights a pattern of moving between high-level regulatory roles and influential positions in the financial sector. After resigning as CFTC Chairman in early 2021, he joined Citadel Securities as Chief Legal Officer just 27 days later, during a period of intense regulatory scrutiny for the firm. He later joined Circle, aiding its efforts to navigate regulatory challenges for its public listing. While Tarbert's expertise in policy and compliance is valuable to companies like Circle, his actions—advocating long-term confidence while personally divesting—raise questions about the alignment between his public statements and his private financial decisions, leaving investors who followed his advice to bear the market risks.

marsbit4 h fa

Former CFTC Chairman, Circle President Tarbert: Preaching Long-Termism While Cashing Out $30 Million Himself

marsbit4 h fa

Gate Research Institute: The 'Wall Street-ization' Wave of Crypto Financial Products – Competition or Integration?

The article titled "Gate Research Institute: Are Crypto Financial Products Sparking a 'Wall Street' Wave—Competition or Convergence?" explores the evolving relationship between the crypto ecosystem and traditional finance (TradFi). The piece begins by reflecting on Bitcoin's original 2009 vision of decentralization, disintermediation, and moving away from banks. It then contrasts this with the 2024 landscape, where key crypto assets like Bitcoin are increasingly held through Wall Street products like ETFs issued by giants like BlackRock. The article questions whether this signifies that TradFi is systematically taking over the rights to issue, price, custody, and distribute crypto financial assets. The core argument is that this is not a zero-sum takeover but rather a bidirectional convergence where each side addresses the other's weaknesses. Crypto offers 24/7 global markets, programmable settlement, and open access but lacks compliant channels, institutional-grade custody, deep fiat liquidity, and mainstream distribution. TradFi possesses these but is constrained by legacy systems, limited operating hours, and slow settlement. Two primary convergence paths are highlighted: * **Path A (CEX to TradFi):** Exemplified by Gate, which has progressed from offering tokenized stocks and CFDs to providing direct, real stock trading (US, Hong Kong, South Korea) within its platform, using USDT. * **Path B (TradFi to Crypto):** Exemplified by Robinhood, which has integrated crypto trading, acquired exchanges like Bitstamp, and is moving traditional assets like stocks onto the blockchain via tokenization and its own Layer 2. Both paths are ultimately competing to become the next-generation, unified financial account—a "super account" where users can seamlessly trade cryptocurrencies, stocks, ETFs, RWA (Real World Assets), and tokenized treasury products in one interface. The growth of RWA and tokenized treasuries (e.g., BlackRock's BUIDL) is presented as the asset-layer fusion, providing stable, yield-bearing assets on-chain and acting as a bridge between the two worlds. In conclusion, the "Wall Street-ization" of crypto is framed as a mutual transformation. Decentralized ideals persist in the protocol layer, while at the application layer, a more efficient, global, and accessible unified capital market is emerging from this convergence. The future competition lies not between crypto exchanges and stockbrokers, but between platforms vying to offer the most comprehensive asset coverage, liquidity, and user experience within a single account.

marsbit4 h fa

Gate Research Institute: The 'Wall Street-ization' Wave of Crypto Financial Products – Competition or Integration?

marsbit4 h fa

Trading

Spot

Articoli Popolari

Cosa è $S$

Comprendere SPERO: Una Panoramica Completa Introduzione a SPERO Mentre il panorama dell'innovazione continua a evolversi, l'emergere delle tecnologie web3 e dei progetti di criptovaluta gioca un ruolo fondamentale nel plasmare il futuro digitale. Un progetto che ha attirato l'attenzione in questo campo dinamico è SPERO, denotato come SPERO,$$s$. Questo articolo mira a raccogliere e presentare informazioni dettagliate su SPERO, per aiutare gli appassionati e gli investitori a comprendere le sue basi, obiettivi e innovazioni nei domini web3 e crypto. Che cos'è SPERO,$$s$? SPERO,$$s$ è un progetto unico all'interno dello spazio crypto che cerca di sfruttare i principi della decentralizzazione e della tecnologia blockchain per creare un ecosistema che promuove l'impegno, l'utilità e l'inclusione finanziaria. Il progetto è progettato per facilitare interazioni peer-to-peer in modi nuovi, fornendo agli utenti soluzioni e servizi finanziari innovativi. Al suo interno, SPERO,$$s$ mira a responsabilizzare gli individui fornendo strumenti e piattaforme che migliorano l'esperienza dell'utente nello spazio delle criptovalute. Questo include la possibilità di metodi di transazione più flessibili, la promozione di iniziative guidate dalla comunità e la creazione di percorsi per opportunità finanziarie attraverso applicazioni decentralizzate (dApps). La visione sottostante di SPERO,$$s$ ruota attorno all'inclusività, cercando di colmare le lacune all'interno della finanza tradizionale mentre sfrutta i vantaggi della tecnologia blockchain. Chi è il Creatore di SPERO,$$s$? L'identità del creatore di SPERO,$$s$ rimane piuttosto oscura, poiché ci sono risorse pubblicamente disponibili limitate che forniscono informazioni dettagliate sul suo fondatore o fondatori. Questa mancanza di trasparenza può derivare dall'impegno del progetto per la decentralizzazione—un ethos che molti progetti web3 condividono, dando priorità ai contributi collettivi rispetto al riconoscimento individuale. Centrando le discussioni attorno alla comunità e ai suoi obiettivi collettivi, SPERO,$$s$ incarna l'essenza dell'empowerment senza mettere in evidenza individui specifici. Pertanto, comprendere l'etica e la missione di SPERO rimane più importante che identificare un creatore singolo. Chi sono gli Investitori di SPERO,$$s$? SPERO,$$s$ è supportato da una varietà di investitori che vanno dai capitalisti di rischio agli investitori angelici dedicati a promuovere l'innovazione nel settore crypto. Il focus di questi investitori generalmente si allinea con la missione di SPERO—dando priorità a progetti che promettono avanzamenti tecnologici sociali, inclusività finanziaria e governance decentralizzata. Queste fondazioni di investitori sono tipicamente interessate a progetti che non solo offrono prodotti innovativi, ma contribuiscono anche positivamente alla comunità blockchain e ai suoi ecosistemi. Il supporto di questi investitori rafforza SPERO,$$s$ come un concorrente degno di nota nel dominio in rapida evoluzione dei progetti crypto. Come Funziona SPERO,$$s$? SPERO,$$s$ impiega un framework multifunzionale che lo distingue dai progetti di criptovaluta convenzionali. Ecco alcune delle caratteristiche chiave che sottolineano la sua unicità e innovazione: Governance Decentralizzata: SPERO,$$s$ integra modelli di governance decentralizzati, responsabilizzando gli utenti a partecipare attivamente ai processi decisionali riguardanti il futuro del progetto. Questo approccio favorisce un senso di proprietà e responsabilità tra i membri della comunità. Utilità del Token: SPERO,$$s$ utilizza il proprio token di criptovaluta, progettato per servire varie funzioni all'interno dell'ecosistema. Questi token abilitano transazioni, premi e la facilitazione dei servizi offerti sulla piattaforma, migliorando l'impegno e l'utilità complessivi. Architettura Stratificata: L'architettura tecnica di SPERO,$$s$ supporta la modularità e la scalabilità, consentendo un'integrazione fluida di funzionalità e applicazioni aggiuntive man mano che il progetto evolve. Questa adattabilità è fondamentale per mantenere la rilevanza nel panorama crypto in continua evoluzione. Coinvolgimento della Comunità: Il progetto enfatizza iniziative guidate dalla comunità, impiegando meccanismi che incentivano la collaborazione e il feedback. Nutrendo una comunità forte, SPERO,$$s$ può affrontare meglio le esigenze degli utenti e adattarsi alle tendenze di mercato. Focus sull'Inclusione: Offrendo basse commissioni di transazione e interfacce user-friendly, SPERO,$$s$ mira ad attrarre una base utenti diversificata, inclusi individui che potrebbero non aver precedentemente interagito nello spazio crypto. Questo impegno per l'inclusione si allinea con la sua missione generale di empowerment attraverso l'accessibilità. Cronologia di SPERO,$$s$ Comprendere la storia di un progetto fornisce preziose intuizioni sulla sua traiettoria di sviluppo e sui traguardi. Di seguito è riportata una cronologia suggerita che mappa eventi significativi nell'evoluzione di SPERO,$$s$: Fase di Concettualizzazione e Ideazione: Le idee iniziali che formano la base di SPERO,$$s$ sono state concepite, allineandosi strettamente con i principi di decentralizzazione e focus sulla comunità all'interno dell'industria blockchain. Lancio del Whitepaper del Progetto: Dopo la fase concettuale, è stato rilasciato un whitepaper completo che dettaglia la visione, gli obiettivi e l'infrastruttura tecnologica di SPERO,$$s$ per suscitare interesse e feedback dalla comunità. Costruzione della Comunità e Prime Interazioni: Sono stati effettuati sforzi attivi di outreach per costruire una comunità di early adopters e potenziali investitori, facilitando discussioni attorno agli obiettivi del progetto e ottenendo supporto. Evento di Generazione del Token: SPERO,$$s$ ha condotto un evento di generazione del token (TGE) per distribuire i propri token nativi ai primi sostenitori e stabilire una liquidità iniziale all'interno dell'ecosistema. Lancio della Prima dApp: La prima applicazione decentralizzata (dApp) associata a SPERO,$$s$ è stata attivata, consentendo agli utenti di interagire con le funzionalità principali della piattaforma. Sviluppo Continuo e Partnership: Aggiornamenti e miglioramenti continui alle offerte del progetto, inclusi partnership strategiche con altri attori nello spazio blockchain, hanno plasmato SPERO,$$s$ in un concorrente competitivo e in evoluzione nel mercato crypto. Conclusione SPERO,$$s$ rappresenta una testimonianza del potenziale del web3 e delle criptovalute di rivoluzionare i sistemi finanziari e responsabilizzare gli individui. Con un impegno per la governance decentralizzata, il coinvolgimento della comunità e funzionalità progettate in modo innovativo, apre la strada verso un panorama finanziario più inclusivo. Come per qualsiasi investimento nello spazio crypto in rapida evoluzione, si incoraggiano potenziali investitori e utenti a ricercare approfonditamente e a impegnarsi in modo riflessivo con gli sviluppi in corso all'interno di SPERO,$$s$. Il progetto mostra lo spirito innovativo dell'industria crypto, invitando a ulteriori esplorazioni delle sue innumerevoli possibilità. Mentre il percorso di SPERO,$$s$ è ancora in fase di sviluppo, i suoi principi fondamentali potrebbero effettivamente influenzare il futuro di come interagiamo con la tecnologia, la finanza e tra di noi in ecosistemi digitali interconnessi.

130 Totale visualizzazioniPubblicato il 2024.12.17Aggiornato il 2024.12.17

Cosa è $S$

Cosa è AGENT S

Agent S: Il Futuro dell'Interazione Autonoma in Web3 Introduzione Nel panorama in continua evoluzione di Web3 e criptovalute, le innovazioni stanno costantemente ridefinendo il modo in cui gli individui interagiscono con le piattaforme digitali. Uno di questi progetti pionieristici, Agent S, promette di rivoluzionare l'interazione uomo-computer attraverso il suo framework agentico aperto. Aprendo la strada a interazioni autonome, Agent S mira a semplificare compiti complessi, offrendo applicazioni trasformative nell'intelligenza artificiale (AI). Questa esplorazione dettagliata approfondirà le complessità del progetto, le sue caratteristiche uniche e le implicazioni per il dominio delle criptovalute. Cos'è Agent S? Agent S si presenta come un innovativo framework agentico aperto, progettato specificamente per affrontare tre sfide fondamentali nell'automazione dei compiti informatici: Acquisizione di Conoscenze Specifiche del Dominio: Il framework apprende in modo intelligente da varie fonti di conoscenza esterne ed esperienze interne. Questo approccio duale gli consente di costruire un ricco repository di conoscenze specifiche del dominio, migliorando le sue prestazioni nell'esecuzione dei compiti. Pianificazione su Lungo Orizzonte di Compiti: Agent S impiega una pianificazione gerarchica potenziata dall'esperienza, un approccio strategico che facilita la suddivisione e l'esecuzione efficiente di compiti complessi. Questa caratteristica migliora significativamente la sua capacità di gestire più sottocompiti in modo efficiente ed efficace. Gestione di Interfacce Dinamiche e Non Uniformi: Il progetto introduce l'Interfaccia Agente-Computer (ACI), una soluzione innovativa che migliora l'interazione tra agenti e utenti. Utilizzando Modelli Linguistici Multimodali di Grandi Dimensioni (MLLM), Agent S può navigare e manipolare senza sforzo diverse interfacce grafiche utente. Attraverso queste caratteristiche pionieristiche, Agent S fornisce un framework robusto che affronta le complessità coinvolte nell'automazione dell'interazione umana con le macchine, preparando il terreno per innumerevoli applicazioni nell'AI e oltre. Chi è il Creatore di Agent S? Sebbene il concetto di Agent S sia fondamentalmente innovativo, informazioni specifiche sul suo creatore rimangono elusive. Il creatore è attualmente sconosciuto, il che evidenzia sia la fase embrionale del progetto sia la scelta strategica di mantenere i membri fondatori sotto anonimato. Indipendentemente dall'anonimato, l'attenzione rimane sulle capacità e sul potenziale del framework. Chi sono gli Investitori di Agent S? Poiché Agent S è relativamente nuovo nell'ecosistema crittografico, informazioni dettagliate riguardanti i suoi investitori e sostenitori finanziari non sono documentate esplicitamente. La mancanza di approfondimenti pubblicamente disponibili sulle fondazioni di investimento o sulle organizzazioni che supportano il progetto solleva interrogativi sulla sua struttura di finanziamento e sulla roadmap di sviluppo. Comprendere il supporto è cruciale per valutare la sostenibilità del progetto e il suo potenziale impatto sul mercato. Come Funziona Agent S? Al centro di Agent S si trova una tecnologia all'avanguardia che gli consente di funzionare efficacemente in contesti diversi. Il suo modello operativo è costruito attorno a diverse caratteristiche chiave: Interazione Uomo-Computer Simile a Quella Umana: Il framework offre una pianificazione AI avanzata, cercando di rendere le interazioni con i computer più intuitive. Mimando il comportamento umano nell'esecuzione dei compiti, promette di elevare le esperienze degli utenti. Memoria Narrativa: Utilizzata per sfruttare esperienze di alto livello, Agent S utilizza la memoria narrativa per tenere traccia delle storie dei compiti, migliorando così i suoi processi decisionali. Memoria Episodica: Questa caratteristica fornisce agli utenti una guida passo-passo, consentendo al framework di offrire supporto contestuale mentre i compiti si sviluppano. Supporto per OpenACI: Con la capacità di funzionare localmente, Agent S consente agli utenti di mantenere il controllo sulle proprie interazioni e flussi di lavoro, allineandosi con l'etica decentralizzata di Web3. Facile Integrazione con API Esterne: La sua versatilità e compatibilità con varie piattaforme AI garantiscono che Agent S possa adattarsi senza problemi agli ecosistemi tecnologici esistenti, rendendolo una scelta attraente per sviluppatori e organizzazioni. Queste funzionalità contribuiscono collettivamente alla posizione unica di Agent S all'interno dello spazio crittografico, poiché automatizza compiti complessi e multi-fase con un intervento umano minimo. Man mano che il progetto evolve, le sue potenziali applicazioni in Web3 potrebbero ridefinire il modo in cui si svolgono le interazioni digitali. Cronologia di Agent S Lo sviluppo e le tappe di Agent S possono essere riassunti in una cronologia che evidenzia i suoi eventi significativi: 27 Settembre 2024: Il concetto di Agent S è stato lanciato in un documento di ricerca completo intitolato “Un Framework Agentico Aperto che Usa i Computer Come un Umano”, mostrando le basi per il progetto. 10 Ottobre 2024: Il documento di ricerca è stato reso pubblicamente disponibile su arXiv, offrendo un'esplorazione approfondita del framework e della sua valutazione delle prestazioni basata sul benchmark OSWorld. 12 Ottobre 2024: È stata rilasciata una presentazione video, fornendo un'idea visiva delle capacità e delle caratteristiche di Agent S, coinvolgendo ulteriormente potenziali utenti e investitori. Questi indicatori nella cronologia non solo illustrano i progressi di Agent S, ma indicano anche il suo impegno per la trasparenza e il coinvolgimento della comunità. Punti Chiave su Agent S Man mano che il framework Agent S continua a evolversi, diversi attributi chiave si distinguono, sottolineando la sua natura innovativa e il potenziale: Framework Innovativo: Progettato per fornire un uso intuitivo dei computer simile all'interazione umana, Agent S porta un approccio nuovo all'automazione dei compiti. Interazione Autonoma: La capacità di interagire autonomamente con i computer attraverso GUI segna un passo avanti verso soluzioni informatiche più intelligenti ed efficienti. Automazione di Compiti Complessi: Con la sua metodologia robusta, può automatizzare compiti complessi e multi-fase, rendendo i processi più veloci e meno soggetti a errori. Miglioramento Continuo: I meccanismi di apprendimento consentono ad Agent S di migliorare dalle esperienze passate, migliorando continuamente le sue prestazioni e la sua efficacia. Versatilità: La sua adattabilità attraverso diversi ambienti operativi come OSWorld e WindowsAgentArena garantisce che possa servire un'ampia gamma di applicazioni. Man mano che Agent S si posiziona nel panorama di Web3 e delle criptovalute, il suo potenziale per migliorare le capacità di interazione e automatizzare i processi segna un significativo avanzamento nelle tecnologie AI. Attraverso il suo framework innovativo, Agent S esemplifica il futuro delle interazioni digitali, promettendo un'esperienza più fluida ed efficiente per gli utenti in vari settori. Conclusione Agent S rappresenta un audace passo avanti nell'unione tra AI e Web3, con la capacità di ridefinire il modo in cui interagiamo con la tecnologia. Sebbene sia ancora nelle sue fasi iniziali, le possibilità per la sua applicazione sono vaste e coinvolgenti. Attraverso il suo framework completo che affronta sfide critiche, Agent S mira a portare le interazioni autonome al centro dell'esperienza digitale. Man mano che ci addentriamo nei regni delle criptovalute e della decentralizzazione, progetti come Agent S giocheranno senza dubbio un ruolo cruciale nel plasmare il futuro della tecnologia e della collaborazione uomo-computer.

584 Totale visualizzazioniPubblicato il 2025.01.14Aggiornato il 2025.01.14

Cosa è AGENT S

Come comprare S

Benvenuto in HTX.com! Abbiamo reso l'acquisto di Sonic (S) semplice e conveniente. Segui la nostra guida passo passo per intraprendere il tuo viaggio nel mondo delle criptovalute.Step 1: Crea il tuo Account HTXUsa la tua email o numero di telefono per registrarti il tuo account gratuito su HTX. Vivi un'esperienza facile e sblocca tutte le funzionalità,Crea il mio accountStep 2: Vai in Acquista crypto e seleziona il tuo metodo di pagamentoCarta di credito/debito: utilizza la tua Visa o Mastercard per acquistare immediatamente SonicS.Bilancio: Usa i fondi dal bilancio del tuo account HTX per fare trading senza problemi.Terze parti: abbiamo aggiunto metodi di pagamento molto utilizzati come Google Pay e Apple Pay per maggiore comodità.P2P: Fai trading direttamente con altri utenti HTX.Over-the-Counter (OTC): Offriamo servizi su misura e tassi di cambio competitivi per i trader.Step 3: Conserva Sonic (S)Dopo aver acquistato Sonic (S), conserva nel tuo account HTX. In alternativa, puoi inviare tramite trasferimento blockchain o scambiare per altre criptovalute.Step 4: Scambia Sonic (S)Scambia facilmente Sonic (S) nel mercato spot di HTX. Accedi al tuo account, seleziona la tua coppia di trading, esegui le tue operazioni e monitora in tempo reale. Offriamo un'esperienza user-friendly sia per chi ha appena iniziato che per i trader più esperti.

1.2k Totale visualizzazioniPubblicato il 2025.01.15Aggiornato il 2026.06.02

Come comprare S

Discussioni

Benvenuto nella Community HTX. Qui puoi rimanere informato sugli ultimi sviluppi della piattaforma e accedere ad approfondimenti esperti sul mercato. Le opinioni degli utenti sul prezzo di S S sono presentate come di seguito.

活动图片













