Bitcoin Short-Term Bullish Structure Validated, HYPE Low-Entry Window Opens | Guest Analysis

Odaily星球日报Pubblicato 2026-06-15Pubblicato ultima volta 2026-06-15

Introduzione

**Market Analysis Summary (Week of June 2026)** **Overall Market Context:** The market environment is exceptionally complex, with the unexpected US-Iran agreement and the reopening of the Strait of Hormuz triggering a global asset repricing and significant volatility. This heightened noise underscores the importance of a structured analytical framework. **Bitcoin (BTC) Analysis & Strategy:** * **Current Status:** The price has climbed above $65,000, currently in a rebound phase (segment 38-39) following a complex 12-segment correction from the May high of $82,850. * **Key Levels:** * **Primary Resistance:** $69,500–$70,500. A successful breakout above $65,000 targets this zone. * **Primary Support:** $65,000 (immediate), followed by $59,000–$60,000 and $55,000. * **Weekly Outlook & Strategy:** The focus is on the confirmation of the $65,000 level. * **Bullish Scenario (Hold $65K):** A move toward the $69.5K–$70.5K resistance zone is anticipated, which is a potential area for initiating medium-term short positions. * **Bearish Scenario (Break below $65K):** A retest of the $60,000–$62,000 support range is likely. * **Medium-Term Strategy:** Currently neutral. Plan to establish short positions (up to 60% allocation) either in the $69.5K–$70.5K resistance zone upon signs of rejection, or on a confirmed breakdown below $65,000 and further below $59K–$60K. * **Short-Term Strategy:** Utilize 30% capital for scalping opportunities based on...

This week's market environment is exceptionally complex—the unexpected conclusion of the US-Iran agreement and the reopening of the Strait of Hormuz have triggered a massive global asset repricing. Moments of intense market sentiment volatility are precisely when structural analysis proves most valuable. The greater the noise, the more critical the framework.

This week, we focus on two main narratives: How will Bitcoin's subsequent direction be determined following its pullback after breaching $65,000? And, will HYPE's test of the $62.5~$64.57 resistance zone, after completing a four-stage correction, present new short-term opportunities?

For the complete structural analysis, market forecasts, and operational strategies, please refer to the main text.

Summary of This Week's Core Trading Views:

• BTC hourly chart structural analysis. (Details in Part 1)

• BTC weekly market forecast and mid- to short-term operational strategies. (Details in Part 2)

• HYPE hourly chart structural analysis. (Details in Part 3)

• HYPE weekly market forecast and short-term operational strategy. (Details in Part 4)

Last Week's Trading Strategy and Core View Market Validation:

• HYPE Short-Term Trade Performance: Completed one short-term long position trade (1x leverage) last week, achieving a gain of approximately 11.88%. (Details in Table 1)

• BTC Market Forecast Validation: In last week's article, we pointed out: After briefly dipping below the $60,000 threshold, the price found support and would initiate a short-term rebound to confirm the validity of the break below that key level. The current market movement validates our previous forecast.

• HYPE Market Forecast Validation: In last week's article, we pointed out: When HYPE price retested the key support zone of $55-57 showing signs of stabilizing, coupled with bottom signals triggered by our two models, a light long position could be considered. Current market movements are highly consistent with our forecast.

Part 1: In-Depth Analysis of Bitcoin's Hourly Chart Structure

Bitcoin _ 4-Hour K-Line Chart
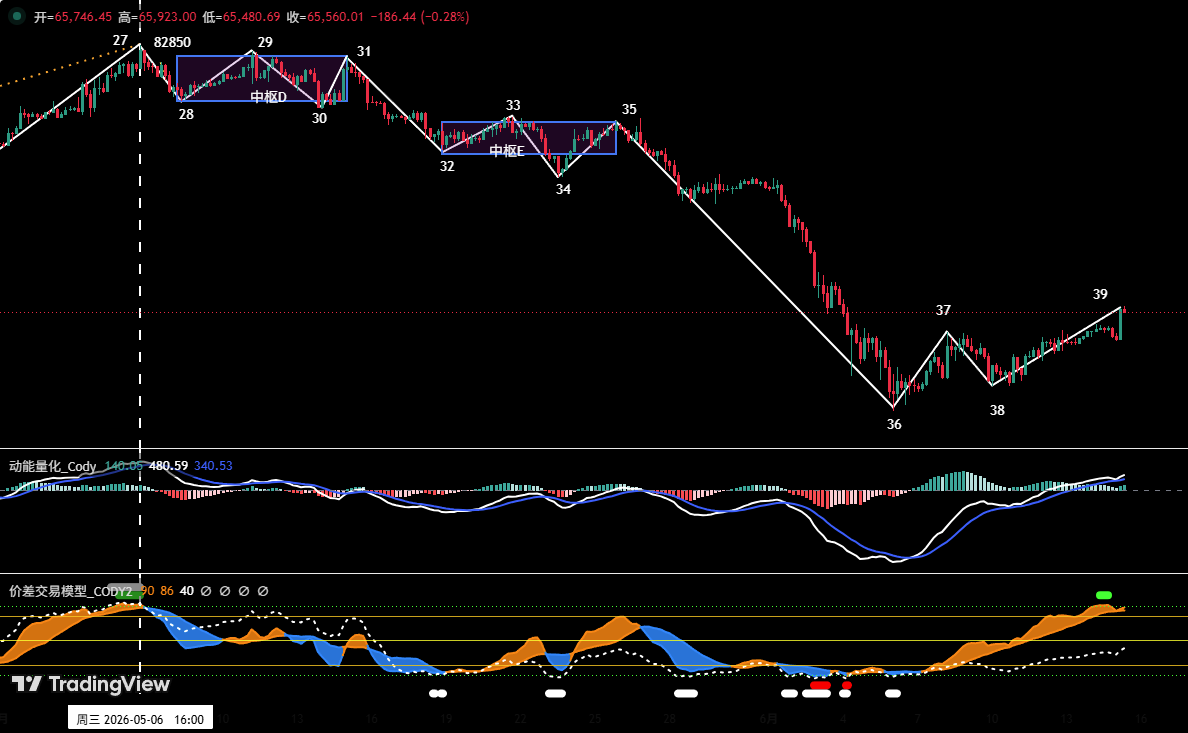
Figure 1

1. As shown in (Figure 1), since the correction began from the high of $82,850 on May 6th, a detailed 12-stage correction structure can be identified on the 4-hour chart. It includes two descending price consolidation zones: Zone D and Zone E. The overall structure is clear, presenting a typical complex correction pattern.

2. From the 4-hour structural perspective, the market is currently in the 38-39 stage rebound. The price has now surpassed $65,000. If a subsequent effective breakout is confirmed, the next significant resistance for the rebound lies in the $69,500~$70,500 region.

Part 2: Bitcoin Weekly Market Forecast and Operational Strategy

1. BTC Weekly Market Movement Forecast:

This week's core view: Focus on the result of the pullback confirmation after the price broke above $65,000.

• If the pullback fails and the level is lost, the market may test the $60,000~$62,000 core support zone again.

• If it holds firmly above, it will challenge the $69,500~$70,500 core resistance zone. This area will be a key region for us to plan mid-term short position entries.

2. Core Resistance Levels:

• First Resistance Zone: $69,500~$70,500 region (previous high-volume trading zone)

• Second Resistance Zone: $72,500~$74,500 region (previous high-volume trading zone)

3. Core Support Levels:

• First Support Level: Around $65,000

• Second Support Level: $59,000~$60,000 region (previous important support)

• Third Support Level: Around $55,000 (previous important support)

4. This Week's Operational Strategy (Excluding Impact of Unexpected News)

1. Mid-Term Strategy:

Bitcoin _ Daily K-Line Chart: (Position Monitoring Model)
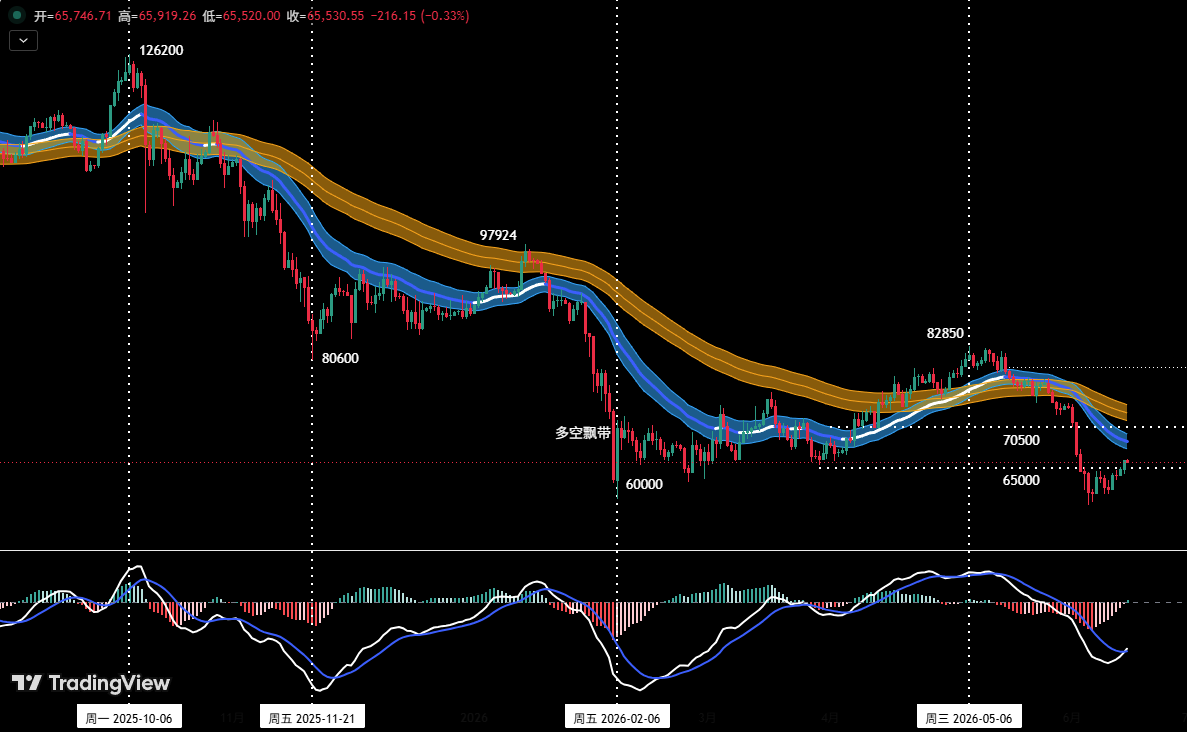
Figure 2

Position Monitoring Model: As shown in (Figure 2), the current price has effectively broken below the "Bull-Bear Channel," with the technical pattern shifting to a bear-dominated structure. Last week's market did not meet our pre-set conditions for initiating a (short) position, so the mid-term position remains empty for now.

This week, based on the outcome of the battle for $65,000 between bulls and bears, mid-term short positions can be gradually built according to the following three-tiered strategy:

Add Position at Strong Resistance: If the price successfully holds above the $65,000 region and subsequently rebounds to the $69,500~$70,500 zone showing clear resistance signs, consider establishing a mid-term (short) position, with total exposure controlled below 60%.

• Short on Support Break (Follow-through): If the price loses the $65,000 support and shows signals of a confirmed breakdown, you can initially establish a 30% mid-term short position.

Short on Further Break (Momentum): If the price loses the $65,000 support and effectively breaks below the $59,000~$60,000 support zone, you can add to the short position, with total exposure controlled below 60%.

2. Short-Term Strategy: Utilize 30% of capital, set stop-loss points, and seek "spread" opportunities based on support and resistance levels. (Use 30-minute/60-minute as the operational timeframe).

3. For short-term operations, to dynamically adapt to complex market developments, we have prepared A/B two specific operational plans in advance.

Plan A: Enter Position at Strong Resistance.

• Entry: If the price successfully holds above the $65,000 region and subsequently rebounds to around $69,500~$70,500 showing signs of stalling, combined with top signals from the quantitative model, you can initiate a short position below 30%.

• Risk Control: Set initial stop-loss.

• Exit: Gradually close the position to take profits when the price adjusts near important support levels, combined with model signals.

Plan B: Short on Effective Support Break (Follow-through).

• Entry: If the price loses the $65,000 support and shows signals of a confirmed breakdown, you can initiate a short position below 30%.

• Risk Control: Set initial stop-loss.

• Exit: Gradually close the position to take profits when the price falls to important support levels, combined with model signals.

Part 3: HYPE Hourly Chart Structural Analysis

HYPE_4-Hour K-Line Chart
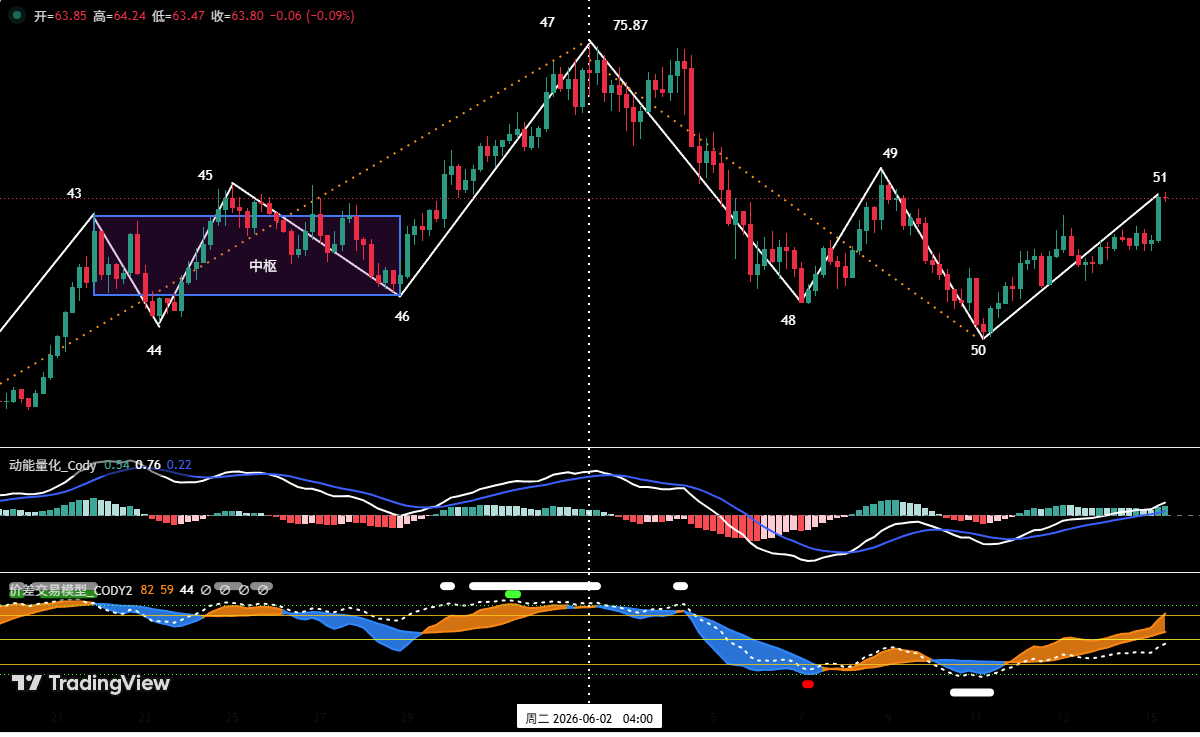
Figure 3

1. As shown in (Figure 3), on the 4-hour timeframe, HYPE's correction since the June 2nd high of $75.87 can be subdivided into a four-stage structure: (47-48), (48-49), (49-50), (50-51).

2. Currently, HYPE price has stabilized and rebounded from the support area around $52 and is in the (50-51 segment) rebound process. The overhead resistance lies in the $62.5 to $64.57 region. If (endpoint 51) forms a high point in this area (there is a high probability the overall trend will construct a "descending consolidation zone" here), the price will likely continue downward to seek stronger support.

Part 4: HYPE Weekly Market Forecast and Short-Term Operational Strategy

1. HYPE Weekly Market Movement Forecast:

1. Core Resistance Levels:

• First Resistance Level: $62.5-64.57 region;

• Second Resistance Level: $68-70 region;

2. Core Support Levels:

• First Support Level: $52-55.5 region;

• Second Support Level: $47-49 region;

This Week's Core View on HYPE:

• Observe the resistance effect in the $62.5-64.57 region and the position where "endpoint 51" forms its price high.

2. HYPE Short-Term Operational Strategy This Week: (Buy on Support)

This week's HYPE short-term trading should adhere to the strategy of "buying on dips, avoiding chasing rallies."

Short-Term Strategy: Test Long on Support Zone Stabilization

When HYPE price retests the key support zones of $52-54.5 or the deeper $47-49 and shows signs of stabilizing, combined with bottom signals triggered by our two models, consider testing a light long position. Position size must be controlled below 30%, and strict stop-loss discipline must be maintained.

Part 5: HYPE Operation Review

1. Short-Term Operation Review: (See Table 1)

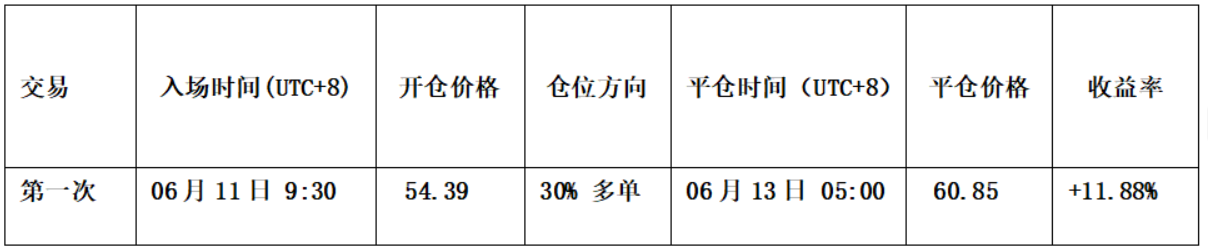
We strictly followed the operational plan and, based on trading signals from our self-built "Spread Trading Model" and "Momentum Quantitative Model," completed one short-term (long) operation last week, achieving a trading profit of 11.88%.

2. HYPE Short-Term Trade Details Summary: (Leverage*1x)
3. Short-Term Trade Review: (See Figure 4)

1. Entry Strategy:

• A relatively complete downward correction structure had been completed beforehand;

• Our self-built "Spread Trading Model" had already issued strong bottom warning signals in advance (red and white points in the chart);

• Our self-built "Momentum Quantitative Model" had issued a momentum bottom divergence signal;

Based on the above three points, we entered a 30% long position around $54.39.

2. Exit Strategy:

• When the price rose to around $62.5, it showed signs of encountering resistance;

• Our self-built "Spread Trading Model" had already issued a top warning signal in advance (white point in the chart);

• Our self-built "Momentum Quantitative Model" had issued a momentum top divergence signal;

Therefore, we closed the entire position around $60.85.

3. Summary: This trade successfully achieved a profit of approximately 11.88%.

HYPE_30-Minute K-Line Chart: (Momentum Quantitative Model + Spread Trading Model)
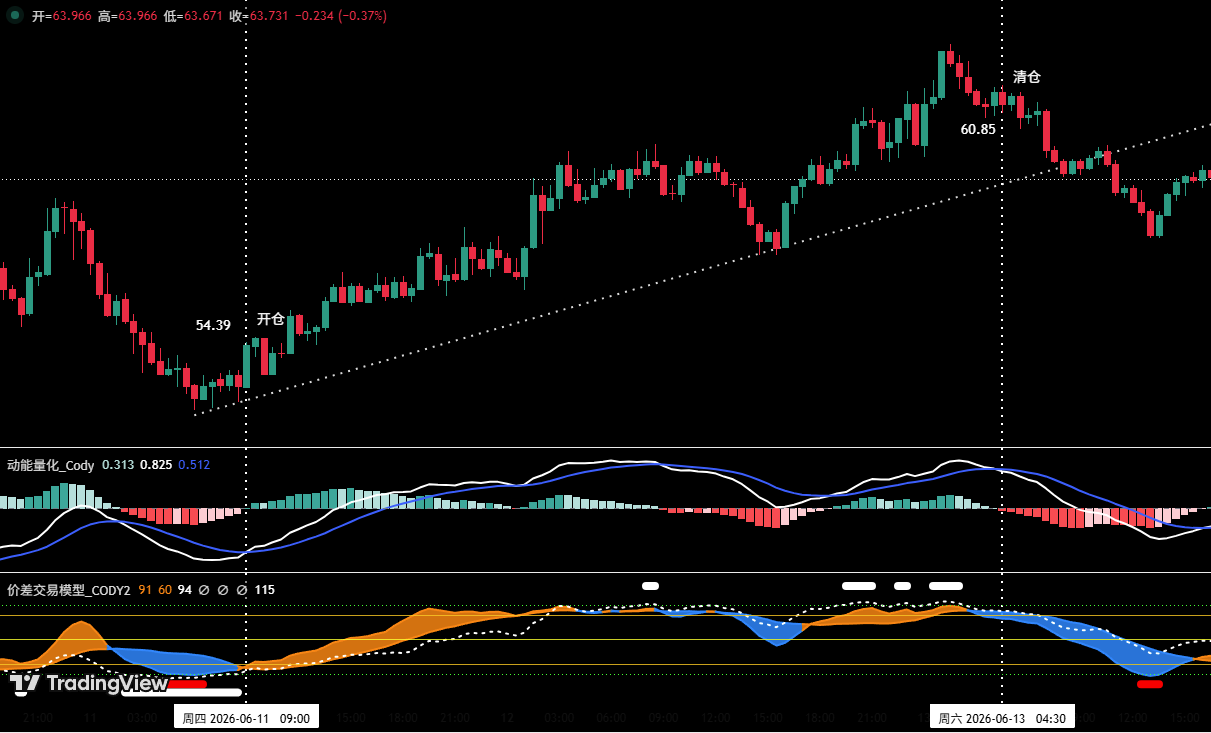
Figure 4 (Short-Term Trade Illustration)

Part 6: Special Notes:​​

1. Upon Entry: Immediately set an initial stop-loss.

2. When Profit Reaches 1%: Move the stop-loss to the entry price (break-even point) to ensure capital safety.

3. When Profit Reaches 2%​​: Move the stop-loss to the 1% profit level.

4. Continuous Tracking: Thereafter, for every additional 1% profit, move the stop-loss up by 1% accordingly, dynamically protecting and locking in gains.

Financial markets change rapidly. All market analysis and trading strategies require dynamic adjustment. All views, analytical models, and operational strategies mentioned in this article are derived from personal technical analysis, intended solely for personal trading log purposes. They do not constitute any investment advice or operational basis. Markets involve risks, investment requires caution. Please do not make decisions based on this content.


Crypto di tendenza

Domande pertinenti

QWhat are the key conditions for initiating a medium-term short position on BTC according to the article's strategy?

AThe key conditions are: 1) If the price successfully holds above the $65,000 area and subsequently rebounds to the $69,500~$70,500 resistance area showing clear signs of pressure, a medium-term short position can be considered. 2) If the price loses support at $65,000 and shows effective breakdown signals, a preliminary medium-term short position can be established. 3) If the price breaks down the $59,000~$60,000 support interval after losing $65,000, additional short positions can be added.

QWhat is the core short-term trading strategy for HYPE this week, and what are the key support levels to watch for entry?

AThe core short-term strategy for HYPE is 'buying on dips and avoiding chasing rallies.' Specifically, when the price retests the key support zones of $52-54.5 or the deeper $47-49 and shows signs of stopping declines and stabilizing, combined with bottom signals from the two proprietary models, one can consider a light long position. Positions must be controlled below 30% with strict stop-loss discipline.

QWhat was the result of the previous week's HYPE short-term trade mentioned in the article, and what models were used for the decision?

AThe previous week's HYPE short-term long position (with 1x leverage) achieved a profit of approximately 11.88%. The decision was based on signals from two proprietary models: the 'Price Difference Trading Model' which issued a strong bottom warning signal, and the 'Dynamic Quantitative Model' which issued a momentum bottom divergence signal.

QAccording to the Bitcoin 4-hour chart analysis, what is the next important resistance level if the breakout above $65,000 is confirmed effective?

AIf the breakout above $65,000 is confirmed effective, the next important resistance level is located in the $69,500~$70,500 region.

QWhat is the article's overall market outlook for Bitcoin this week, and what is the pivotal level for determining the short-term direction?

AThe article's core view for Bitcoin this week is to focus on the result of the price's pullback confirmation after breaking above $65,000. This level is pivotal. If the pullback holds, the price may challenge the $69,500~$70,500 core resistance area. If it fails and the support is lost, the market may test the core support interval of $60,000~$62,000 again.

Letture associate

After Three Consecutive Quarters of Decline, Can the Crypto Market Find a Window for Stabilization in Q3?

The cryptocurrency market has just concluded its worst-performing quarter since 2022, with total capitalization dropping 12.6% to $2.1 trillion. All core metrics indicate capital is leaving the sector, not just rotating within it. Bitcoin fell 14.2% and Ethereum dropped 25.4% in Q2, breaking their previous correlation with US tech stocks. A key driver is the reversal in US spot Bitcoin ETF flows, which saw a net outflow of approximately $4.67 billion in Q2, including a record monthly outflow near $4.5 billion in June. While recent data suggests long-term holders are accumulating again, sustained ETF outflows mean continued selling pressure. Market focus is now singularly on the Federal Reserve. The upcoming July FOMC meeting is seen as the most critical event for Q3. A dovish signal could support Bitcoin reclaiming a $68,000-$84,000 range, while a hawkish stance might establish a new trading band around $50,000-$56,000. Additionally, regulatory uncertainty persists, with the progress of the crucial *CLARITY Act* stalling in the Senate, reducing its perceived 2026 passage probability to 40-45%. Despite the broad downturn, a few sectors showed growth. Prediction markets saw nominal volume surge 48.7% year-over-year to $113.8 billion, and tokenized collectibles transaction volume rose 143% quarterly to $1.4 billion. The Real-World Asset (RWA) tokenization sector also continued steady growth, now representing ~$28.1 billion in on-chain value. The market's foundation for an extreme crash appears limited, with Bitcoin price hovering near its 200-week moving average. However, the trading paradigm has shifted from narrative-driven speculation to decisions based on price action, policy developments, and interest rate expectations, making a broad sentiment-driven rally unlikely in the near term.

marsbit46 min fa

After Three Consecutive Quarters of Decline, Can the Crypto Market Find a Window for Stabilization in Q3?

marsbit46 min fa

BIT Trading Moment: BTC Still Suppressed by Weekly 200 EMA, Rejection May Restart Decline; Storage and Semiconductors that Surged Last Night Begin Falling in Evening Trading

**Crypto & Stock Market Wrap: Bitcoin Tests Resistance, Stocks Retreat After AI Surge** Bitcoin consolidates around $66,000, facing key resistance near $68,000—an area seen as a major psychological and technical hurdle where previous rallies have failed. Analysts note the cryptocurrency is caught between its 200-week moving average (~$63,333) and 200-week EMA (~$68,328). A clear break above $68k is needed to signal a stronger bullish trend, while a rejection could lead to a retest of $63k support. Market sentiment remains cautious, with low futures open interest pointing to a low-liquidity rebound rather than a full bull market. Bitcoin spot ETFs saw another $203 million inflow. US stock futures pointed lower after a strong Tuesday session led by a massive rebound in semiconductors and memory stocks. The rally was fueled by renewed optimism about AI-driven hardware demand, with Micron, SanDisk, and SK Hynix surging. However, those gains reversed in pre-market trading. Super Micro Computer (SMCI) soared over 20% after hours on strong guidance and a record backlog. Other standouts included Rocket Lab and nuclear energy plays Oklo and X-Energy. Rising oil prices (Brent above $91) and climbing Treasury yields (10-year near 4.64%), however, are reigniting inflation concerns and acting as a headwind for equities. In Asia, markets were mixed. South Korea's KOSPI pared early gains to close slightly higher as semiconductor stocks like SK Hynix gave back initial surges. Japan's Nikkei edged lower as the yen hit a fresh 38-year low against the dollar, raising fears of potential market intervention. Key events to watch include the Samsung Galaxy launch, AMD's AI event, and a slew of major tech earnings from Alphabet, Tesla, and IBM after the close on Wednesday, followed by the ECB meeting and Intel's earnings on Thursday.

marsbit55 min fa

BIT Trading Moment: BTC Still Suppressed by Weekly 200 EMA, Rejection May Restart Decline; Storage and Semiconductors that Surged Last Night Begin Falling in Evening Trading

marsbit55 min fa

Former CFTC Chairman, Circle President Tarbert: Preaching Long-Termism While Cashing Out $30 Million Himself

Former CFTC Chairman and Circle President Heath Tarbert has consistently advocated for a long-term vision in public, urging patience from investors as Circle’s stock price has fallen significantly from its peak. However, it has been revealed that since Circle’s IPO, Tarbert has continuously sold his CRCL shares through pre-arranged trading plans, cashing out approximately $30 million, without making any public market purchases. This contrast between his public messaging and personal actions has drawn criticism. Tarbert joined Circle in July 2023 as Chief Legal Officer, leveraging his regulatory experience to help guide the company through its IPO and expansion. Despite promoting stablecoins as long-term infrastructure, he established a 10b5-1 trading plan just before Circle went public, leading to substantial stock sales over the following year. In March 2026, he initiated another plan to sell more shares. His career trajectory highlights a pattern of moving between high-level regulatory roles and influential positions in the financial sector. After resigning as CFTC Chairman in early 2021, he joined Citadel Securities as Chief Legal Officer just 27 days later, during a period of intense regulatory scrutiny for the firm. He later joined Circle, aiding its efforts to navigate regulatory challenges for its public listing. While Tarbert's expertise in policy and compliance is valuable to companies like Circle, his actions—advocating long-term confidence while personally divesting—raise questions about the alignment between his public statements and his private financial decisions, leaving investors who followed his advice to bear the market risks.

marsbit1 h fa

Former CFTC Chairman, Circle President Tarbert: Preaching Long-Termism While Cashing Out $30 Million Himself

marsbit1 h fa

Gate Research Institute: The 'Wall Street-ization' Wave of Crypto Financial Products – Competition or Integration?

The article titled "Gate Research Institute: Are Crypto Financial Products Sparking a 'Wall Street' Wave—Competition or Convergence?" explores the evolving relationship between the crypto ecosystem and traditional finance (TradFi). The piece begins by reflecting on Bitcoin's original 2009 vision of decentralization, disintermediation, and moving away from banks. It then contrasts this with the 2024 landscape, where key crypto assets like Bitcoin are increasingly held through Wall Street products like ETFs issued by giants like BlackRock. The article questions whether this signifies that TradFi is systematically taking over the rights to issue, price, custody, and distribute crypto financial assets. The core argument is that this is not a zero-sum takeover but rather a bidirectional convergence where each side addresses the other's weaknesses. Crypto offers 24/7 global markets, programmable settlement, and open access but lacks compliant channels, institutional-grade custody, deep fiat liquidity, and mainstream distribution. TradFi possesses these but is constrained by legacy systems, limited operating hours, and slow settlement. Two primary convergence paths are highlighted: * **Path A (CEX to TradFi):** Exemplified by Gate, which has progressed from offering tokenized stocks and CFDs to providing direct, real stock trading (US, Hong Kong, South Korea) within its platform, using USDT. * **Path B (TradFi to Crypto):** Exemplified by Robinhood, which has integrated crypto trading, acquired exchanges like Bitstamp, and is moving traditional assets like stocks onto the blockchain via tokenization and its own Layer 2. Both paths are ultimately competing to become the next-generation, unified financial account—a "super account" where users can seamlessly trade cryptocurrencies, stocks, ETFs, RWA (Real World Assets), and tokenized treasury products in one interface. The growth of RWA and tokenized treasuries (e.g., BlackRock's BUIDL) is presented as the asset-layer fusion, providing stable, yield-bearing assets on-chain and acting as a bridge between the two worlds. In conclusion, the "Wall Street-ization" of crypto is framed as a mutual transformation. Decentralized ideals persist in the protocol layer, while at the application layer, a more efficient, global, and accessible unified capital market is emerging from this convergence. The future competition lies not between crypto exchanges and stockbrokers, but between platforms vying to offer the most comprehensive asset coverage, liquidity, and user experience within a single account.

marsbit1 h fa

Gate Research Institute: The 'Wall Street-ization' Wave of Crypto Financial Products – Competition or Integration?

marsbit1 h fa

Trading

Spot

Articoli Popolari

Cosa è BITCOIN

Comprendere HarryPotterObamaSonic10Inu (ERC-20) e la sua posizione nel mondo delle criptovalute Negli ultimi anni, il mercato delle criptovalute ha assistito a un aumento della popolarità delle meme coin, catturando l'interesse non solo dei trader, ma anche di coloro che cercano coinvolgimento comunitario e valore di intrattenimento. Tra questi token unici c'è HarryPotterObamaSonic10Inu (ERC-20), un progetto intrigante che mescola riferimenti culturali nel tessuto delle criptovalute. Questo articolo esplora gli aspetti chiave di HarryPotterObamaSonic10Inu, analizzando i suoi meccanismi, l'etica guidata dalla comunità e il suo coinvolgimento con il panorama crittografico più ampio. Che cos'è HarryPotterObamaSonic10Inu (ERC-20)? Come suggerisce il suo nome, HarryPotterObamaSonic10Inu è una meme coin costruita sulla blockchain di Ethereum, classificata secondo lo standard ERC-20. A differenza delle criptovalute tradizionali che possono enfatizzare l'utilità pratica o il potenziale investimento, questo token prospera grazie al valore di intrattenimento e alla forza della sua comunità. Il progetto mira a creare un ambiente in cui gli utenti coinvolti possono riunirsi, condividere idee e partecipare ad attività ispirate a diversi fenomeni culturali. Una caratteristica notevole di HarryPotterObamaSonic10Inu è la zero tassa sulle transazioni. Questo elemento allettante tende a incoraggiare il trading e il coinvolgimento della comunità, privo di costi aggiuntivi che possono scoraggiare i trader di piccole dimensioni. L'offerta totale della moneta è fissata a un miliardo di token, un numero che segna la sua intenzione di mantenere una circolazione sostanziale all'interno della comunità. Creatore di HarryPotterObamaSonic10Inu (ERC-20) Le origini di HarryPotterObamaSonic10Inu sono avvolte in un certo mistero; i dettagli sul creatore rimangono sconosciuti. Lo sviluppo di questo token non presenta un team identificabile o un piano esplicito, cosa non rara nel settore delle meme coin. Invece, il progetto è emerso organicamente, con il suo progresso fortemente dipendente dall'entusiasmo e dalla partecipazione della sua comunità. Investitori di HarryPotterObamaSonic10Inu (ERC-20) Per quanto riguarda investimenti esterni e finanziamenti, HarryPotterObamaSonic10Inu rimane ambiguo. Il token non elenca alcuna fondazione di investimento conosciuta o un sostegno organizzativo significativo. Invece, la linfa vitale del progetto è la sua comunità di base, che informa la sua crescita e sostenibilità attraverso azioni collettive e coinvolgimento nello spazio crittografico. Come funziona HarryPotterObamaSonic10Inu (ERC-20)? In quanto meme coin, HarryPotterObamaSonic10Inu opera principalmente al di fuori delle strutture tradizionali che governano spesso il valore degli asset. Ci sono diversi aspetti distintivi che definiscono il funzionamento del progetto: Transazioni senza tasse: Senza costi fiscali sulle transazioni, gli utenti possono comprare e vendere liberamente il token senza preoccuparsi di costi nascosti. Coinvolgimento della comunità: Il progetto prospera sull'interazione della comunità, sfruttando le piattaforme social per creare entusiasmo e facilitare il coinvolgimento. Discussioni, condivisione di contenuti e coinvolgimento sono elementi cruciali che aiutano ad espandere la sua portata e a favorire la lealtà tra i sostenitori. Nessuna utilità pratica: Va notato che HarryPotterObamaSonic10Inu non offre un'utilità concreta all'interno dell'ecosistema finanziario. Piuttosto, è classificato come un token principalmente per attività di intrattenimento e comunitarie. Riferimento culturale: Il token incorpora astutamente elementi della cultura pop per attirare interesse, collegandosi a appassionati di meme e seguaci delle criptovalute. HarryPotterObamaSonic10Inu esemplifica come le meme coin operino in modo diverso rispetto ai progetti di criptovalute più tradizionali, entrando nel mercato come costrutti sociali innovativi piuttosto che come asset utilitari. Cronologia di HarryPotterObamaSonic10Inu (ERC-20) La storia di HarryPotterObamaSonic10Inu è segnata da diversi traguardi notevoli: Creazione: Il token è emerso da un meme virale, catturando l'immaginazione di molti appassionati di criptovalute. Le date di creazione specifiche non sono disponibili, sottolineando la sua crescita organica. Inserimento negli scambi: HarryPotterObamaSonic10Inu ha fatto il suo ingresso in vari scambi, consentendo un accesso e un trading più facili da parte della comunità. Iniziative di coinvolgimento della comunità: Attività in corso volte a migliorare l'interazione della comunità, comprese gare, campagne sui social media e generazione di contenuti da parte di fan e sostenitori. Piani di espansione futura: La tabella di marcia del progetto include il lancio di una collezione NFT, merchandising e un sito di eCommerce relativo ai suoi temi culturali, coinvolgendo ulteriormente la comunità e cercando di aggiungere più dimensioni al suo ecosistema. Punti chiave su HarryPotterObamaSonic10Inu (ERC-20) Natura guidata dalla comunità: Il progetto dà priorità al contributo collettivo e alla creatività, garantendo che il coinvolgimento degli utenti sia al centro del suo sviluppo. Classificazione come meme coin: Rappresenta l'epitome delle criptovalute basate sull'intrattenimento, distinguendosi dai veicoli d'investimento tradizionali. Nessuna affiliazione diretta con Bitcoin: Nonostante la somiglianza nel nome del ticker, HarryPotterObamaSonic10Inu è distintivo e non ha alcuna relazione con Bitcoin o altre criptovalute consolidate. Focus sulla collaborazione: HarryPotterObamaSonic10Inu è progettato per creare uno spazio per la collaborazione e la condivisione di storie tra i suoi detentori, fornendo un canale per la creatività e il legame comunitario. Prospettive future: L'ambizione di espandersi oltre il suo presupposto iniziale verso NFT e merchandising delinea un percorso per il progetto per potenzialmente entrare in strade più mainstream all'interno della cultura digitale. Poiché le meme coin continuano a catturare l'immaginazione della comunità crittografica, HarryPotterObamaSonic10Inu (ERC-20) si distingue per i suoi legami culturali e il suo approccio centrato sulla comunità. Anche se potrebbe non adattarsi al modello tipico di un token orientato all'utilità, la sua essenza risiede nella gioia e nella camaraderia coltivate tra i suoi sostenitori, evidenziando la natura in evoluzione delle criptovalute in un'epoca sempre più digitale. Con la continuazione dello sviluppo del progetto, sarà importante osservare come le dinamiche della comunità influenzano la sua traiettoria nel panorama in continuo cambiamento della tecnologia blockchain.

1.8k Totale visualizzazioniPubblicato il 2024.04.01Aggiornato il 2024.12.03

Cosa è BITCOIN

Come comprare BTC

Benvenuto in HTX.com! Abbiamo reso l'acquisto di Bitcoin (BTC) semplice e conveniente. Segui la nostra guida passo passo per intraprendere il tuo viaggio nel mondo delle criptovalute.Step 1: Crea il tuo Account HTXUsa la tua email o numero di telefono per registrarti il tuo account gratuito su HTX. Vivi un'esperienza facile e sblocca tutte le funzionalità,Crea il mio accountStep 2: Vai in Acquista crypto e seleziona il tuo metodo di pagamentoCarta di credito/debito: utilizza la tua Visa o Mastercard per acquistare immediatamente BitcoinBTC.Bilancio: Usa i fondi dal bilancio del tuo account HTX per fare trading senza problemi.Terze parti: abbiamo aggiunto metodi di pagamento molto utilizzati come Google Pay e Apple Pay per maggiore comodità.P2P: Fai trading direttamente con altri utenti HTX.Over-the-Counter (OTC): Offriamo servizi su misura e tassi di cambio competitivi per i trader.Step 3: Conserva Bitcoin (BTC)Dopo aver acquistato Bitcoin (BTC), conserva nel tuo account HTX. In alternativa, puoi inviare tramite trasferimento blockchain o scambiare per altre criptovalute.Step 4: Scambia Bitcoin (BTC)Scambia facilmente Bitcoin (BTC) nel mercato spot di HTX. Accedi al tuo account, seleziona la tua coppia di trading, esegui le tue operazioni e monitora in tempo reale. Offriamo un'esperienza user-friendly sia per chi ha appena iniziato che per i trader più esperti.

4.1k Totale visualizzazioniPubblicato il 2024.12.12Aggiornato il 2026.06.02

Come comprare BTC

Cosa è $BITCOIN

ORO DIGITALE ($BITCOIN): Un'Analisi Completa Introduzione all'ORO DIGITALE ($BITCOIN) L'ORO DIGITALE ($BITCOIN) è un progetto basato su blockchain che opera sulla rete Solana, con l'obiettivo di combinare le caratteristiche dei metalli preziosi tradizionali con l'innovazione delle tecnologie decentralizzate. Sebbene condivida un nome con Bitcoin, spesso definito “oro digitale” a causa della sua percezione come riserva di valore, l'ORO DIGITALE è un token separato progettato per creare un ecosistema unico all'interno del panorama Web3. Il suo obiettivo è posizionarsi come un asset digitale alternativo valido, anche se i dettagli riguardanti le sue applicazioni e funzionalità sono ancora in fase di sviluppo. Cos'è l'ORO DIGITALE ($BITCOIN)? L'ORO DIGITALE ($BITCOIN) è un token di criptovaluta esplicitamente progettato per l'uso sulla blockchain di Solana. A differenza di Bitcoin, che fornisce un ruolo di stoccaggio di valore ampiamente riconosciuto, questo token sembra concentrarsi su applicazioni e caratteristiche più ampie. Aspetti notevoli includono: Infrastruttura Blockchain: Il token è costruito sulla blockchain di Solana, nota per la sua capacità di gestire transazioni ad alta velocità e a basso costo. Dinamiche di Offerta: L'ORO DIGITALE ha un'offerta massima fissata a 100 quadrilioni di token (100P $BITCOIN), sebbene i dettagli riguardanti la sua offerta circolante siano attualmente non divulgati. Utilità: Sebbene le funzionalità precise non siano esplicitamente delineate, ci sono indicazioni che il token potrebbe essere utilizzato per varie applicazioni, potenzialmente coinvolgendo applicazioni decentralizzate (dApp) o strategie di tokenizzazione degli asset. Chi è il Creatore dell'ORO DIGITALE ($BITCOIN)? Attualmente, l'identità dei creatori e del team di sviluppo dietro l'ORO DIGITALE ($BITCOIN) rimane sconosciuta. Questa situazione è tipica tra molti progetti innovativi nel settore blockchain, in particolare quelli allineati con la finanza decentralizzata e i fenomeni delle meme coin. Sebbene tale anonimato possa favorire una cultura guidata dalla comunità, intensifica le preoccupazioni riguardo alla governance e alla responsabilità. Chi sono gli Investitori dell'ORO DIGITALE ($BITCOIN)? Le informazioni disponibili indicano che l'ORO DIGITALE ($BITCOIN) non ha alcun sostenitore istituzionale noto o investimenti di venture capital prominenti. Il progetto sembra operare su un modello peer-to-peer incentrato sul supporto e sull'adozione della comunità piuttosto che su percorsi di finanziamento tradizionali. La sua attività e liquidità si trovano principalmente su exchange decentralizzati (DEX), come PumpSwap, piuttosto che su piattaforme di trading centralizzate consolidate, evidenziando ulteriormente il suo approccio di base. Come Funziona l'ORO DIGITALE ($BITCOIN) Le meccaniche operative dell'ORO DIGITALE ($BITCOIN) possono essere elaborate in base al suo design blockchain e alle caratteristiche della rete: Meccanismo di Consenso: Sfruttando il proof-of-history (PoH) unico di Solana combinato con un modello di proof-of-stake (PoS), il progetto garantisce una validazione efficiente delle transazioni contribuendo all'alta performance della rete. Tokenomics: Sebbene meccanismi deflazionistici specifici non siano stati dettagliati ampiamente, l'ampia offerta massima di token implica che potrebbe soddisfare microtransazioni o casi d'uso di nicchia che devono ancora essere definiti. Interoperabilità: Esiste il potenziale per l'integrazione con l'ecosistema più ampio di Solana, inclusi vari piattaforme di finanza decentralizzata (DeFi). Tuttavia, i dettagli riguardanti integrazioni specifiche rimangono non specificati. Cronologia degli Eventi Chiave Ecco una cronologia che evidenzia traguardi significativi riguardanti l'ORO DIGITALE ($BITCOIN): 2023: Il dispiegamento iniziale del token avviene sulla blockchain di Solana, contrassegnato dal suo indirizzo di contratto. 2024: L'ORO DIGITALE guadagna visibilità poiché diventa disponibile per il trading su exchange decentralizzati come PumpSwap, consentendo agli utenti di scambiarlo contro SOL. 2025: Il progetto assiste a un'attività di trading sporadica e a un potenziale interesse per impegni guidati dalla comunità, sebbene non siano state documentate partnership significative o avanzamenti tecnici fino ad ora. Analisi Critica Punti di Forza Scalabilità: L'infrastruttura sottostante di Solana supporta alti volumi di transazioni, il che potrebbe migliorare l'utilità di $BITCOIN in vari scenari di transazione. Accessibilità: Il potenziale basso prezzo di trading per token potrebbe attrarre investitori al dettaglio, facilitando una partecipazione più ampia grazie a opportunità di proprietà frazionata. Rischi Mancanza di Trasparenza: L'assenza di sostenitori, sviluppatori o di un processo di audit pubblicamente noti potrebbe generare scetticismo riguardo alla sostenibilità e all'affidabilità del progetto. Volatilità del Mercato: L'attività di trading è fortemente dipendente dal comportamento speculativo, il che può comportare una significativa volatilità dei prezzi e incertezze per gli investitori. Conclusione L'ORO DIGITALE ($BITCOIN) emerge come un progetto intrigante ma ambiguo all'interno dell'evolvente ecosistema di Solana. Sebbene tenti di sfruttare la narrativa dell'“oro digitale”, la sua partenza dal ruolo consolidato di Bitcoin come riserva di valore sottolinea la necessità di una chiara differenziazione della sua utilità e struttura di governance. L'accettazione e l'adozione future dipenderanno probabilmente dall'affrontare l'attuale opacità e dalla definizione più esplicita delle sue strategie operative ed economiche. Nota: Questo rapporto comprende informazioni sintetizzate disponibili a ottobre 2023, e potrebbero essersi verificati sviluppi oltre il periodo di ricerca.

154 Totale visualizzazioniPubblicato il 2025.05.13Aggiornato il 2025.05.13

Cosa è $BITCOIN

Discussioni

Benvenuto nella Community HTX. Qui puoi rimanere informato sugli ultimi sviluppi della piattaforma e accedere ad approfondimenti esperti sul mercato. Le opinioni degli utenti sul prezzo di BTC BTC sono presentate come di seguito.

活动图片













