Author: CryptoSlate
Compiled by: Deep Tide TechFlow
Original link: https://cryptoslate.com/bitcoin-rocketed-15-to-get-back-above-70000-but-the-options-market-is-currently-pricing-in-a-terrifying-new-floor/
Deep Tide Insights:
After a violent 24-hour rebound from $60,000 to $70,000, Bitcoin appears to have recouped its losses. However, the fundamental logic reveals that this was not driven by firm spot buying but rather by forced position adjustments and short squeezes triggered by a recovery in the broader macro market. This article delves into the causes of this "hair-raising turmoil" in early February 2026: from liquidity contraction expectations following Trump's appointment of Kevin Warsh to the pressure on miners' profits hitting a historical low. Despite the price climbing back above $70,000, options traders are heavily betting on a potential secondary dip to $50,000-$60,000 by the end of February, revealing the still-fragile sentiment and complex financial games beneath the surface of this "violent rebound."
Bitcoin surged from $60,000 to above $70,000 in less than 24 hours, erasing the brutal 14% drop that had tested all the "buy-the-dip" theories in the market.
The speed of this reversal—a 12% single-day rally, rebounding 17% from the intraday low—was so intense that it felt like the dust settling after a liquidation. However, the mechanism behind the rebound tells another story: it was more a combination of cross-asset stabilization and forced position rebalancing, rather than conviction-driven, large-scale spot demand.
Meanwhile, the derivatives market remains crowded with bearish protective positions, pricing in that $70,000 might be just a waystation, not a true bottom.
Liquidation Wave Meets Macro Pressure
On February 5th, the market opened around $73,100, briefly attempted an upward move, then collapsed, closing at $62,600. According to CoinGlass data, the single-day decline led to the liquidation of approximately $1 billion in leveraged Bitcoin positions.
This figure alone speaks volumes about the chain reaction of forced selling, but the broader context was even worse.
CoinGlass data shows that Bitcoin futures open interest (OI) had already dropped from around $61 billion to $49 billion last week, meaning the market was already deleveraging before the final wave of冲击 hit.
The trigger was not internal to cryptocurrency. Media reports characterized the sell-off as a deterioration in risk sentiment, primarily driven by a sell-off in tech stocks and volatility shocks in precious metals—silver plummeted by up to 18% to around $72.21, dragging down all correlated risk assets.
Deribit's research confirmed this spillover effect, pointing to a shift in derivatives sentiment to extreme pessimism: negative funding rates, an inverted implied volatility term structure, and the 25-delta risk-reversal skew depressed to around -13%.
This is a classic state of "extreme fear," where positioning amplifies price swings in both directions.
Policy narratives added fuel to the fire. According to Reuters, the market reacted strongly to reports that President-elect Donald Trump might choose Kevin Warsh as Fed Chair, with traders interpreting this as a signal of future balance sheet contraction and liquidity tightening.
Simultaneously, miners faced immense profit pressure. According to TheMinerMag, the hash price fell below $32 per PH/s, and the network difficulty was expected to下调 (adjust downward) by approximately 13.37% in two days. However, this relief mechanism had not yet taken effect before price broke below support levels.
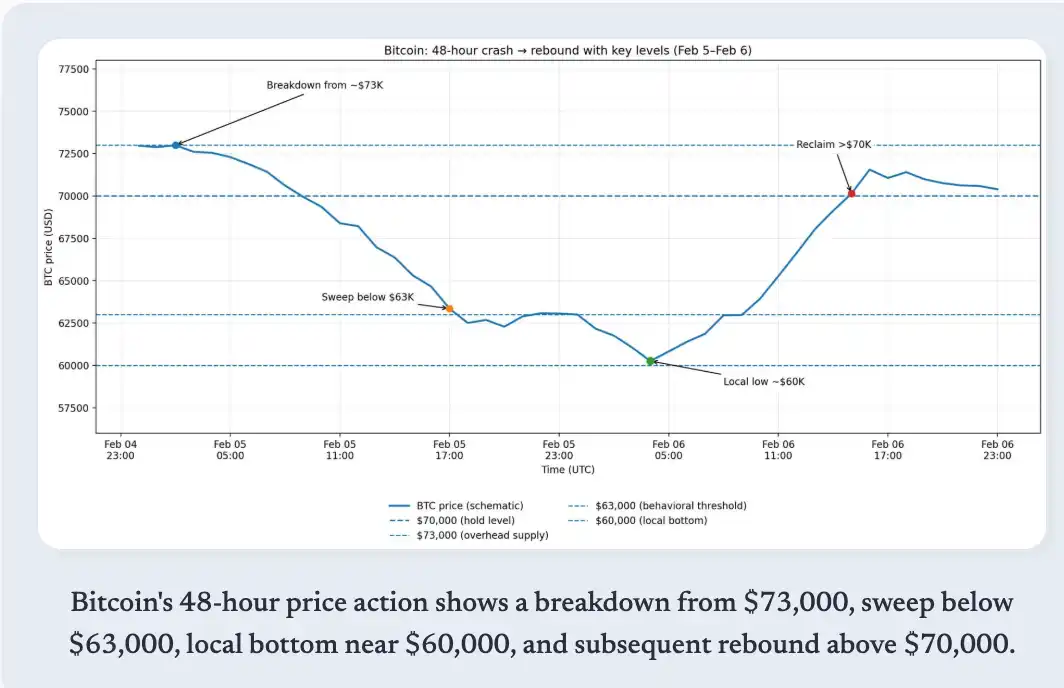
Bitcoin's price action over 48 hours, showing the crash from $73K, the sweep below $63K, local basing near $60K, and the subsequent rebound back above $70K.
Macro Reversal and Squeeze Mechanism
February 6th opened at the previous day's close, then fell to a daily low near $60,000 before rocketing to a high of $71,422. After three failed attempts to break above this level, the price fell back below $70,000.
The catalyst did not originate from within the crypto industry but was a sharp U-turn in cross-asset movements. Wall Street performed strongly: the S&P 500 rose 1.97%, the Nasdaq gained 2.18%, the Dow Jones increased 2.47%, and the Philadelphia Semiconductor Index (SOX) surged 5.7%.
Metal prices rebounded violently, with gold up 3.9% and silver up 8.6%, while the US Dollar Index fell 0.2%, signaling easier financial conditions.
Bitcoin moved mechanically with this shift. The correlation was evident: as tech stocks stabilized and metals rebounded, Bitcoin was pulled up through common risk exposures.
However, the violence of this rebound also reflected derivatives positioning. The near -13% skew, negative funding rates, and inverted volatility structure created conditions where any macro-positive catalyst could trigger short-covering and forced position adjustments.
This rally was essentially driven by a liquidity event and amplified by the unwinding of crowded short positions.
Nevertheless, forward-looking signals remain bearish. Data from Deribit shows that for options expiring on February 27th, put open interest is heavily concentrated at strike prices between $60,000 and $50,000.
Sean Dawson from Deribit told Reuters that the demand for downside protection is "extreme." This is not hindsight analysis; traders are explicitly hedging against the next leg down, even after the rebound.
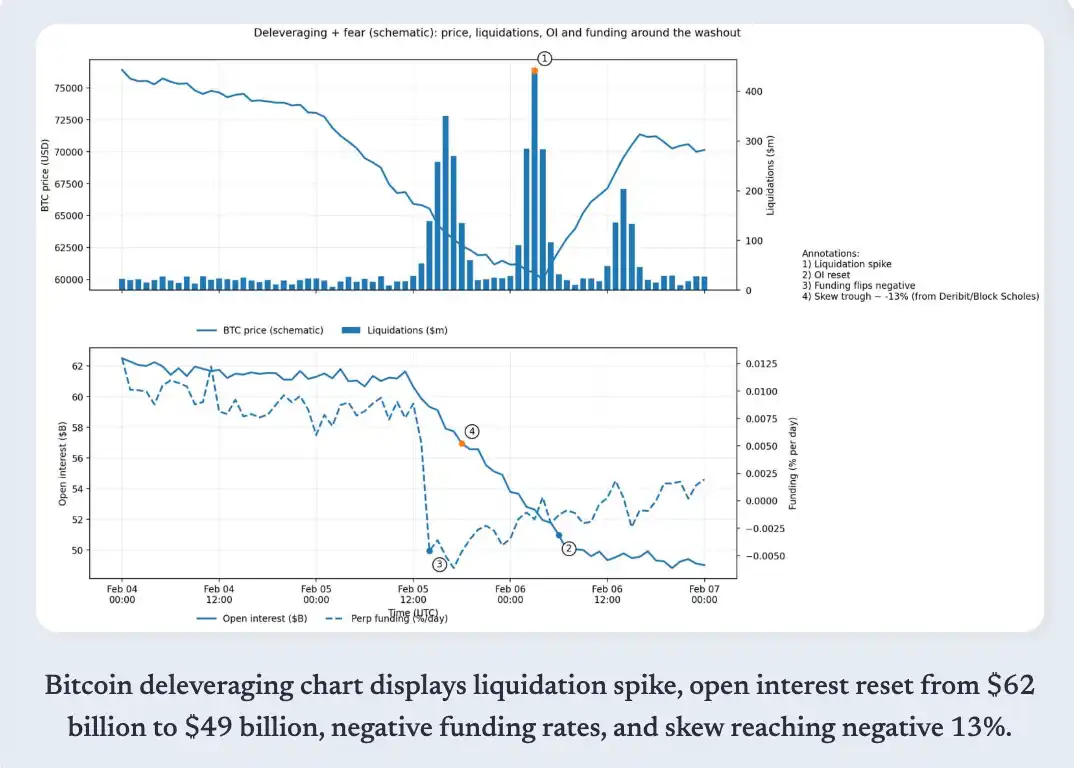
Bitcoin deleveraging chart showing liquidation spikes, OI reset from $62B to $49B, negative funding, and skew hitting -13%.
Can $70K Hold? Analytical Framework
The logic for holding $70,000 is based on three conditions.
First, the macro rebound needs to persist, with tech stocks continuing to stabilize, and US Treasury yields and the dollar not tightening again. This rally was clearly a cross-asset correlation; if US stocks turn lower again, Bitcoin will not be immune.
Second, leverage needs to continue cooling off with no new forced selling emerging. Open interest has already declined significantly, reducing the risk of a "vacuum drop."
Third, miner pressure needs substantive relief when the difficulty adjustment takes effect. If prices can hold steady within the adjustment window, the anticipated 13.37% difficulty下调 should reduce marginal selling pressure and allow the hash rate to stabilize.
Arguments supporting another washout also have three reasons:
First, options positioning remains skewed bearish. The largest put concentrations for late February are at $60K-$50K, a forward-looking signal embedded in market-implied probabilities, not lagging sentiment.
Second, derivatives signals remain fragile. Extreme skew, the recent prevalence of negative funding rates, and an inverted volatility structure align more with the characteristics of a "relief rally" within a fear regime, not a trend reversal.
Third, ETF flow data shows continued outflows. As of February 5th, Bitcoin ETF net monthly outflows had reached $690 million. Although data for February 6th is not yet available, the existing pattern suggests institutional allocators have not shifted from "de-risking" to "re-engagement."
Signal Dashboard
| Indicator | Latest Reading / Status (As of Publishing) | Bull Confirmation (What Needs to Change) | Bear Continuation (What to Watch For) | Source |
| Derivatives | Perp Funding Rate | Negative (below 0%) -- "Extremely Bearish" state | Funding turns positive & stabilizes on major platforms (not just 1-2 hour spikes) | Funding stays negative / oscillates wildly during price chops → "Bull Trap" risk |
| Options Risk | 25D Risk Reversal (Skew) | Short-term skew as low as ~-13% (Surge in put demand) | Skew recovers towards 0 (Less downside protection demand) & stabilizes | Skew remains deeply negative (Sustained protective buying) |
| Leverage | Futures OI | Deleveraging / OI drop (Forced liquidation phase); Recent reports show ~$55B equiv exited in 30d | OI flattens out (No rapid re-levering) & price holds $70K | OI accumulates quickly during bounce → Probability of next liquidation leg increases |
| Fund Flows | Spot BTC ETF Net Flow | Net Outflows: Feb 4 -$544.9M, Feb 5 -$434.1M | Outflows decelerate to flat, then turn to slight inflows | Outflows accelerate (Consecutive -$400M to -$500M days)→ Repeat washout risk |
| Mining | Hash Price + Difficulty Adj | Hash Price < $32/PH/s (Historic lows); Difficulty下调 ~13.37% expected | Difficulty下调 arrives & hashrate stabilizes (Reduces miner sell pressure) | Hash price falls further / Hashrate drops significantly → Increased miner selling/inventory outflow |
The True Meaning of $70K
This price level itself holds no magic. Its importance lies in its position just above the $66,900 to $70,600 on-chain absorption cluster identified by Glassnode.
Holding $70,000 means this cluster has absorbed enough supply to temporarily stabilize prices. However, holding firm depends not just on technical support but also on the return of spot demand, the unwinding of derivatives hedge positions, and the stabilization of institutional flows.
The rebound from $60,000 was real, but its composition is crucial. If macro conditions change, cross-asset stability will reverse.
The unwinding of forced positions created a mechanical rebound, which does not necessarily translate into a sustained trend. Options traders are still pricing in a significant probability of a move down towards $50,000-$60,000 within the next three weeks.
Bitcoin reclaimed $70,000 but is currently consolidating below it. This suggests a pause before the next test, and the outcome of that next test depends on three conditions occurring in sequence: sustained macro risk appetite, deceleration or reversal of ETF outflows, and normalization of derivatives sentiment.
The market delivered a violent snap-back, but the forward curve and flow data indicate traders are not yet betting on its persistence. $70,000 is not the endgame; it is merely the baseline that will determine the winner of the next phase of the debate.