Bitcoin ETFs Near YTD Flow Recovery Despite 40% Price Drop

bitcoinistPubblicato 2026-03-25Pubblicato ultima volta 2026-03-25

Introduzione

US spot Bitcoin ETFs are nearing a complete recovery of their year-to-date outflows, despite Bitcoin's price declining by approximately 40% over the past six months. According to analyst Eric Balchunas, these ETFs have seen a significant influx of $2.59 billion in the past month alone, reducing the net YTD deficit to around -$140 million. BlackRock’s IBIT has been a major driver, attracting $2.23 billion in the last month and ranking in the top 2% of all ETFs by flows. While funds like Fidelity’s FBTC and Grayscale’s GBTC remain negative YTD, the broader market shows resilience with several mid-tier and smaller ETFs contributing positively. Balchunas highlighted this as unusual compared to historical asset class behavior, noting that Bitcoin ETF investors have displayed higher tolerance for drawdowns than those in gold during a similar stress period. At the time of reporting, Bitcoin traded at $71,322.

US spot Bitcoin ETFs are on the verge of fully reversing their year-to-date outflows, even after Bitcoin endured a roughly 40% drawdown over the past six months, a resilience that is beginning to stand out against historical precedent in other asset classes.

Data shared by Bloomberg ETF analyst Eric Balchunas shows aggregate Bitcoin ETF flows turning sharply positive in recent weeks. While the group still sits at approximately -$140 million year-to-date, the pace of recent inflows suggests that deficit is close to being erased. Over the past month alone, Bitcoin ETFs have attracted roughly $2.59 billion, underscoring a notable shift in investor behavior.

BlackRock’s IBIT Leads Bitcoin ETF Rebound

At the center of the rebound is BlackRock’s IBIT, which has pulled in $1.32 billion in net inflows year-to-date, placing it in the top 2% of all ETFs by flows. Over the past month, IBIT alone has attracted $2.23 billion, with an additional $212 million over the last week, signaling persistent demand despite broader market volatility.

Other funds are contributing to the recovery, albeit at a smaller scale. Fidelity’s FBTC and ARK’s ARKB remain under pressure on a year-to-date basis, posting -$1.13 billion and -$193 million respectively. Grayscale’s GBTC is also in the red with outflows at -$730 million.

US Bitcoin ETF data | Source: X @EricBalchunas

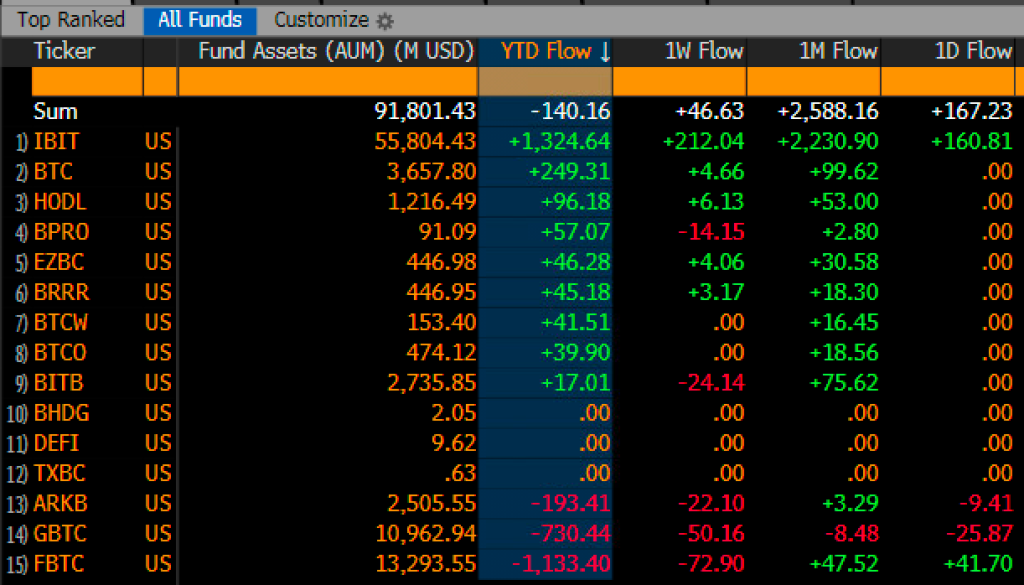
Still, the broader picture has improved materially. Several mid-tier products, including BITB, BTC, and HODL, are showing positive inflows year-to-date, while smaller funds like EZBC and BRRR have quietly added tens of millions in net demand. The aggregate effect is a market that has absorbed significant selling pressure earlier in the year and is now approaching equilibrium.

Balchunas framed the development as unusual in historical context, particularly given the magnitude of Bitcoin’s recent correction. “Yeah bitcoin ETFs now $2.5b for month and one good day away from completely digging out of their YTD flow hole,” he wrote, adding that IBIT has already crossed that threshold. “Again, incredible fortitude in face of 40% 6mo price drop and widespread media pile on.”

He contrasted this behavior with gold during a comparable period of stress. “For context, when gold fell 40% in short time frame about 10yrs ago, it saw 1/3 of its investors bail (not that that’s bad either, that’s normal, btc is just abnormal).” The implication is not that Bitcoin is inherently more stable, but that its investor base—at least in ETF form—has demonstrated a higher tolerance for drawdowns.

That observation aligns with Balchunas’ broader view on how both assets function within portfolios. In a separate note, he emphasized that neither Bitcoin nor gold should be evaluated through short-term performance alone, particularly given their inconsistent correlation properties. “Bitcoin is similar but with more correlation (0.45) with stocks. Both unpredictable but valid asset classes and shouldn’t be judged based on short time frames.”

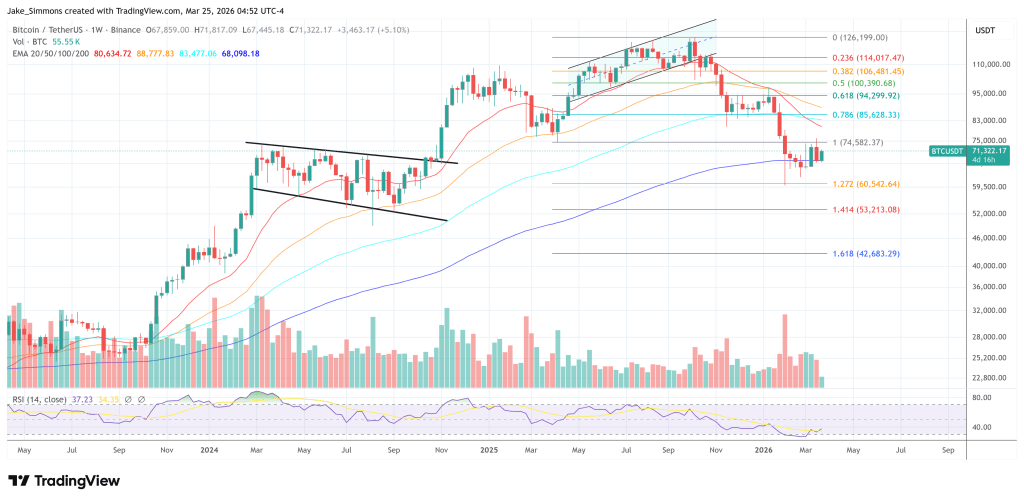
At press time BTC traded at $71,322.

BTC must break above $74,500 1-week chart | Source: BTCUSDT on TradingView.com

Domande pertinenti

QDespite a 40% price drop in Bitcoin, what is the current state of US spot Bitcoin ETF year-to-date (YTD) flows?

AUS spot Bitcoin ETFs are on the verge of fully reversing their year-to-date outflows, with the aggregate flow deficit at approximately -$140 million, which is close to being erased due to strong recent inflows.

QWhich specific Bitcoin ETF has led the rebound in inflows and how much has it attracted in the past month?

ABlackRock's IBIT has led the rebound, attracting $2.23 billion in net inflows over the past month alone and $1.32 billion year-to-date, placing it in the top 2% of all ETFs by flows.

QHow does the resilience of Bitcoin ETF investors during this price drop compare to gold investors in a similar historical situation?

ABloomberg analyst Eric Balchunas contrasted the behavior, noting that when gold fell 40% about 10 years ago, it saw one-third of its investors bail. In contrast, Bitcoin ETF investors have shown 'incredible fortitude' and a higher tolerance for drawdowns, with flows turning positive.

QWhat are the year-to-date flow figures for Fidelity's FBTC and Grayscale's GBTC ETFs?

AFidelity's FBTC has year-to-date outflows of -$1.13 billion, and Grayscale's GBTC has outflows of -$730 million.

QWhat key price level does the chart suggest Bitcoin must break above, according to the article?

AThe chart suggests that Bitcoin must break above $74,500 on the 1-week chart.

Letture associate

The Value Distribution of Stablecoins

**Summary: The Value Distribution of Stablecoins** The article argues that stablecoins are evolving from mere trading tools into broader channels for dollar access. It divides the stablecoin ecosystem into four layers to analyze how value is distributed: 1. **Issuance Layer:** Mints stablecoins, holds reserve assets, and captures the spread between reserve yield and user costs (e.g., Tether, Circle). This layer currently earns the largest profit margin. 2. **Infrastructure Layer:** Connects stablecoins to the traditional financial system, handling fiat on/off-ramps, banking integration, compliance (KYC/AML), and asset management (e.g., Bridge, BVNK). This is the "unglamorous" but critical work, building the essential bridges between crypto and real-world finance. 3. **Acquiring/Distribution Layer:** Integrates stablecoins into merchant systems, manages payment flows, and provides enterprise financial software (e.g., Stripe, Coinbase). They act as the access point for businesses. 4. **Application Layer:** The end-users and businesses that ultimately use stablecoins for payments, settlements, or as a store of value. They benefit from convenience but have little pricing power. The core thesis is that while the issuance layer currently dominates profits, the often-overlooked **infrastructure layer holds significant long-term potential**. The real challenge and barrier to mass adoption is not the on-chain transfer of stablecoins (which is simple), but the complex "last mile" integration into existing business workflows, banking systems, and regulatory frameworks across different countries. Companies in this layer are currently in a "land grab" phase, investing heavily to build networks, secure bank partnerships, and establish compliance pathways. While their position is currently pressured by the profitable issuers above and distribution platforms below, the article suggests that if stablecoins become a default financial rail for businesses, the infrastructure providers who have done the hard work of integration will ultimately gain strong pricing power and become entrenched, essential players.

marsbit6 h fa

The Value Distribution of Stablecoins

marsbit6 h fa

The Value Distribution of Stablecoins

The Value Distribution of Stablecoins The article argues that stablecoins are evolving from a mere trading tool into a broad "dollar channel." It analyzes the industry's value chain through four layers: 1. **Issuance Layer (e.g., Tether, Circle):** The top layer that mints stablecoins, holds reserve assets, and captures the thickest interest rate spread. 2. **Infrastructure Layer (e.g., Bridge, BVNK):** Connects stablecoins to the traditional financial system, handling critical but complex "dirty work" like fiat on/off-ramps, banking integration, compliance (KYC/AML), and cross-border settlement. 3. **Acquiring/Distribution Layer (e.g., Stripe, Coinbase):** Embeds stablecoins into merchant systems, manages payment flows, and integrates with enterprise software. 4. **Application Layer:** End-users and businesses that ultimately use stablecoins for payments, settlement, or storing value. The author posits that while the issuance layer currently captures the most profit, the most overlooked and potentially critical layer is infrastructure. The core challenge for stablecoin adoption isn't the on-chain transfer (which is simple), but bridging the gap between blockchain and the real-world financial system. This involves solving practical problems for businesses: fiat conversion, reconciliation, tax handling, and user onboarding. Infrastructure companies are currently in a difficult "land-grab" phase—building networks, securing banking relationships, and achieving compliance country-by-country. They face pressure from both the profitable issuance layer above and distribution platforms below. However, the author suggests this layer is building a crucial moat. Once stablecoins become a default business rail, the infrastructure players who have done the hard work of integration may gain significant, durable value and pricing power.

链捕手6 h fa

The Value Distribution of Stablecoins

链捕手6 h fa

Trading

Spot
Futures

Articoli Popolari

Come comprare FLOW

Benvenuto in HTX.com! Abbiamo reso l'acquisto di Flow (FLOW) semplice e conveniente. Segui la nostra guida passo passo per intraprendere il tuo viaggio nel mondo delle criptovalute.Step 1: Crea il tuo Account HTXUsa la tua email o numero di telefono per registrarti il tuo account gratuito su HTX. Vivi un'esperienza facile e sblocca tutte le funzionalità,Crea il mio accountStep 2: Vai in Acquista crypto e seleziona il tuo metodo di pagamentoCarta di credito/debito: utilizza la tua Visa o Mastercard per acquistare immediatamente FlowFLOW.Bilancio: Usa i fondi dal bilancio del tuo account HTX per fare trading senza problemi.Terze parti: abbiamo aggiunto metodi di pagamento molto utilizzati come Google Pay e Apple Pay per maggiore comodità.P2P: Fai trading direttamente con altri utenti HTX.Over-the-Counter (OTC): Offriamo servizi su misura e tassi di cambio competitivi per i trader.Step 3: Conserva Flow (FLOW)Dopo aver acquistato Flow (FLOW), conserva nel tuo account HTX. In alternativa, puoi inviare tramite trasferimento blockchain o scambiare per altre criptovalute.Step 4: Scambia Flow (FLOW)Scambia facilmente Flow (FLOW) nel mercato spot di HTX. Accedi al tuo account, seleziona la tua coppia di trading, esegui le tue operazioni e monitora in tempo reale. Offriamo un'esperienza user-friendly sia per chi ha appena iniziato che per i trader più esperti.

185 Totale visualizzazioniPubblicato il 2024.12.10Aggiornato il 2026.06.02

Come comprare FLOW

Discussioni

Benvenuto nella Community HTX. Qui puoi rimanere informato sugli ultimi sviluppi della piattaforma e accedere ad approfondimenti esperti sul mercato. Le opinioni degli utenti sul prezzo di FLOW FLOW sono presentate come di seguito.

活动图片