Bitcoin Could Reach a Turning Point This Week as a Solid Bottom Forms

cryptonews.ruPubblicato 2026-08-23Pubblicato ultima volta 2026-08-23

Introduzione

Bitcoin may be approaching a pivotal moment this week as a sustainable bottom forms, according to Grayscale. The asset manager noted that Bitcoin's rapid recovery from its latest bear market low, including a rally to around $79,500, could signal a turning point. Their analysis compared the current cycle's decline—roughly 50% from its peak—to historical drops of 70-80%, suggesting a potentially shallower correction. Grayscale's chart tracking Bitcoin's performance across cycles shows the current pullback is less severe than previous ones. This aligns with a VanEck report indicating that multiple "capitulation" signals were active, often associated with late-stage corrections and a transition into accumulation. Factors such as institutional ETF adoption, a broader holder base, and the absence of major leveraged lender blowups may be contributing to a more resilient market structure. Supporting the recovery, U.S. spot Bitcoin ETFs have seen significant net inflows, totaling approximately $1.92 billion over five consecutive sessions. While this indicates underlying demand beyond short-covering, risks remain from macroeconomic factors like rising interest rates or profit-taking. Grayscale concluded that while a Q4 2026 downturn is still possible, this week's rally suggests a more durable bottom may be forming.

A swift Bitcoin recovery could signal that its latest bear market has reached a turning point, crypto asset manager Grayscale noted in an Aug. 22 post on X. The post included a chart comparing Bitcoin’s current decline with four prior market cycles.

That assessment followed a weekly Bitcoin rally of roughly $10,000, which on Aug. 21 pushed the cryptocurrency to $79,500 — its highest price since May. The recovery broke a prolonged trading range and forced traders holding bearish derivative positions to close their bets.

While short position liquidations contributed to accelerating the rise, this movement also coincided with renewed spot demand and inflows into ETFs. Grayscale stated:

“This week could be a turning point for Bitcoin.”

The firm elaborated on market outlooks after publishing an assessment of whether current prices present a good time to buy Bitcoin. That analysis highlighted continued structural adoption, bear market maturity, and a potentially favorable macroeconomic backdrop as three factors for long-term investors to consider.

Grayscale Chart Shows a Shallower Bitcoin Decline

On the accompanying “Bitcoin Price by Cycle” chart, the Bitcoin index is set to 100 at each cycle peak, and its subsequent behavior is tracked by the number of days since that peak. The current cycle starts from the October 2025 high and runs through Aug. 20.
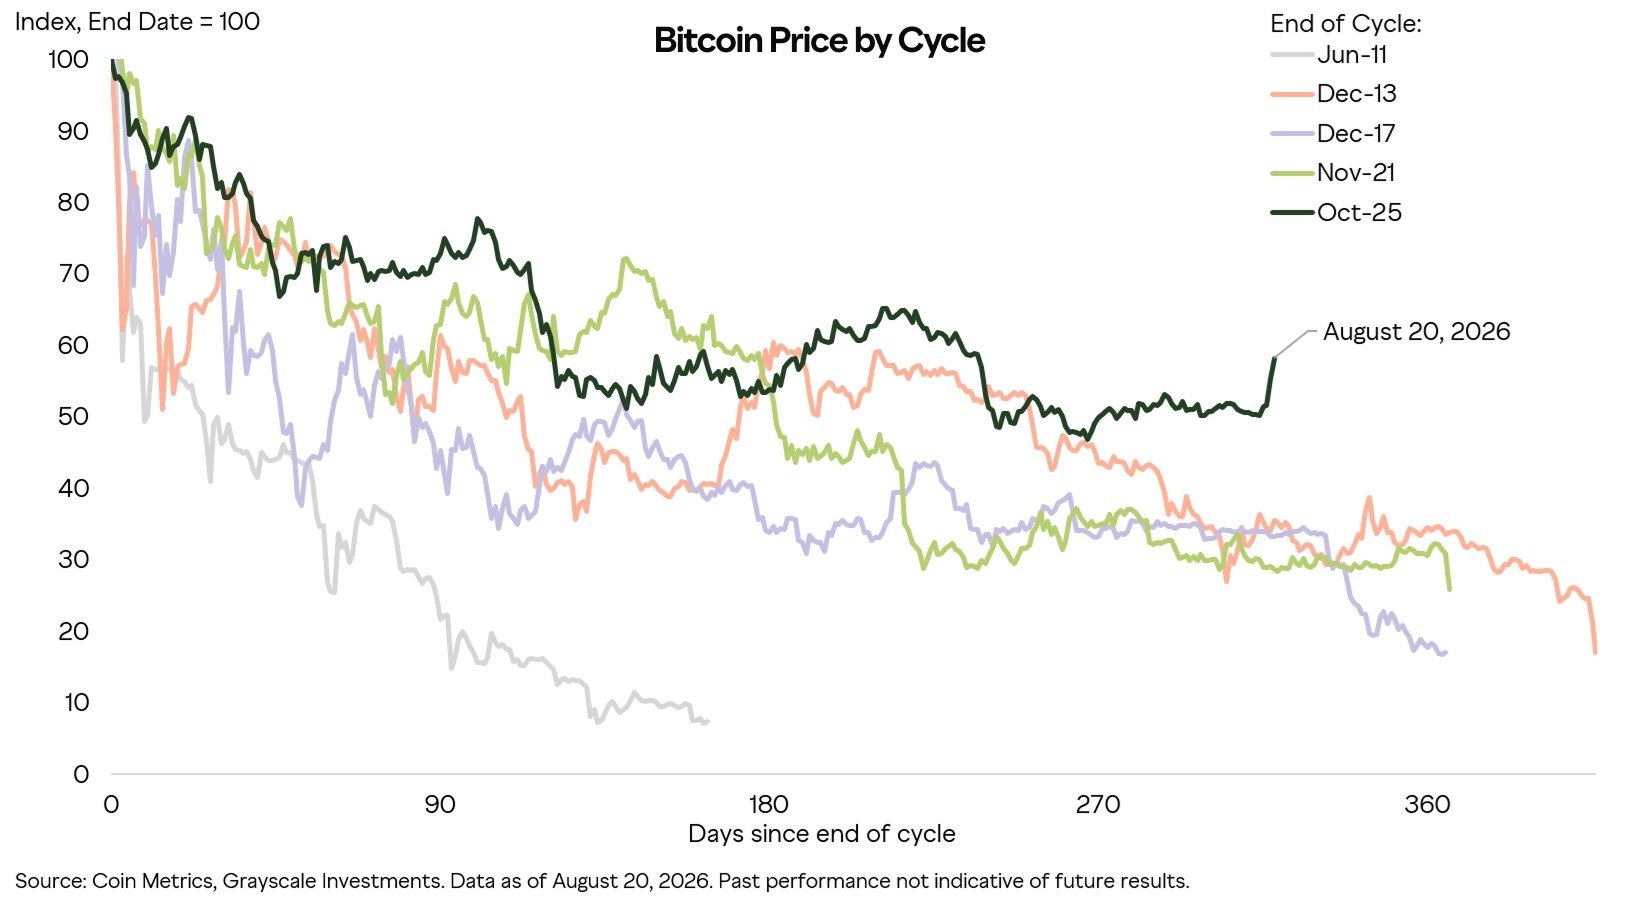
The visualization uses Coin Metrics historical Bitcoin price data to compare the current drop with four previous cycles that peaked in June 2011, December 2013, December 2017, and November 2021. Bitcoin’s current price decline is less severe than the four prior cyclical declines shown on the chart.

Grayscale said:

“Historically, Bitcoin has found a bottom at roughly 80% below the cycle’s peak price. On the latest bear market, Bitcoin fell about 50% from its peak, which is less than all prior cycles to date.”

This comparison does not prove the latest low will hold but indicates the market has weathered a downturn without repeating prior losses of around 80%.

Bitcoin’s periodic growth and correction phases have often followed a roughly four-year cycle linked to halvings, liquidity, and investor behavior. Prior Bitcoin market cycles included correction phases where prices fell roughly 78–94% from prior peaks, although changes in market structure may reduce the depth of future declines.

Other Market Signals Point to Accumulation

Separate research has also identified conditions associated with later-stage Bitcoin corrections. A VanEck analysis from Aug. 18 found that as of Aug. 12, eight of 12 capitulation signals were active, with all 12 having entered capitulation zones at some point during the prior three months.

VanEck’s “Bitcoin Chaincheck” analysis characterized the decline as potentially late-stage and noted that Bitcoin may be approaching or entering an accumulation phase. VanEck also expects the bottom to be shallower than in prior cycles, citing spot exchange-traded products, a broader base of institutional holders, and an absence of major leveraged lender bankruptcies.

These indicators do not provide reliable short-term confirmation of a bottom. VanEck found that comparable clusters of signals in the past delivered below-average returns over 90 and 180 days. Annualized returns exceeded Bitcoin’s typical performance, but that finding was based on a small set of observations with significant overlap.

ETF Demand Reinforces Recovery

The resumption of investments into U.S. spot Bitcoin exchange-traded funds (ETFs) serves as another indicator of demand underpinning the recovery. Over five trading sessions, these products recorded net inflows of approximately $1.92 billion, finishing Aug. 21 with five consecutive days of increases and total net assets of $96.07 billion.

These inflows suggest the rally has extended beyond forced buying from shorts closing their positions, yet they do not confirm another decline has been averted. Rising interest rates, decreasing liquidity, renewed ETF share redemptions, or profit-taking could still jeopardize the market’s recent gains.

Grayscale concluded:

“Market discussions have centered on whether Bitcoin will see another downturn in Q4 2026. While risks remain, this week’s rally may indicate we have reached a more sustainable bottom.”


end-content

Domande pertinenti

QAccording to the article, why might this week be a turning point for Bitcoin?

AGrayscale suggests this week could be a turning point because Bitcoin's rapid recovery, which broke a prolonged trading range and forced bearish derivatives traders to close positions, may signal that the latest bear market has reached an inflection point. The recovery coincided with renewed spot demand and ETF inflows.

QHow does the current Bitcoin price decline compare to previous market cycles according to Grayscale's chart?

AAccording to Grayscale's chart comparing the current cycle to four previous ones, the current decline in Bitcoin's price is less severe. Historically, Bitcoin bottomed at roughly 80% below its cycle peak, but in the latest bear market, it fell only about 50% from its peak, which is shallower than all prior cycles at this point.

QWhat did VanEck's 'Bitcoin Chaincheck' analysis indicate about the state of the market?

AVanEck's 'Bitcoin Chaincheck' analysis indicated that as of August 12th, eight out of twelve capitulation signals were active, with all twelve having been in capitulation zones at some point in the prior three months. It characterized the downturn as potentially being in a late stage and noted Bitcoin may be approaching or entering an accumulation phase.

QWhat recent trend in U.S. spot Bitcoin ETFs is mentioned as supporting the recovery?

AThe article mentions that U.S. spot Bitcoin ETFs recorded approximately $1.92 billion in net inflows over five trading sessions, ending August 21st with five consecutive days of increases and total net assets of $96.07 billion. This trend indicates underlying demand beyond forced short-covering.

QWhat three factors did Grayscale highlight for long-term investors to consider in their analysis?

AIn their analysis, Grayscale highlighted three factors for long-term investors to consider: ongoing structural adoption, the maturity of the bear market, and a potentially favorable macroeconomic backdrop.

Letture associate

Bessent's True Agenda

U.S. Treasury Secretary Besant's recent interventions in the bond market are seen by some as an attempt to artificially trigger a massive short squeeze before the midterm elections. The alleged goal is to push the 10-year yield toward 5% initially, then use covering by short sellers to drive it down to around 4.3%, providing political breathing room for the Trump administration. Analysts point to near-record short positions held by CTA trend-following funds. According to Goldman Sachs data, a price rally of two standard deviations could trigger historically large short-covering. Besant's tactics reportedly include bond buybacks, shifting issuance toward shorter-term debt, and potentially canceling ultra-long bond auctions to pressure these market positions. So far, interventions like modest buybacks have had limited effect on yields, with the Treasury later hinting at using its General Account (TGA) cash for support. Critics argue these measures cannot address structural pressures like large deficits and high inflation. Instead, the strategy appears tactical—aimed at buying time and exploiting technical market vulnerabilities rather than reversing the underlying yield trend. The political timeline is clear: achieve lower yields ahead of the midterms to help lower mortgage rates and craft a favorable narrative. However, analysts warn that once the election passes, structural upward pressure on yields and equity valuations could reassert themselves more forcefully. Market signals suggest this potential short-squeeze dynamic could intensify in the coming days.

marsbit42 min fa

Bessent's True Agenda

marsbit42 min fa

Jackson Hole Speech Preview: Is the Fed Seeking Justification for a Rate Hike?

"Jackson Hole Speech Preview: Is the Fed Looking for Reasons to Raise Rates?" Ahead of the key Jackson Hole symposium, Federal Reserve officials and the IMF are signaling heightened concern over persistent inflation, with some advocating for tighter policy. Boston Fed President Susan Collins, in a recent article, supported holding rates steady only if evidence of falling inflation continues. Otherwise, she argues for prompt tightening, noting inflation has been above target for over five years and warning that prolonged deviation could entrench consumer expectations. Although not a voting member this year, her stance aligns with several officials; three FOMC voters dissented in July, favoring a rate hike. Richmond Fed's Tom Barkin warned of a future "reckoning" regarding the $40 trillion public debt, while IMF Managing Director Kristalina Georgieva urged central banks to maintain a laser focus on price stability. The core dilemma lies in the sources of inflation: Trump-era tariffs, Middle East conflict-driven oil prices, and surging AI investment. Collins believes the first two factors are fading, but identifies AI infrastructure spending as exerting "upward pressure" on core goods inflation. The problem is that interest rate hikes primarily curb demand, not these supply-side shocks. Georgieva framed it as a "tug of war" between negative supply shocks from the Middle East and positive demand shocks from AI. Meanwhile, economic data shows strain. The August Consumer Confidence Index fell to a seven-month low of 89.4. While the present situation index improved, future expectations plummeted. Consumers expect higher inflation (5.8% vs. 5.6% last month), likely influenced by high gas prices. Other data points are weak: July retail sales saw the largest drop in over a year, and job growth stalled. Key upcoming events include the July PCE inflation data (expected to remain well above the 2% target) and new Fed Chair Kevin Warsh's first major speech at Jackson Hole. Market pricing remains conflicted, showing a high probability of a December hike but expecting no move in September. Gold prices, however, have surged over 7% to near three-month highs, signaling market anxiety.

marsbit57 min fa

Jackson Hole Speech Preview: Is the Fed Seeking Justification for a Rate Hike?

marsbit57 min fa

Today, HYPE Activates Its Second Buyback Engine

"Hyperliquid Activates Second Buyback Engine with AQAv2 Launch" On August 26th, Hyperliquid officially activated its Aligned Quote Assets v2 (AQAv2) mechanism, introducing a major new source of revenue and buyback power for its native token, HYPE. Unlike the existing revenue stream from trading fees, AQAv2 generates income by sharing approximately 90% of the adjusted reserve earnings from stablecoins (primarily USDC) circulating on the Hyperliquid chain. This income is settled every 30 days and automatically funneled into the Assistance Fund for HYPE buybacks, with the first expected distribution on October 3rd. Through a partnership with Circle (issuer of USDC) and Coinbase (treasury manager), Hyperliquid leverages its user base and financial infrastructure to share in the yield generated by stablecoin reserves. This transforms its liquidity and distribution capabilities into a scalable business model. Initial estimates project AQAv2 could generate $150-200 million in annual buyback funds, based on the current ~$6.43 billion USDC supply on Hyperliquid and an assumed reserve yield. Crucially, this revenue is weakly correlated with trading activity and grows directly with the platform's stablecoin adoption. With HYPE recently reaching an all-time high, AQAv2 provides a new fundamental support layer. It shifts Hyperliquid's value capture beyond just transaction fees, anchoring HYPE's long-term buyback potential to the expanding scale of its stablecoin ecosystem.

marsbit1 h fa

Today, HYPE Activates Its Second Buyback Engine

marsbit1 h fa

NVIDIA Earnings Preview: The Market No Longer Expects a Positive Surprise

NVIDIA's upcoming earnings report has seen market expectations shift from anticipating big positive surprises to seeking clarity on capital allocation and future growth sustainability. While analysts forecast Q2 revenue near doubling year-over-year to $92.18 billion, option markets are pricing in a relatively muted post-earnings stock move of around 5.4%—the lowest implied volatility in two years. This reflects a growing sense that the phase of massive AI-driven earnings beats and stock surges may be ending. This year, NVIDIA's stock has slightly underperformed the S&P 500 and significantly lagged the semiconductor index. Analysts now emphasize the need for more than just beating estimates. Key investor focuses include details on how NVIDIA will deploy its capital, maintain its exceptional gross margins amid rising costs, and use its substantial free cash flow for investments and share buybacks. The forward P/E ratio of about 21x suggests the market is already pricing in a growth deceleration. NVIDIA's recent strategic moves—like facilitating massive AI financing, guaranteeing loans for data center projects (including a major one for OpenAI), and investing in power infrastructure—have positioned it beyond a mere chipmaker. However, this raises questions about potential "circular financing," where revenue might be artificially supported by lending to customers. The health of its AI clients, like OpenAI which reported slowing revenue growth, is now crucial. The report arrives amid a challenging backdrop: political pushback against AI data centers, rising borrowing costs, and massive debt-funded spending by cloud giants. Investors are keenly watching for signals on the transition to the new Blackwell and upcoming Vera Rubin architectures and, ultimately, whether the explosive demand for AI is losing momentum.

marsbit1 h fa

NVIDIA Earnings Preview: The Market No Longer Expects a Positive Surprise

marsbit1 h fa

Trading

Spot
活动图片