As the US and Japan Hike Interest Rates, Which Asset Class is Most at Risk?

marsbitPubblicato 2026-06-16Pubblicato ultima volta 2026-06-16

Introduzione

This week, global markets face two major events: the Bank of Japan's likely interest rate hike and the US Federal Reserve's FOMC meeting. For risk assets, it is a pivotal and volatile week. In the US, expectations for rate cuts have faded dramatically. May's higher-than-expected CPI and resilient jobs data have shifted the Fed's focus from potential cuts to the possibility of future hikes. New Fed Chair Wash is unlikely to raise rates at this meeting, but any hawkish shift in communication, the dot plot, or the policy statement could lead markets to price in tighter policy, pushing up short-term Treasury yields and strengthening the dollar. High-valuation growth stocks, AI-related assets, and small-cap stocks reliant on cheap funding are most vulnerable to rising rates. In Japan, a 25 basis point hike is almost fully priced in (98.3% probability), which would bring the policy rate to 1%, its highest since 1995. The concern is not the hike itself, but its potential to unwind the massive "carry trade," where investors borrowed low-yielding yen to invest globally. Historically, Japan's rate hikes have coincided with global market stress (2000, 2007, 2024). While this well-telegraphed hike may be digested smoothly, two key factors increase uncertainty: 1) Governor Ueda's absence due to illness, putting communication in the hands of less-familiar deputies, and 2) the Fed meeting occurring just days later, creating potential for a compounded market reaction if both central banks ...

This week in global markets, the main themes are Japan's interest rate hike and the Federal Reserve meeting. For risk assets, this week is destined to be anything but mild.

Three months ago, Wall Street was still discussing when rate cuts would come. Markets were willing to give the new Chairman some leeway, inflation was coming down, employment was loosening up, and rate cuts seemed only a matter of time. But the financial world is fickle; the script everyone imagined did not come to pass.

May CPI rose 4.2% year-on-year, 0.5% month-on-month. Energy prices rose 3.9% month-on-month, while core CPI remained around 2.9% year-on-year. Employment also gave the Fed no reason to turn dovish immediately. Non-farm payrolls added 172,000 in May, with the unemployment rate holding at 4.3%. This means the Fed now faces an awkward combination: inflation is reaccelerating, employment shows no significant weakness, and AI-related investment continues to support economic resilience. The case for rate cuts has weakened, while the conditions for rate hikes are gradually building.

Meanwhile, the Bank of Japan's policy meeting on June 15-16 is widely expected to deliver a 25 basis point hike as the base case. Polymarket's 'Bank of Japan Decision in June' contract shows a ~98.3% probability of a 25bp hike, ~1.45% for no change, and ~0.55% for a 50bp or more hike.

Many likely remember that Japan's previous interest rate hikes had significant impacts on the broader financial markets. This time, the market faces Japan's hike on Tuesday and the Fed's FOMC meeting on Thursday. Will the market fall?

Warsh's 'Debut': Fed Rate Hike Probability Rises

First, let's look at the Fed side.

The possibility of rate cuts seems to have been almost shut off. Polymarket shows 'No rate cut in 2026' at ~70.35%, 'Rate cut before July' at ~2.35%, and 'Rate cut before December' at only ~23%. Seven out of ten people are betting on not a single cut this year. For the year-end rate range, maintaining a 3.75% upper bound is ~37%, 4.00% ~32.5%, 4.25% ~11.25%, and 4.50% and above ~3.35%. Above 4.00% combined is ~47%.

The market's judgment of Warsh is largely a consensus that in his debut, this week's FOMC meeting, he is highly unlikely to act on a hike. Hike risks are mainly concentrated after the third quarter. Several Polymarket contracts illustrate this consensus:

'Fed rate hike in 2026?' shows a ~34.5% probability of a hike at any time in 2026; 'Fed rate hike by...?' shows ~0.65% probability by June, ~6.15% by July, ~24.5% by September, ~32% by October; 'Fed Decision in July' shows ~3.15% for a 25bp hike in July, ~0.3% for 50bp or more, ~93.5% for no change; 'What will the Fed rate be at the end of 2026?' shows ~37% probability of the year-end upper bound at 3.75%, ~32.5% at 4.00%, ~11.25% at 4.25%, and ~3.35% at 4.50% or above.
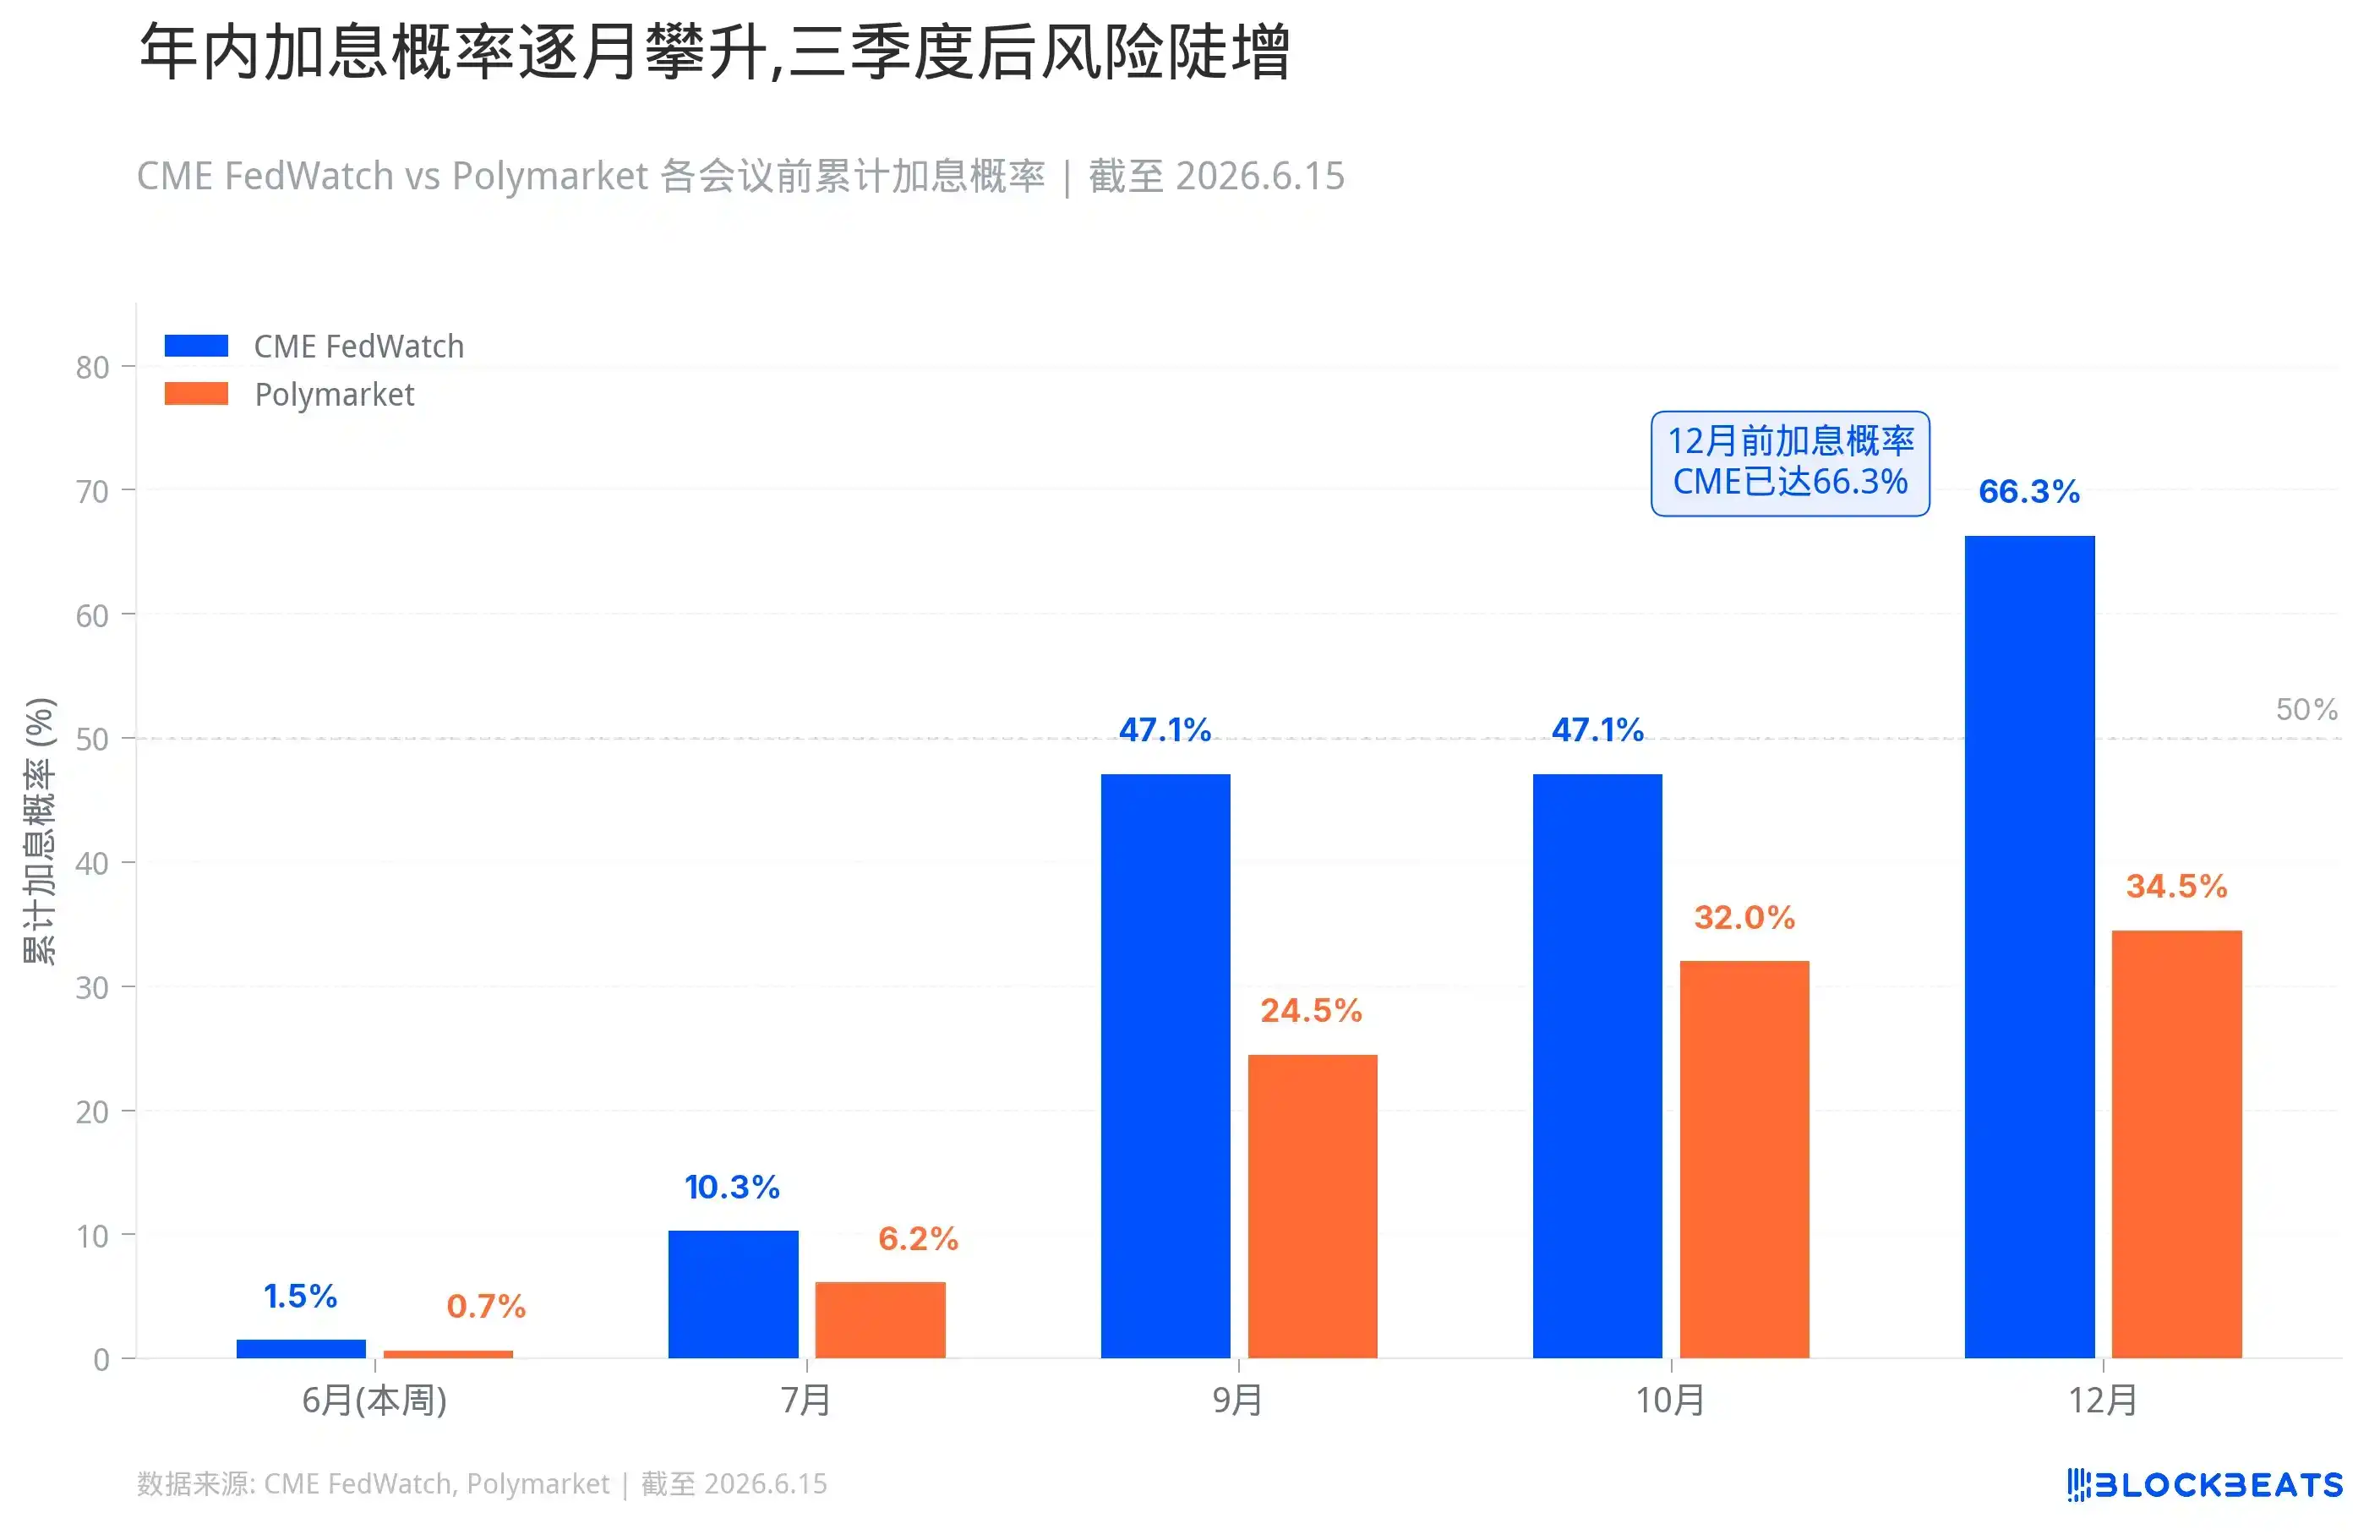
Looking at more specific probabilities and data. Probability of a hike before July 29 is ~10.3%, before October 28 ~47.1%, before December 9 ~66.3%. Polymarket is more conservative, with 'Fed rate hike in 2026?' at 34.5%, before September ~24.5%, before October ~32%. This month's probability: CME FedWatch shows 98.5% for no change, Polymarket shows 99.55%.

The US is highly likely to stand pat this week, but 'not acting' is different from 'not tightening'.

If Warsh acknowledges in the press conference that inflation risks are reasserting themselves over growth concerns, if the dot plot shifts the 2026 rate median from a cutting bias to flat or even upward revisions, if the statement removes dovish 'rate cut inclination' phrasing, then the market will do the tightening for the Fed.

The first to react will be the front end of the US Treasury curve. The 2-year and 1-year yields move directly with the Fed's path. Once the market shifts from 'rate cuts later' to 'possible rate hikes later', short-end yields will rise. The US dollar will also be supported; a strong dollar itself is a form of global tightening.

Within US stocks, high-multiple growth stocks and AI/long-duration assets are most sensitive. Higher rates make future cash flows less valuable in discounted terms, financing more expensive, and the market less willing to pay premiums for unproven stories. The logic for small-caps, micro-caps, and unprofitable tech stocks is even more fragile; these companies thrive on cheap money. Once money isn't cheap, valuations are the first to collapse.

If a true tail risk event occurs—a direct Fed hike amid 98.5% 'no change' pricing—the shock would be severe. Front-end rates would jump, the dollar would surge, leveraged positions would be forced to derisk. It's not saying it will definitely happen, but the meaning of such a low probability is that if it does happen, no one would have time to react.

After all, the market has magnified the importance of Warsh's 'debut' partly because he may change the Fed's communication style. Long-time Fed watchers like Timiraos have clearly articulated the issue: for Warsh, symbolic adjustments like the dot plot, statement wording, and press conference tempo can be made quickly, but truly changing the Fed's communication framework requires long-term persuasion and internal coordination. This week's meeting could be the first step.

Across the Pacific: The 'Curse' of Japan's Rate Hikes

Now, looking at Japan. The BOJ meets June 15-16, with Polymarket pricing a 25bp hike at 98.3%. If implemented, the policy rate would rise from 0.75% to 1%, the highest since 1995.

The logic pushing Japan to this point is straightforward. Middle East conflicts push up oil prices; Japan is a typical energy importer, and a weak yen amplifies import costs. Wages are rising, service prices are rising, inflation expectations are shifting. Maintaining low rates would raise doubts about whether the BOJ still cares about controlling inflation.

The hike itself is no surprise, but a crucial concern is: over the past few years, massive global funds borrowed cheap yen, converted to US dollars or other high-yielding assets, buying US Treasuries, stocks, credit—some indirectly flowing into high-volatility risk assets. This structure is built on one premise: Japanese interest rates are low enough, yen funding is cheap enough, and the central bank is slow enough. In other words, if the market believes Japan's interest rate normalization is continuous, the carry trade becomes fragile, yen shorts get squeezed, and global leveraged funds begin to contract.

The market's fear of a BOJ hike is not unfounded. Over the past two decades, almost every time the BOJ tried to lift rates from near zero, global markets ran into trouble.

The first was August 2000. The BOJ raised rates from zero to 0.25%, coinciding perfectly with the peak of the US dot-com bubble. Within three months of the hike, the Nasdaq fell 35%. Japan's own economy couldn't withstand it, quickly sliding back into recession, forcing the BOJ to cut rates back to zero in 2001.

The second was 2006 to 2007. The BOJ raised rates to 0.5% in two steps: first in July 2006, then in February 2007. The timeline almost perfectly matches the incubation period of the US subprime crisis. In the summer of 2007, US subprime mortgages began to implode; in 2008, Lehman Brothers collapsed, triggering the global financial crisis. The BOJ was forced to cut rates back to zero once again.

The third was July 31, 2024. The BOJ raised rates from 0% to 0.25%, a small move, but the market reaction was extreme. On August 5, the Nikkei 225 plunged 12.4% in a single day, its biggest drop since Black Monday in 1987. South Korea's KOSPI triggered circuit breakers; the Nasdaq and S&P 500 fell 3.4% and 3% respectively. The VIX fear index surged above 65. The transmission mechanism of that crash was clear: the BOJ hike triggered a sharp yen rally, forcing unwinding of carry trades that borrowed yen to buy foreign assets—selling stocks to repay yen, leading to collective selling and a stampede. To meet margin calls, fund managers even sold 'safe-haven assets' like gold and BTC. In the liquidity crisis, correlations among all assets approached 1. I still vividly remember the market carnage that day.

Therefore, what's more important is what signals the Japanese government will provide at tomorrow's press conference: how high will rates ultimately go?

US Stocks, US Treasuries, Bitcoin: Which is Most at Risk This Week?

As mentioned earlier, global markets mostly declined during the BOJ's past three hiking cycles.

But the BOJ hike itself doesn't necessarily crash the market; crashes usually occur when other fragile leverage exists. For instance, 2000 and 2007 coincided with larger bubbles elsewhere. August 2024 was due to a surprise move and overly heavy market positioning leaving no time to react. Subsequent hikes, with preparation, passed without incident.

This time, a 25bp move is priced at 98.3%, leaving almost no room for surprise. Based on the experience of December 2024 and January 2025, the hike itself will likely be digested smoothly. But this time, there are two additional variables.

First, Governor Ueda was hospitalized with an infectious liver cyst and is expected to miss this meeting and the post-meeting press conference. According to public reports, Deputy Governor Himino Ryo will serve as acting chair for the meeting, and Deputy Governor Uchida Shinichi will host the post-meeting press conference. This arrangement is unlikely to change the hiking direction. However, the market is less familiar with Uchida's communication style than Ueda's, potentially amplifying volatility in interpreting his wording. Phrases like 'will judge future moves based on data' versus 'there is still room for normalization' may seem similar but send completely different signals to traders.

Second, the US meets in the same week. The BOJ meeting and the FOMC are only one day apart. If the market reacts mildly to the BOJ hike but Warsh turns hawkish in his press conference the next day, the two layers of pressure could compound. Conversely, if the market is already tense after the BOJ move and Warsh adds fuel to the fire, short-term sentiment could overreact. Having two central banks deliver results back-to-back, this scheduling itself amplifies volatility.
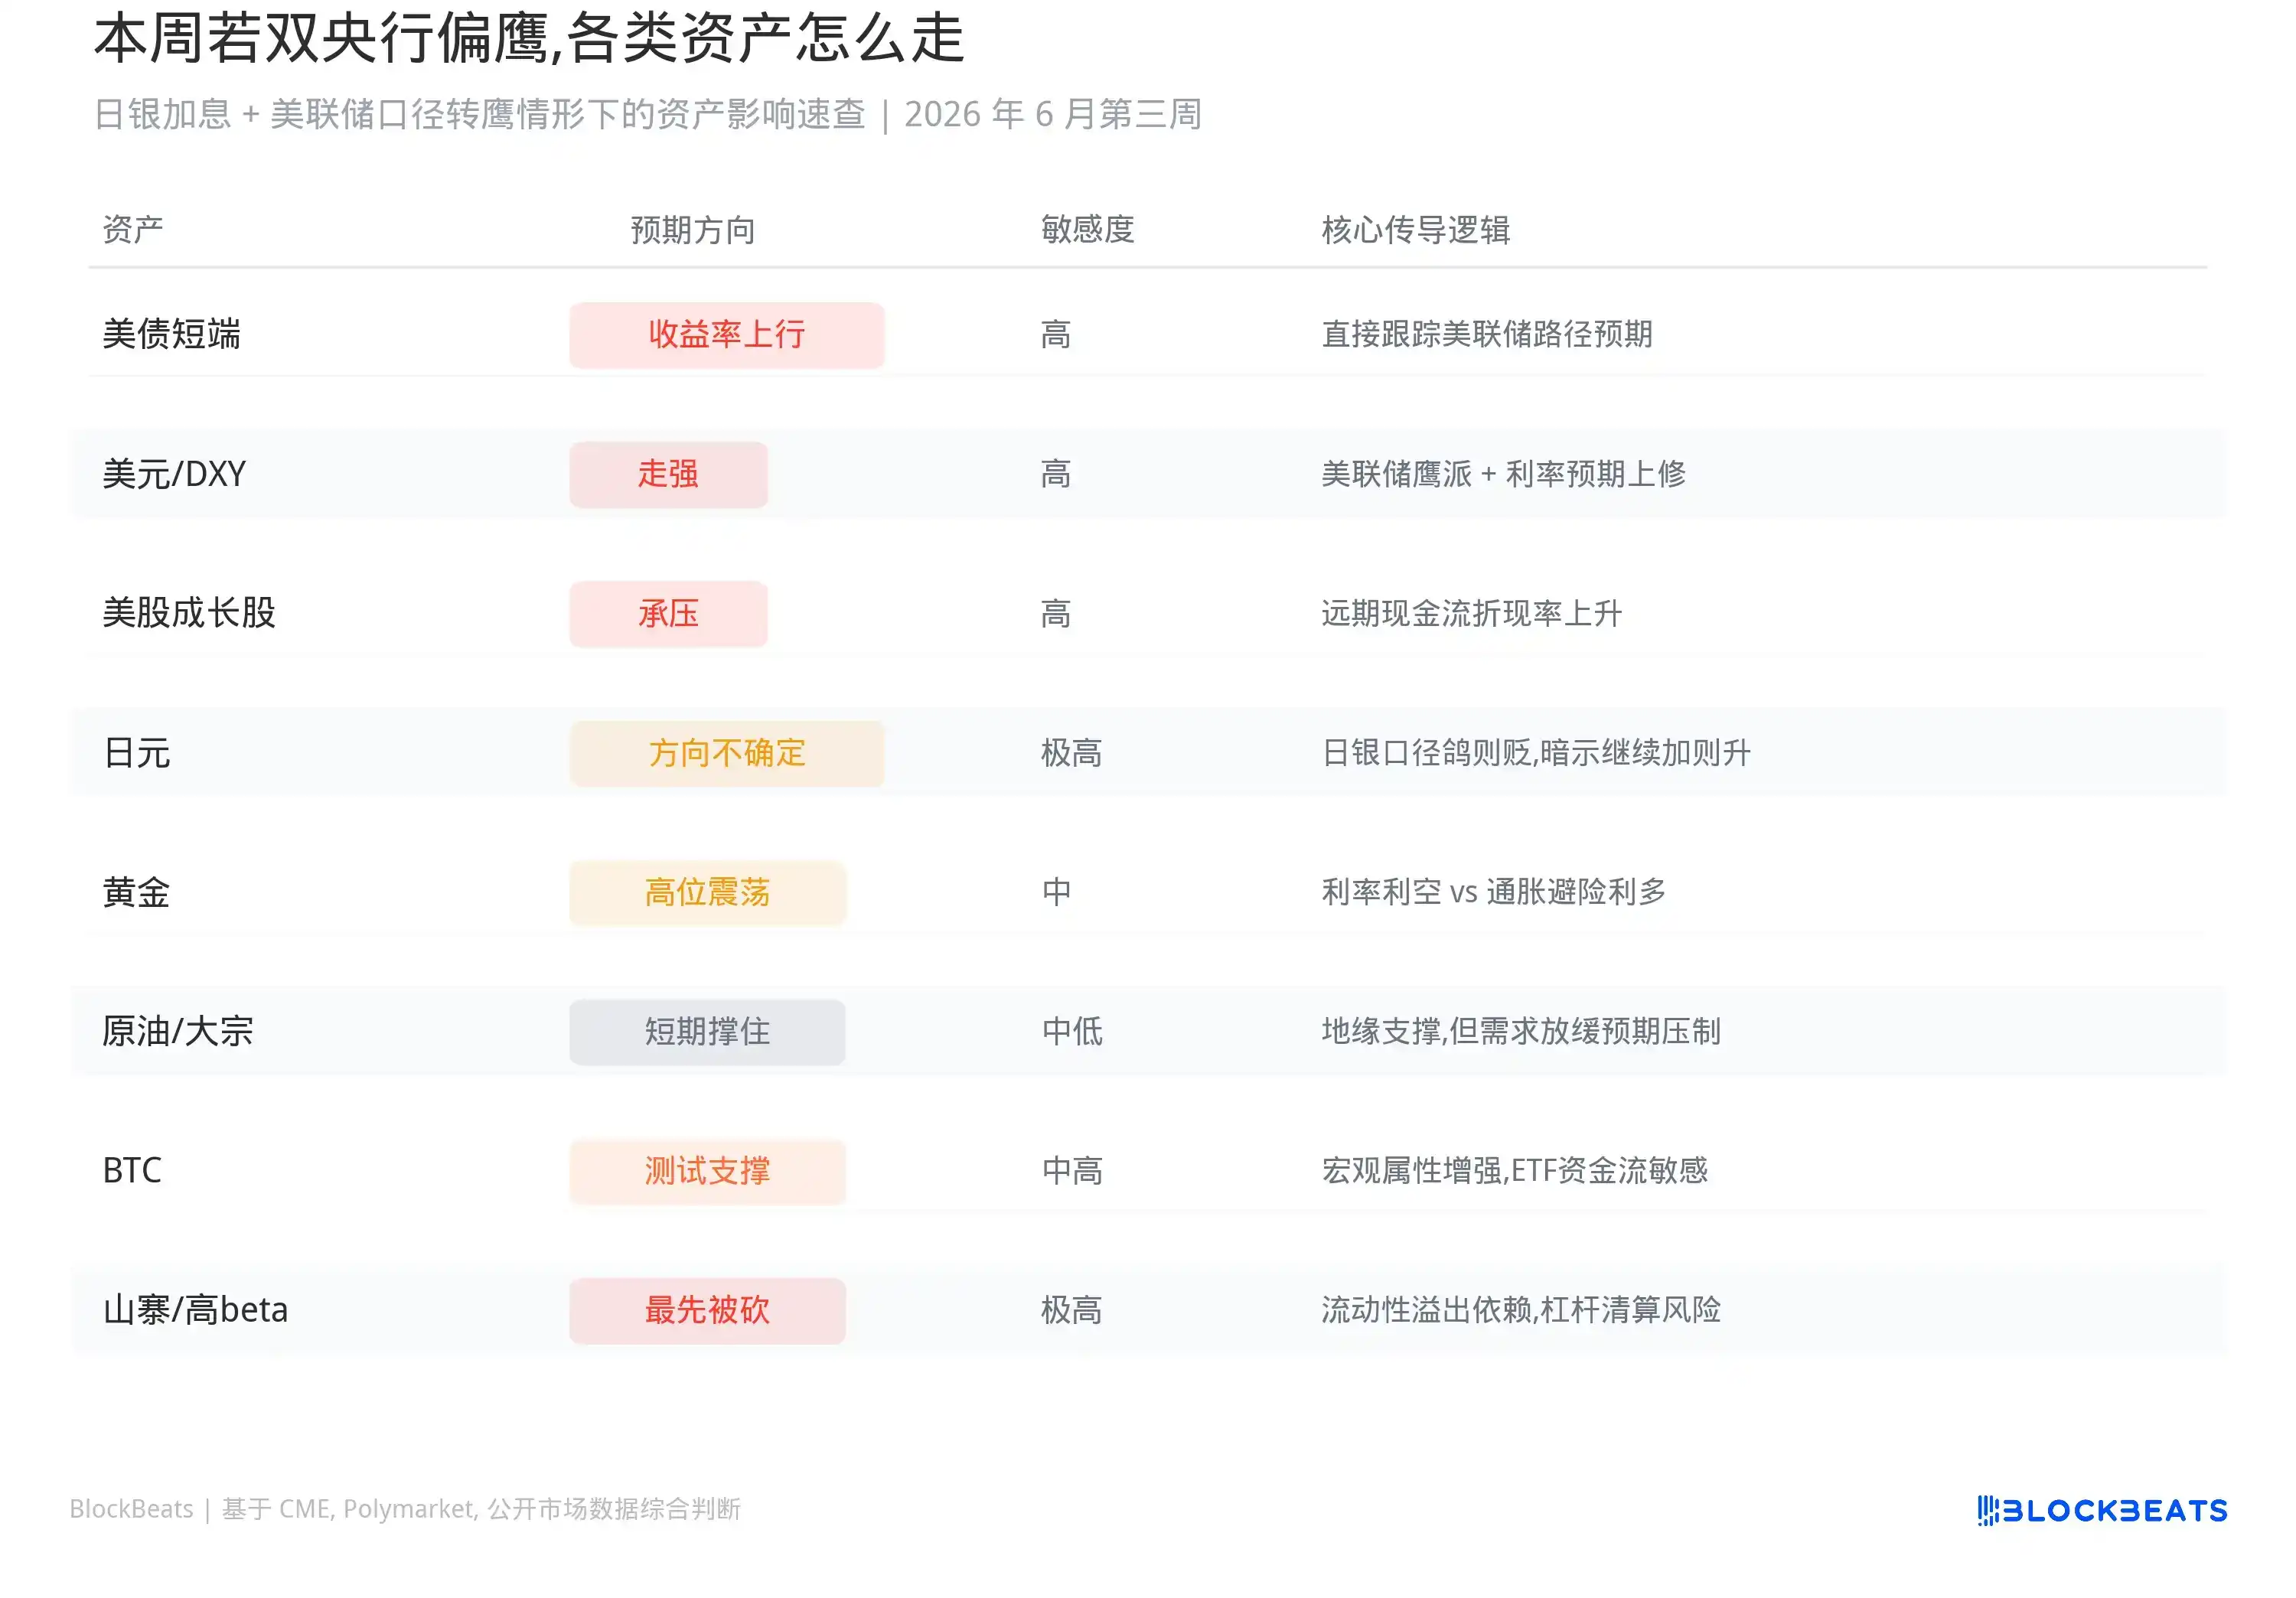
Let's analyze asset by asset:

US Treasuries will likely react first this week. Front-end yields move directly with the Fed's path, with the 2-year and 1-year being most sensitive. If Warsh's press conference is hawkish or the dot plot is revised upward, front-end yields will rise, reflecting the market's repricing of 'later cuts' or even 'a hike this year'. The long end is more complex; the 10-year yield may not rise in sync. If the market begins to worry high rates will hurt the economy, the yield curve could flatten further or deepen its inversion. On the Japan side, if Uchida hints at further hikes, Japanese government bond yields will also be pushed up. Marginal adjustments to Japan's $1.13 trillion US Treasury holdings could, in turn, impact supply and demand in the US Treasury market.

The US dollar will likely find support. A hawkish Fed tilt boosts expectations for US dollar asset yields, strengthening the DXY. A BOJ hike is theoretically positive for the yen and negative for the dollar, but the actual direction depends on the tone: if the BOJ follows the hike with dovish signals, the yen may not rise but could fall, making the dollar index even stronger. With two central banks meeting in the same week, the relative movement of the USD/JPY will be highly sensitive, and forex market volatility will likely increase. Asian and emerging market currencies will face pressure; a strong dollar itself is a form of global tightening, sucking dollar liquidity from abroad.

US stocks will show clear divergence. High-multiple growth stocks, AI/long-duration assets, small-caps, micro-caps, and unprofitable tech stocks are most vulnerable. Higher rates make distant cash flows less valuable, financing more expensive, reducing willingness to pay premiums for unproven stories. The Russell 2000 and companies reliant on cheap money will be the first hit. Bank stocks will have a complex reaction; short-term net interest margins may benefit, but if the curve inverts further and credit risks rise, it may not be positive. Defensive stocks may hold up relatively better, but 'bond-like assets' like utilities and REITs will also see valuation pressure from higher rates. The S&P 500 closed near 7382 last Friday, and the Nikkei 225 was around 66078. If both central banks lean hawkish this week, both US and Japanese stocks will face pressure, especially indices heavy with tech.

Japanese stocks are in a special position. A BOJ hike itself is negative for Japanese exporters, as a stronger yen erodes overseas profits. But if the hike magnitude and pace are within expectations, Japanese stocks may not fall sharply, as shown by the experiences of December 2024 and January 2025. The real risk lies in the post-meeting communication; if Uchida hints at further normalization, the Nikkei may fall first and then reassess.

Gold will be pulled by two forces. Rising real rates and a stronger dollar are typically negative for gold. But if the hikes are driven by energy shocks, geopolitical risks, and runaway inflation, safe-haven demand will support prices. Gold will likely trade in a high range this week, with direction depending on what the market fears more: higher rates or uncontrolled inflation. Crude oil depends more on supply/demand and geopolitics; Iran tensions persist. If hikes are due to oil-driven inflation, oil may not fall immediately. But if the market starts pricing in demand slowdown expectations, industrial metals and oil will face pressure later.

Credit and real estate are slower-moving but the direction is clear. High-yield bond spreads will widen, financing costs will rise, and commercial real estate, REITs, and mortgage-sensitive assets will face pressure. Emerging markets with high US dollar debt will also suffer more, with increased capital outflow pressure.

Crypto markets also face pressure in this macro backdrop. BTC is currently around $65,000. In early June, it was at $72,000, then fell to around $61,500 after the CPI report, rebounding only in recent days. This level is inherently unstable. When it broke below $62,000 on June 5, over $1.5 billion in long positions were liquidated on-chain, and Bitcoin spot ETFs saw $2.7 billion in net outflows over a single week. Although the price has recovered somewhat, the positioning structure is not healthy. BTC has some macro asset attributes; it may not necessarily crash with rising rates, but it's also unlikely to rally independently. ETH, SOL, altcoins, memecoins, and small-cap coins are more vulnerable. These assets feed on liquidity spillovers and risk appetite. Once the market starts comparing the appeal of cash, short-term bonds, and money market fund yields again, high-beta assets are the first to be cut. Contract funding rates have declined, and on-chain risk appetite has cooled, as seen in early June.


Domande pertinenti

QBased on the article, why has the market's expectation shifted from anticipating Federal Reserve rate cuts to discussing potential hikes?

AThe shift is due to recent economic data showing renewed inflationary pressure and resilient employment. Specifically, May CPI rose to 4.2% year-over-year with a 0.5% monthly increase, driven partly by a 3.9% rise in energy prices. Core CPI remains around 2.9%. Meanwhile, May non-farm payrolls added 172,000 jobs, and the unemployment rate held at 4.3%. This combination of rising inflation without a significant slowdown in the job market, alongside continued economic resilience from AI-related investments, has weakened the case for rate cuts and made the conditions for potential hikes more plausible.

QWhat is the market consensus regarding the Bank of Japan's upcoming policy decision on June 15-16, and what is a key historical concern about BOJ rate hikes?

AThe market consensus, as indicated by Polymarket prediction markets, is an approximately 98.3% probability of a 25 basis point rate hike by the Bank of Japan (BOJ) in June. A key historical concern is that past BOJ attempts to raise interest rates from near-zero levels have often coincided with or precipitated significant stress in global financial markets, such as the dot-com bubble burst in 2000, the lead-up to the 2008 Global Financial Crisis in 2006-2007, and a major market sell-off in August 2024 triggered by unwinding of yen carry trades.

QAccording to the article, which asset classes within the US stock market are most vulnerable if the Federal Reserve adopts a more hawkish tone?

AWithin the US stock market, the most vulnerable assets to a more hawkish Fed are high-valuation growth stocks, AI-related long-duration assets, small-cap and micro-cap stocks, and unprofitable tech companies. These assets are sensitive to higher interest rates because their valuations depend heavily on discounting future cash flows, which become less valuable when rates rise. They also rely on cheap financing, which becomes more expensive in a tightening environment.

QHow does the article describe the potential impact of simultaneous policy meetings by the BOJ and the Fed in the same week?

AThe article states that having the BOJ and Fed policy meetings back-to-back in the same week amplifies market volatility. The outcomes and communication tones from the two central banks can create叠加压力 (superimposed pressure) or lead to an overreaction in short-term market sentiment. For instance, a mild reaction to a BOJ hike could be followed by heightened紧张 (tension) if Fed Chair Walsh strikes a hawkish tone the next day, or vice-versa. This scheduling本身 (itself) increases波动性 (volatility), particularly in currency markets (USD/JPY) and short-term interest rates.

QWhat are the two conflicting forces that will influence the price of gold this week, as explained in the article?

AGold will be pulled by two conflicting forces: 1) Upward pressure on real interest rates and a stronger US dollar, which are typically negative for gold prices. 2) Safe-haven demand, which could support gold if the reason for potential rate hikes is perceived to be energy shocks, geopolitical risks, and失控的通胀 (runaway inflation). The direction of gold will depend on which fear dominates the market: fear of rising rates or fear that inflation cannot be controlled.

Letture associate

U.S. Tech Momentum Stocks Post Largest Single-Day Gain Ever, But Is the Plunge Over?

US tech momentum stocks staged a sharp rebound on Tuesday (July 21st). Morgan Stanley's TMT Momentum Factor surged over 12%, marking its largest single-day gain on record, exceeding even peaks from the 2000 dot-com bubble. Key momentum indices from Goldman Sachs also posted their strongest daily performances in years. The rally was led by semiconductors, with the Philadelphia Semiconductor Index jumping 4.6%. This rebound followed three consecutive down days and a cumulative 33% plunge in momentum stocks, one of the steepest drawdowns since the dot-com era. Analysts attribute the surge largely to a short squeeze. Heavy selling had pushed high-beta momentum stocks into deeply oversold territory, forcing many short sellers, particularly in Asia, to cover their positions, creating a self-reinforcing buying spiral. However, the rebound's internals appear weak. Trading volume was notably low, and advancing stocks still lagged decliners on the S&P 500, indicating a narrow, concentrated rally rather than broad market participation. Diverging views emerge on the outlook. BTIG warns the bounce has hit key resistance and recommends selling into strength, citing extreme volatility and historical parallels to past market tops. Conversely, Goldman Sachs and UBS believe the momentum unwind is nearing its end, suggesting it may be time to gradually add exposure, as positioning has been significantly reduced. They caution, however, that high volatility warrants a measured approach, potentially using defined-risk strategies. The upcoming earnings season, particularly reports from major tech firms like Alphabet, is seen as a critical test for the rally's sustainability. Simultaneously, bond markets flashed a warning, with yields rising partly due to spiking oil prices. Analysts note that if long-term Treasury yields break decisively higher, it could pose a significant headwind for equities, especially growth stocks.

marsbit7 min fa

U.S. Tech Momentum Stocks Post Largest Single-Day Gain Ever, But Is the Plunge Over?

marsbit7 min fa

U.S. Tech Momentum Stocks Record Largest Single-Day Gain Ever, but Has the Rout Ended?

U.S. tech momentum stocks staged a dramatic rebound on Tuesday, July 21st. Key momentum indices like the Morgan Stanley TMT Momentum Factor and Goldman Sachs' High Beta Momentum Long Index posted historic or near-historic single-day gains, fueled largely by semiconductor stocks. This sharp rally followed a severe three-day sell-off that saw momentum stocks plunge 33%, marking one of the steepest pullbacks since the dot-com bubble. Analysts attribute the bounce primarily to a short squeeze, as forced covering from over-leveraged traders, particularly in Asia, created a buying spiral. However, the rally's health is questioned due to weak market breadth—overall trading volume was low, and decliners outnumbered advancers in the S&P 500 despite the index's gain—suggesting a narrow, concentrated surge rather than broad recovery. Opinions on the sustainability diverge. BTIG strategists warn the rebound has hit key resistance levels, citing extreme volatility and historic stock dispersion as signs of an ongoing broader correction, and recommend selling into strength. Conversely, Goldman Sachs and UBS view the aggressive momentum unwinding as nearing its end, noting reduced positioning and a lack of new fundamental catalysts. They suggest the sell-off presents a selective opportunity to add exposure, albeit cautiously and gradually using defined-risk strategies. The immediate trajectory hinges on the ongoing earnings season, with market focus on Alphabet's capital expenditure guidance for AI investment clarity. Meanwhile, bond markets present a risk, with rising Treasury yields—potentially heading toward 5.5%—and widening credit spreads for mega-cap tech companies posing a threat to equity valuations. The combination of technical factors, earnings results, and macro conditions leaves the durability of the rebound in doubt.

链捕手10 min fa

U.S. Tech Momentum Stocks Record Largest Single-Day Gain Ever, but Has the Rout Ended?

链捕手10 min fa

Long-Divided Must Unite, Long-United Must Divide: When L1 Becomes Its Own Rollup, What Is Ethereum's Endgame?

"The Inevitable Cycle: When L1 Becomes Its Own Rollup – What is Ethereum's Endgame?" For years, the Ethereum community grappled with concerns that L2s were fragmenting the ecosystem and eroding L1's value. While L2s provided cheaper execution, they also splintered liquidity and the unified user experience of a single chain. This has prompted a fundamental reassessment of the relationship between L1 and L2. Ethereum's roadmap is evolving. The "Scale" initiative merges L1 and L2 expansion into a holistic framework. L1 itself is advancing with higher gas limits, statelessness, and zkEVM verification, no longer content to be just a low-throughput settlement layer. Consequently, the primary value proposition of L2s is shifting from merely providing cheap blockspace to offering L1 cannot easily provide: application-specific optimizations, privacy features, and flexible governance models. L2s are becoming a spectrum of execution environments with varying degrees of security inheritance from Ethereum. A critical challenge in this multi-chain future is interoperability. The vision is to make Ethereum "feel like one chain again." This relies on advancements in native account abstraction (like EIP-7702) and intent-based architectures (Open Intents Framework), where users declare desired outcomes, and solvers handle the complex cross-chain execution. Furthermore, shortening Ethereum's finality time from minutes to seconds is crucial, as it underpins trust between chains for bridges, stablecoins, and cross-chain applications. Perhaps the most provocative idea is that Ethereum L1 itself could become a form of "its own Rollup." As zkEVM and proof systems mature, high-performance nodes could execute transactions and generate validity proofs. Regular validators would then verify these proofs instead of re-executing all transactions. This blurs the traditional L1/L2 hierarchy, making "Rollup" more of a general execution-verification architecture. Native Rollup aims to integrate L2 validation more directly into the Ethereum protocol, allowing L2s to inherit L1's security more fully and move away from reliance on security councils. In the end, L2s are not destined to replace L1 or be made obsolete by it. The likely future is a unified system where diverse execution environments—each optimized for specific use cases like DeFi, gaming, or privacy—coexist. They will share a common foundation of security, liquidity, and verifiable state, seamlessly connected to restore a cohesive user experience. The next phase for Ethereum is not just about scaling through separation, but about intelligently reintegrating what was separated back into a coherent whole.

链捕手26 min fa

Long-Divided Must Unite, Long-United Must Divide: When L1 Becomes Its Own Rollup, What Is Ethereum's Endgame?

链捕手26 min fa

Agent Race Ends, Super Workbench Takes Over

The era of fragmented AI agents is ending. Over the past month, China's tech giants—Tencent, Alibaba, and ByteDance—have simultaneously shifted strategy: instead of launching new, standalone AI agents, they are consolidating their various agent projects into unified "super workbenches." Tencent integrated its QClaw teams into WorkBuddy, a strategic product hailed as a potential third flagship after QQ and WeChat. Alibaba is merging its QoderWork, Wukong, and MuleRun agents into a new "Qianwen Office" platform under DingTalk's leadership. ByteDance rebranded its TRAE SOLO coding agent to TRAE Work, signaling a broader focus on workflow collaboration. This convergence marks a pivotal industry consensus. The initial exploration phase, where companies rapidly built numerous overlapping agents for different scenarios, proved costly and inefficient. With open-source tools eroding technical barriers, competition has shifted from agent creation to resource consolidation and cost control. Historically, platform wars are won not by creating more products, but by simplifying them—as seen with browsers unifying web access and super-apps consolidating services. Now, the "super workbench" aims to become the unified AI entry point for work. This reflects a deeper market realization: the primary audience for AI is no longer just programmers (a market in the tens of millions) but all knowledge workers (a market of billions). The real opportunity lies in augmenting everyday tasks—managing emails, documents, data, and meetings—across the entire workday. The core battleground is becoming control over the primary AI entry point that employees use daily. Tencent's WorkBuddy leverages WeChat and Tencent Docs; Alibaba's Qianwen Office taps into DingTalk's organizational data; ByteDance's TRAE Work integrates with Feishu's workflows. Whoever owns this "super workbench" gains strategic control over orchestrating enterprise data and APIs. This shift is redefining enterprise software. Traditional SaaS applications, valued for their user interfaces, will recede into the background. Their core functionalities will be exposed as standardized "Skills" or APIs for the super workbench's agents to invoke. Software value will shift from selling user seats to charging based on API calls and outcomes delivered. The evolution of agents is moving through clear stages: first as novel standalone products, then as consolidated primary work entry points, and finally as pervasive, invisible capabilities embedded into the digital fabric. The recent moves by major tech firms signal the transition from the first stage into the second, accelerating toward the third. In the end, the most successful agent technology may become invisible—like electricity or the HTTP protocol—a fundamental, unnamed infrastructure powering work itself.

marsbit53 min fa

Agent Race Ends, Super Workbench Takes Over

marsbit53 min fa

Trading

Spot
活动图片