Analyzing Virtuals Protocol’s bounce from golden pocket – Will $1 be next?

ambcryptoPubblicato 2026-03-24Pubblicato ultima volta 2026-03-24

Introduzione

Virtuals Protocol (VIRTUAL) saw an 83% surge in daily trading volume and a 3% price increase in the past 24 hours. However, market sentiment remains bearish, indicated by a predominantly negative funding rate and only a slight 1.75% rise in Open Interest. Despite a bearish higher timeframe trend, the token defended the $0.68 support level after a rejection at $0.82. This bullish reaction suggests potential gains ahead, with a rally toward the $0.875–$0.955 range likely. In the coming weeks, VIRTUAL could target $1, especially if the current bullish structure holds.

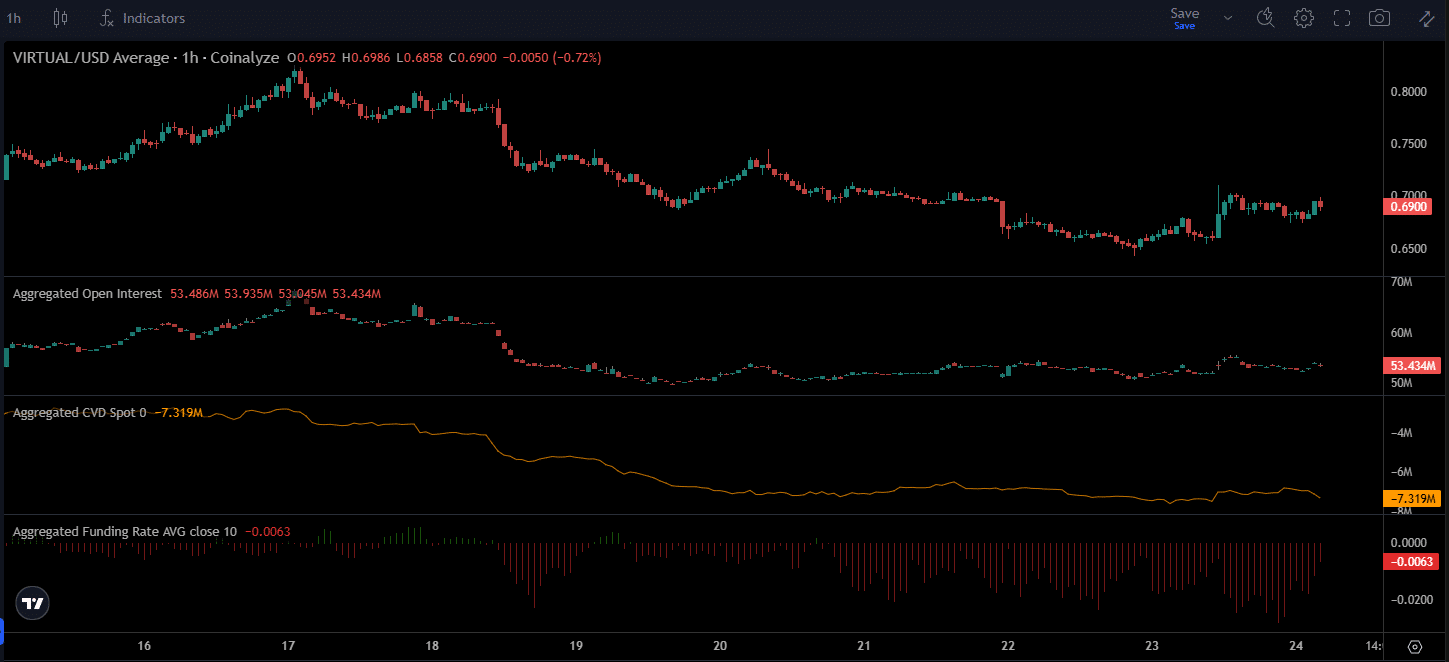
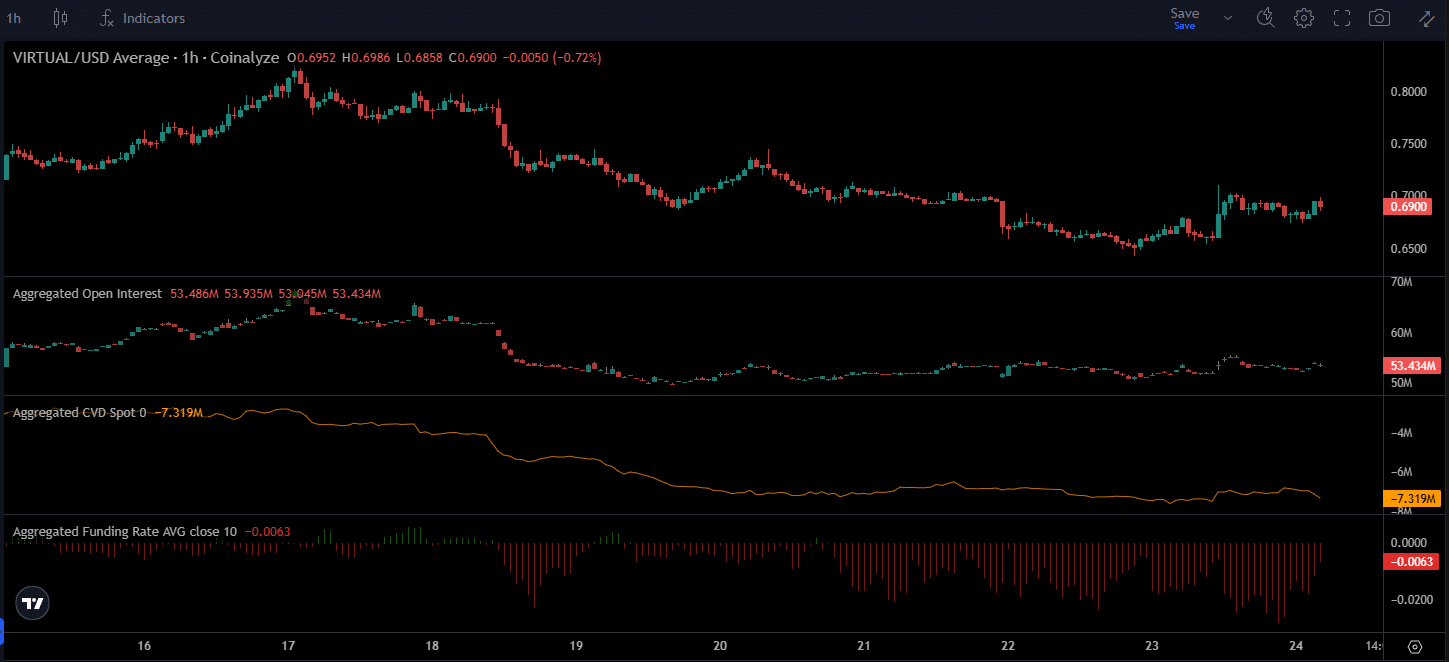
Virtuals Protocol [VIRTUAL] witnessed an 83% boost in daily trading volume and saw a 3% price gain in the past 24 hours. Its Open Interest [OI] was only up 1.75%, which suggested speculative conviction behind the AI token was relatively weak.
Source: Coinalyze

Coinalyze data showed that the Funding Rate was predominantly negative over the past week.

At the same time, the Spot CVD has been flat. Combined with the weak increase in OI, it showed that the VIRTUAL market sentiment remained bearish.

Let’s break it down from the higher timeframes.
Source: VIRTUAL/USDT on TradingView

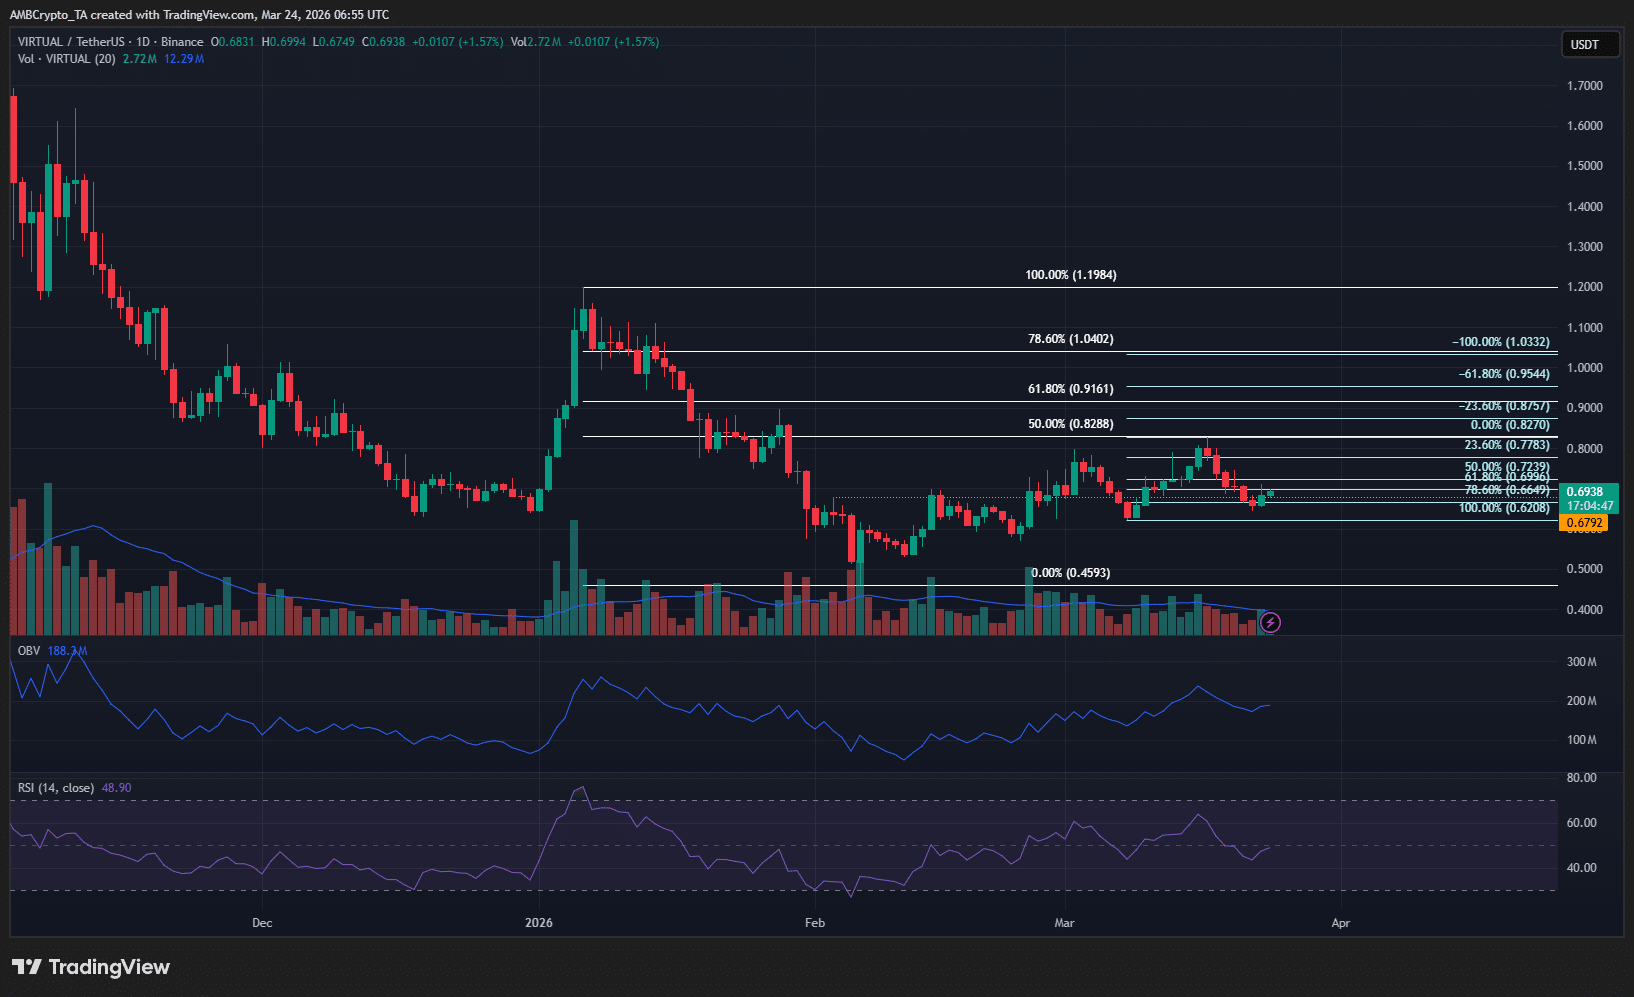
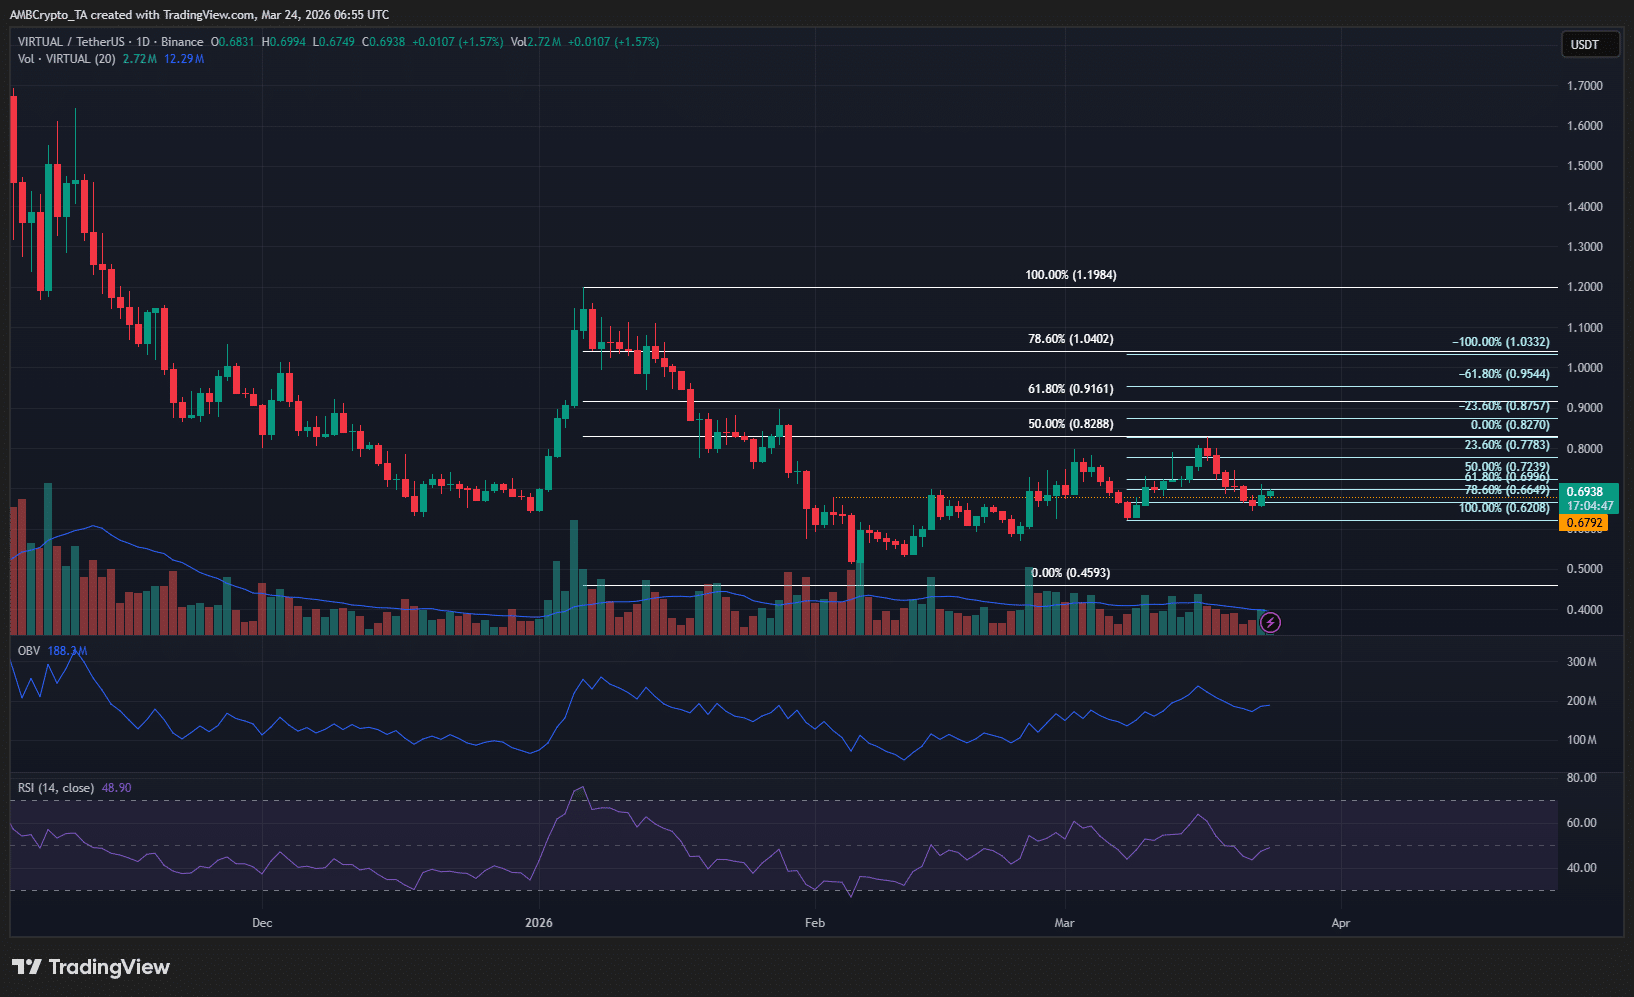
On the 1-day chart, the trend was bearish. The swing structure was bearish, and a set of Fibonacci retracement levels (white) was plotted using this.

At the same time, the internal structure was bullish.

The price faced rejection from the $0.82 level, the 50% retracement (white), but the $0.68 local support zone was defended.

This meant that further gains were likely. With Bitcoin [BTC] also back above $70k, the next week or two could see the bulls in control.

Virtuals Protocol token has completed its retracement

A week ago, AMBCrypto pointed out that downside risks were present for the popular AI token. This warning has been proven right, with VIRTUAL retracing from $0.82 to $0.64, a 22% move at its zenith.

This retracement was a healthy one for the bulls in the short-term. At the same time, the long-term structure was bearish. Traders can wait for a move toward $1 before they can begin to anticipate a bearish reaction.
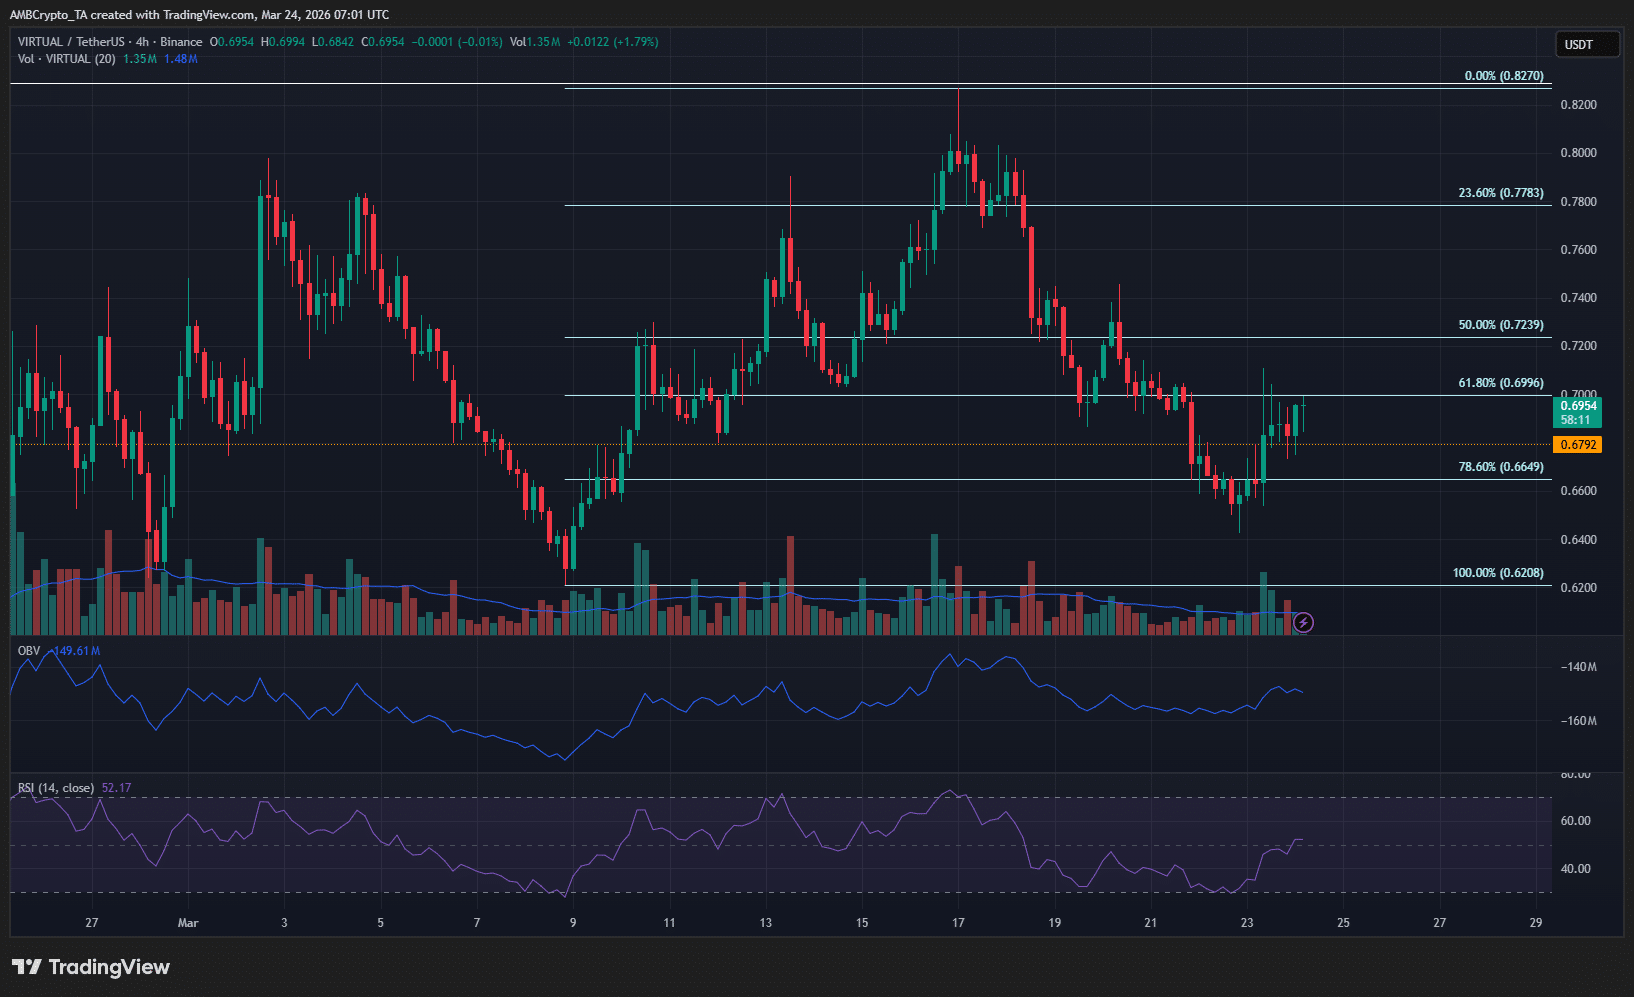
Source: VIRTUAL/USDT on TradingView

The 4-hour timeframe showed that the $0.665 level was the 78.6% retracement (light blue) of the previous impulse move VIRTUAL made, from $0.62 to $0.82. A bullish reaction at this key retracement level confirmed this bias.

Therefore, it is highly likely that Virtuals Protocol token prices would rally toward $0.875-$0.955 levels next. These were the 23.6% and 61.8% extension levels of this timeframe’s swing structure.


Final Summary

  • Virtuals Protocol exhibited a negative Funding Rate and low Open Interest despite its gains in the past 24 hours.
  • The defense of the $0.66-$0.68 zone confirmed bullish strength and VIRTUAL could rally to $0.95-$1.04 in the coming weeks.


Domande pertinenti

QWhat were the key changes in Virtuals Protocol's trading volume and price in the past 24 hours?

AVirtuals Protocol witnessed an 83% boost in daily trading volume and a 3% price gain in the past 24 hours.

QWhat did the Open Interest (OI) and Funding Rate data suggest about market sentiment for VIRTUAL?

AThe Open Interest was only up 1.75%, and the Funding Rate was predominantly negative over the past week, suggesting speculative conviction was weak and market sentiment remained bearish.

QWhich key support level was defended, indicating potential for further gains?

AThe $0.68 local support zone was defended, which indicated that further gains were likely.

QWhat price levels are VIRTUAL expected to rally towards next according to the analysis?

AVIRTUAL is expected to rally toward the $0.875-$0.955 levels next, and potentially reach $0.95-$1.04 in the coming weeks.

QWhy was the recent retracement from $0.82 to $0.64 considered healthy for the bulls?

AThe retracement was considered healthy for the bulls in the short-term as it allowed for a bullish reaction at a key retracement level, confirming strength and setting the stage for a potential rally.

Letture associate

Interview with Robinhood Executive: Meme + Tokenized US Stocks as "Barbell" Customer Acquisition Strategy, All Business Lines Achieve Hundreds of Millions in Revenue

Interview with Robinhood executive Johann Kerbrat reveals the company's "barbell" customer acquisition strategy for its new Robinhood Chain, combining meme tokens with tokenized stocks. Three weeks after mainnet launch, the chain has seen over $3B in weekly DEX volume and 105M transactions. Kerbrat explains the logic behind the permissionless chain: meme tokens attract DeFi users, while tokenized real-world assets (RWA), currently over 90 US stocks and ETFs accessible in 120+ countries, serve global users. The goal is to bring Robinhood's 27 million funded accounts on-chain by simplifying DeFi with a user-friendly interface, exemplified by features like Robinhood Earn which offers yield without requiring wallet management. Built on Arbitrum's technology stack for its speed, low cost, and Ethereum's security, the chain focuses on financial products like Earn, spot trading, and perpetuals. Kerbrat downplays direct competition with platforms like Base, emphasizing the goal of expanding the overall market for on-chain assets. He details selective partnerships (e.g., Morpho, Lighter) based on compliance, unique UX, and differentiation. While regulatory clarity is pending for US perpetuals, the expansion continues via Bitstamp in Europe. Finally, Kerbrat positions Robinhood as a "super app" integrating stocks, options, crypto, banking, and AI trading, with all major business lines generating hundreds of millions in revenue. For the chain, current priority is driving adoption over maximizing gas fee revenue.

marsbit1 h fa

Interview with Robinhood Executive: Meme + Tokenized US Stocks as "Barbell" Customer Acquisition Strategy, All Business Lines Achieve Hundreds of Millions in Revenue

marsbit1 h fa

Fidelity Q3 Report: BTC, ETH, and SOL Continue to Build Bottoms; How Much Further Will This Crypto Bear Market Go?

Fidelity's Q3 Crypto Signal Report analyzes the current bear market, noting Bitcoin (BTC), Ethereum (ETH), and Solana (SOL) are in a prolonged bottoming phase. Key indicators like the weighted Net Unrealized Profit/Loss (NUPL) have turned negative (-0.01), signaling the market is slightly below its aggregate cost basis, with BTC acting as the primary stabilizing asset. BTC's dominance has risen to 68%, indicating a lack of capital rotation to other digital assets. Performance has been weak across the board, with BTC, ETH, and SOL down significantly year-to-date. Market sentiment is depressed, exacerbated by substantial outflows from spot ETPs and a challenging macro environment. The report compares the current ~203-day downtrend to historical ~300-day bottoming cycles, suggesting the process may be two-thirds complete, with late 2026 as a potential timeframe to monitor. For Bitcoin, NUPL at 0.09 indicates cautious sentiment, while momentum signals remain negative. The Yardstick metric points to potential undervaluation relative to network security (hashrate). Ethereum's NUPL is deep in the "capitulation" zone at -0.43, a historically positive signal for future returns, though its momentum and network fee revenue are negative. Solana shows the deepest NUPL at -0.72 but demonstrates relative resilience in on-chain activity and stablecoin transfer volume. The report concludes that while several metrics are near historical capitulation levels, a definitive market bottom has not yet been established. The path forward likely involves continued consolidation, with BTC's relative strength and fundamental on-chain usage for ETH and SOL providing key areas for investor observation.

marsbit1 h fa

Fidelity Q3 Report: BTC, ETH, and SOL Continue to Build Bottoms; How Much Further Will This Crypto Bear Market Go?

marsbit1 h fa

Trading

Spot
活动图片