Bullish Divergences On Ethereum Chart, What’s Incoming?

newsbtcPubblicato 2022-12-13Pubblicato ultima volta 2022-12-13

Introduzione

The Ethereum price is trading laterally on its daily chart. The coin has moved south by 1.8% in that timeframe. Both the bulls and bears are trying to take over...

The Ethereum price is trading laterally on its daily chart. The coin has moved south by 1.8% in that timeframe. Both the bulls and bears are trying to take over the market as the altcoin remains within a congested price zone. If the altcoin price is rejected at higher levels, the chance of a reversal might increase.
This would mean that bulls represented an upper hand. Moving sideways, however, will bring the asset close to its local support line of $1,220. The current technical outlook indicates that the bulls have not exited the market. If the bulls remain in the market, a breakout above the $1,300 price mark can be predicted.
In the event of continued consolidation, the chance of a move upward cannot be completely ruled out. The significant recovery often allows the traders to replenish their losses before the altcoin starts to trade southward.
Traders might be presented with an opportunity to enter the market at $1,220 before ETH attempts to revisit the $1,300 price. Ethereum is trading at a price nearly 74% below its all-time high secured in 2021.
Ethereum Price Analysis: One-Day Chart
Ethereum Price

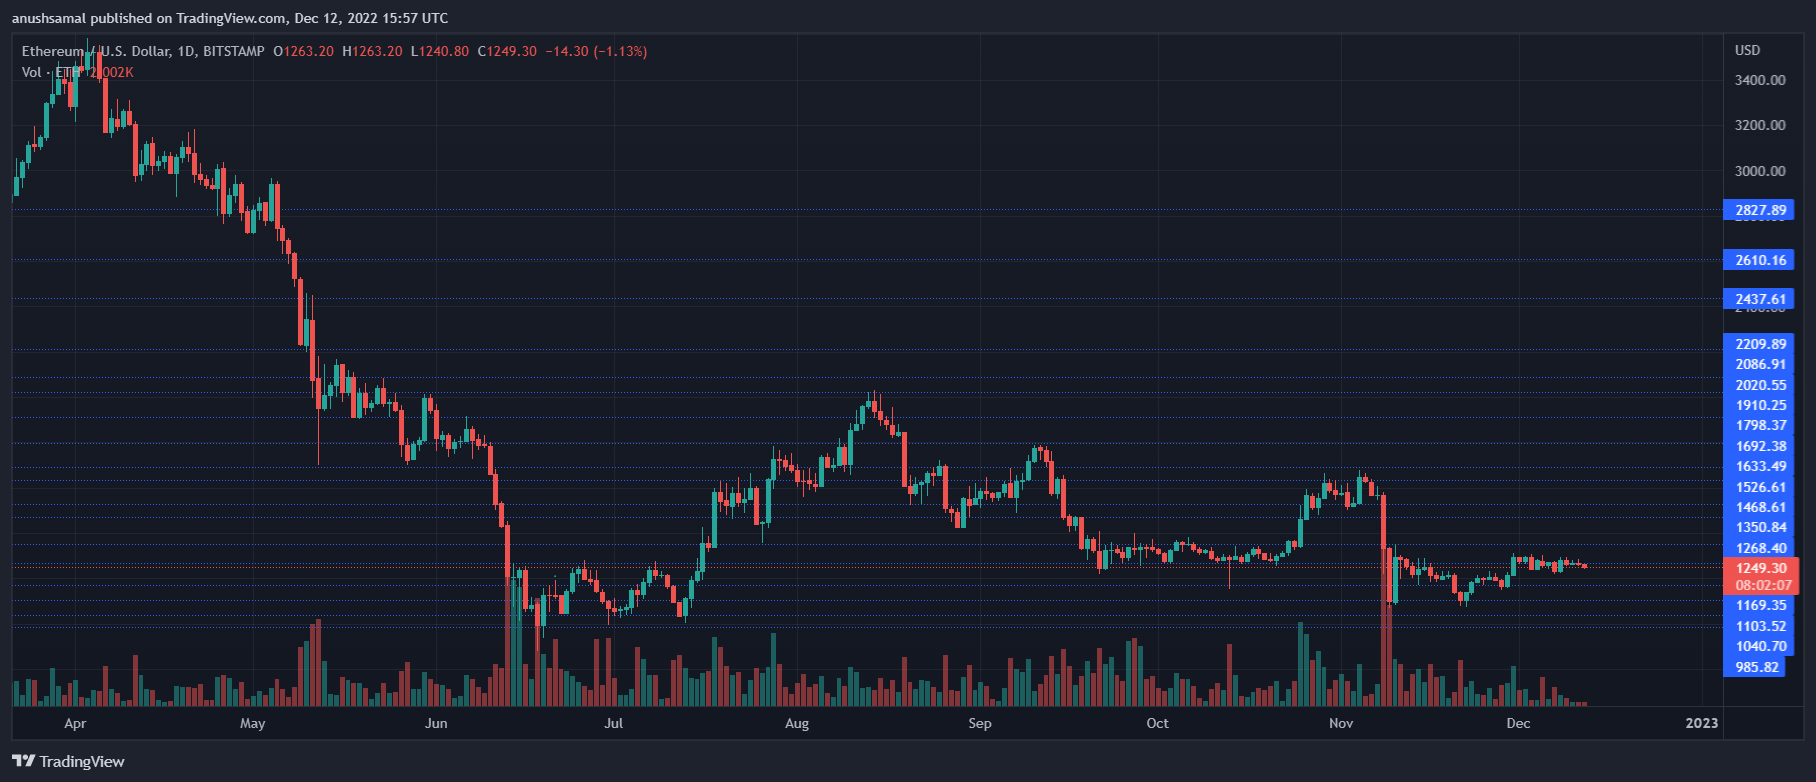
Ethereum was priced at $1,251 on the one-day chart | Source: ETHUSD on TradingView ETH was exchanging hands at $1,251 at the time of writing. The coin has been swaying between the $1,220 and $1,300 marks. However, indicators have continued to side with the bulls as buyers have shown interest in the asset.
Overhead resistance for the Ethereum price was at $1,260. After breaking through that barrier, the coin will face a new one at $1,300. On the flip side, falling from the $1,251 level will drag the altcoin to $1,200 and then to $1,170. The amount of ETH traded in the last session declined slightly, indicating some loss in buying strength.
Technical Analysis
Ethereum

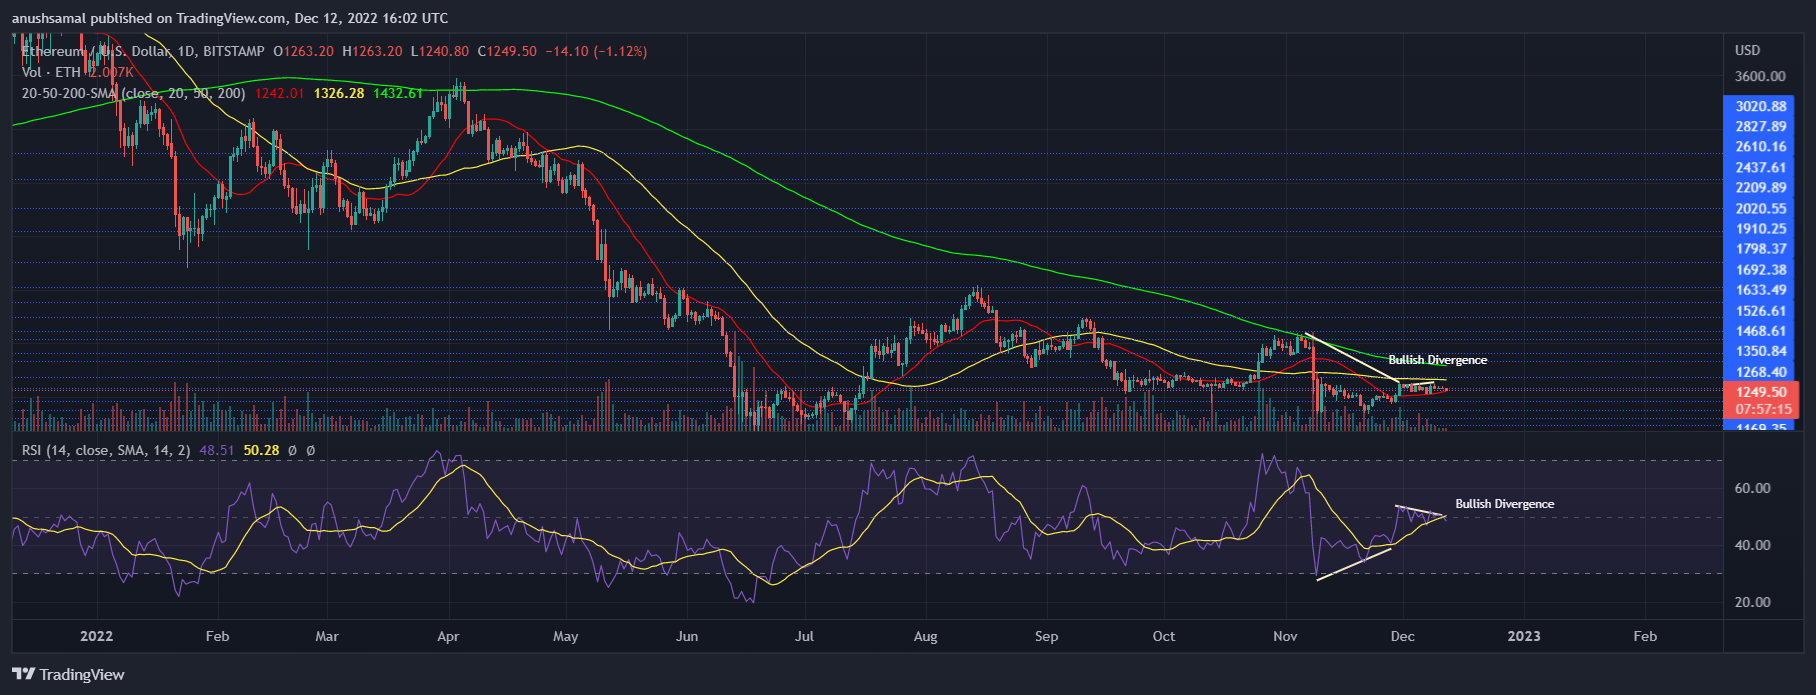
Ethereum registered a fall in buyers on the one-day chart | Source: ETHUSD on TradingView The chance of Ethereum registering an uptick increases owing to the several bullish divergences on the chart. Bullish divergences are tied to the coin picking up momentum. The Relative Strength Index also spotted a bullish divergence, indicating that buying strength could get stronger.
The RSI was just above the half-line, meaning buyers were more than sellers on the chart. The Ethereum price was spotted slightly above the 20-Simple Moving Average Line. This denoted that buyers were still in charge of driving the price momentum in the market.
Ethereum

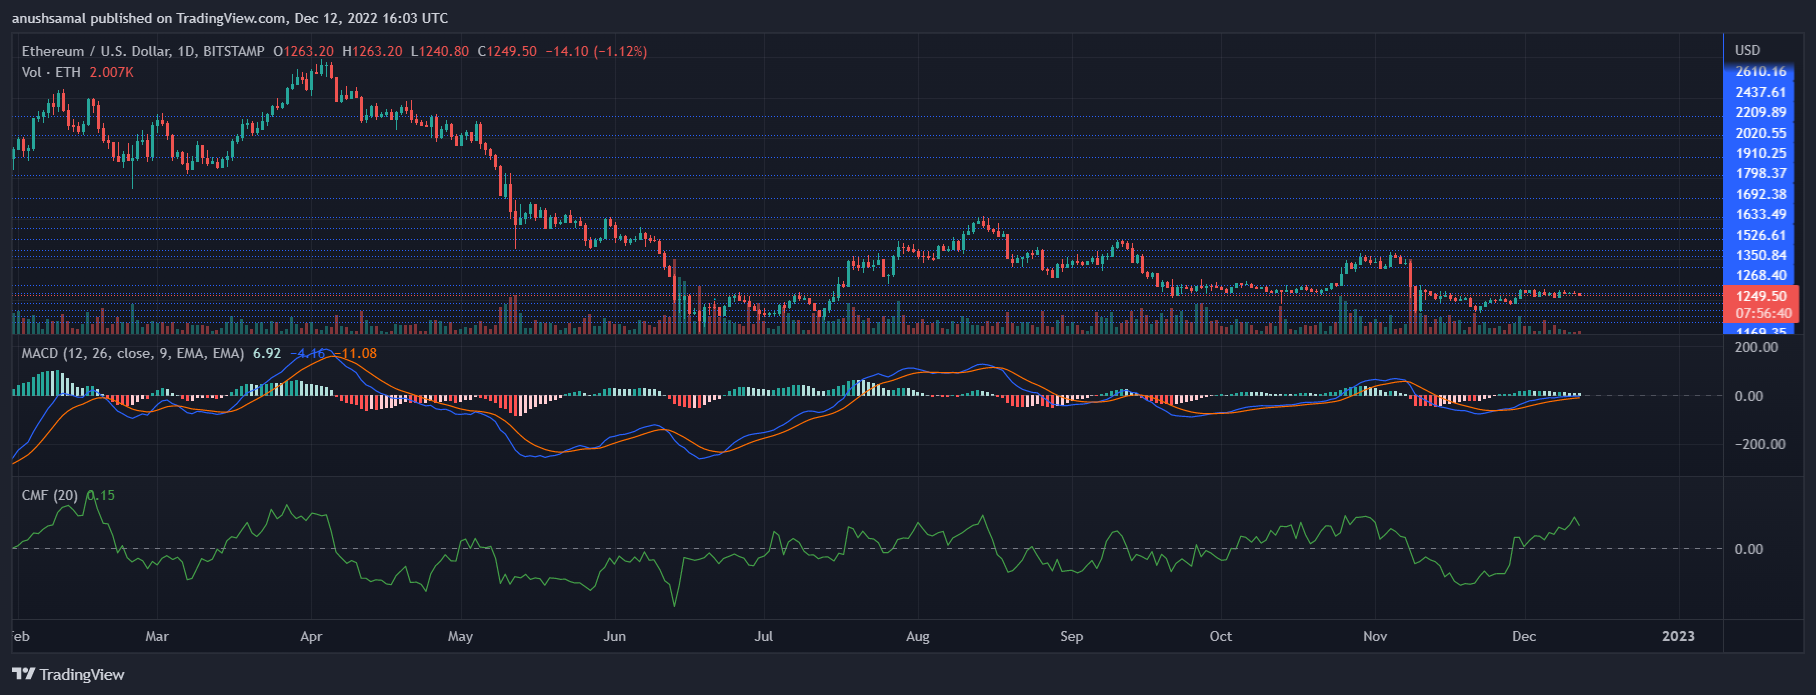
Ethereum displayed a buy signal on the one-day chart | Source: ETHUSD on TradingView Other technical indicators for the altcoin continued to exhibit buying strength. The Moving Average Convergence Divergence portrays that price momentum continued to form green signal bars.
The green histograms were the buy signal for the coin, which could further mean an entry point for traders. The Chaikin Money Flow (CMF) indicates investor interest by capturing capital inflows and outflows. CMF was positive as it was above the half-line, meaning capital inflows exceeded outflows.


Letture associate

US Government Lifts Ban on Crypto Perpetual Contracts for the First Time: What Does It Mean for the Market?

The U.S. Commodity Futures Trading Commission (CFTC) has issued guidance permitting 24/7 trading and clearing for crypto asset derivatives, effectively opening the U.S. market to crypto perpetual contracts for the first time. This move ends the previous ban and allows American individuals and institutions to trade these instruments around the clock. Direct beneficiaries include Kalshi, which received approval to list a Bitcoin perpetual contract; Coinbase, now the first CFTC-regulated futures commission merchant for U.S. clients to access global crypto derivatives; and CME, which will transition its Bitcoin futures and options to 24/7 trading. The CFTC emphasized this is a specific allowance for crypto assets, noting that traditional commodities like agriculture may not be suitable for non-stop trading. It also requires platforms to undergo case-by-case reviews for compliance and risk management. Industry leaders like Michael Saylor and Brian Armstrong praised the decision for integrating Bitcoin into capital markets and granting U.S. users access to a major global market segment. However, consumer advocacy group Better Markets criticized the CFTC for allegedly neglecting investor protection and favoring the industry it regulates. Other platforms like Kraken have announced plans to launch regulated perpetual futures for the U.S. market. The policy shift is expected to redirect significant liquidity and institutional participation to the newly accessible U.S. crypto derivatives landscape.

Odaily星球日报6 h fa

US Government Lifts Ban on Crypto Perpetual Contracts for the First Time: What Does It Mean for the Market?

Odaily星球日报6 h fa

How the CLARITY Act Reshapes the Stablecoin Yield Economy

The CLARITY Act, recently advanced by the U.S. Senate Banking Committee, fundamentally reshapes the stablecoin yield economy by closing loopholes left by the earlier GENIUS Act. Its Section 404 expands the ban on "hold-to-earn" rewards to all Digital Asset Service Providers (DASPs) and their affiliates, prohibiting any passive, interest-like yield. Crucially, it introduces a legal distinction, permitting "use-to-earn" rewards based on actual activities like spending, trading, or staking. In anticipation of this regulatory shift, major Wall Street asset managers—Morgan Stanley, BlackRock, and JPMorgan—have launched a series of tokenized money market funds (e.g., BlackRock's BRSRV, JPMorgan's JLTXX) designed explicitly for stablecoin reserve assets. These products represent a new, compliant yield layer: the stablecoin issuer earns interest from the underlying tokenized fund, which can then be passed to users through redesigned activity-based rewards. This marks a paradigm shift from a "hold-to-earn" to a "use-to-earn" market. While pathways remain for exchanges to redesign rewards (Path A) and for DeFi protocols to offer yield (Path B), the tokenized reserve asset layer (Path C) emerges as the most robust and strategically positioned infrastructure. However, this concentration—exemplified by BlackRock's BUIDL fund backing over 90% of USDtb's reserves—introduces new systemic risks. The final outcome hinges on regulatory decisions, particularly the OCC's proposed 20% cap on tokenized assets in reserves, which will determine the scalability of this new financial infrastructure layer.

marsbit8 h fa

How the CLARITY Act Reshapes the Stablecoin Yield Economy

marsbit8 h fa

Trading

Spot
Futures
活动图片