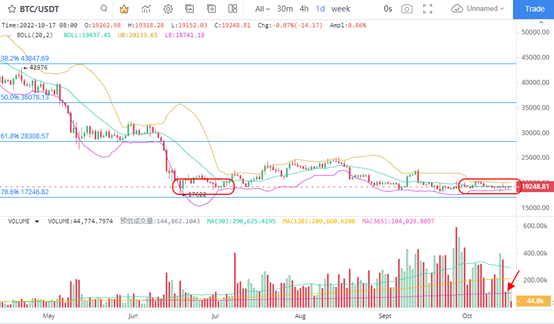
1. BTC is still at an absolute low
The daily K line chart of BTC shows that BTC has been at an absolute low from the perspective of closing price. In addition, although the volatility has continued to decline recently, the break of the low price has never occurred. In terms of trading volume, BTC's recent trading volume has hit a low point in three consecutive months. At present, it is the second time that the market has reached a low level, so the market is highly likely to change at this time.
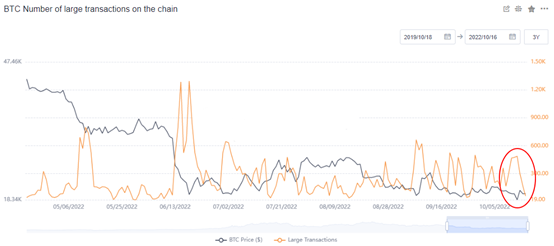
2. BTC large transactions fall back
In the short term, the heat of major transactions has cooled again, and the number of large transactions per day has dropped from 488 to 60. At the same time, the number of BTCs traded in large amount per day also decreased from 244000 BTCs to 29280 BTCs, a decline of 87.7%. The cooling of the main trading heat means that the market performance is more sluggish in the short term. After the number of large transactions fell back, it means that the recent upswing of transaction heat since September 5 has shown signs of ending.
On the news side, although the Federal Reserve has raised interest rates sharply for many times in a row, the US CPI data remains firm, inflation expectations rebound again, releasing a "unfriendly" signal. The Fed is expected to raise interest rates to a high point close to 5% (previously predicted to be 4~4.5%), which may be the "last effort" of the Fed to fight inflation. This also means that the pace of interest rate increase by the Federal Reserve may not slow down in the fourth quarter. In the short term, BTC is more likely to show a technical rebound than a price reversal. Before the Federal Reserve further raises interest rates and the dollar index further strengthens, BTC has more opportunities to rebound.
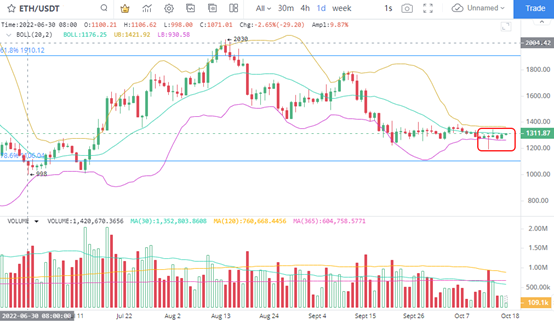
3. ETH represents an upward breakthrough
In terms of the daily K line, the intensity of ETH price fluctuation remains low, but the closing price has shown signs of recovery. Especially after the bottom of ETH hit $1190 on October 13, ETH closed up 2.43% on October 16, indicating that the market was in a moderate and strong state. Although the trading volume is not high, the recent short-term trend of ETH deserves attention. Because the price volatility can no longer be retreated, we can pay attention to the low suction signal in the rebound phase.
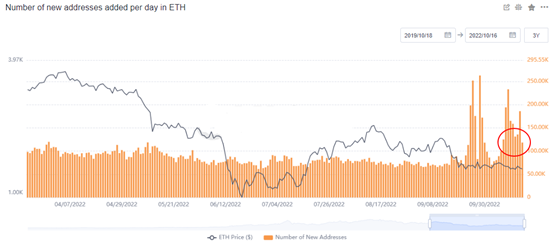
4. The number of new ETH addresses remains high
The number of new addresses in ETH is maintained at a high level, which is significantly higher than the average level since 2022. The growth of the number of new addresses started on September 16, which is now the second amplification of this indicator. Therefore, ETH's price strength will be maintained in the short term. In terms of price, ETH has little room for fluctuation in the near future, but the number of newly added addresses has remained active in the near future, indicating that the receiver is willing to enter the market at the current point, which also provides a respite for the rebound. In terms of pressure level, focus on the possible selling of $1400. On the news side, we continued to pay attention to the negative impact of the Federal Reserve's interest rate hike on the market.
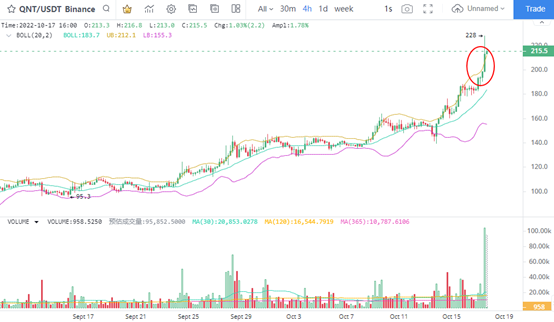
5. QNT is steadily rising
QNT has maintained the upward rhythm of prices recently. Although the current price rise shows signs of acceleration, the volatility and trading volume are significantly higher than expected. It is judged that the price recovery of QNT may continue. The trading volume of QNT in 4 hours will be more than 6 times larger when the amplitude of the short line after the 4-hour K line drawing reaches 15%. At this point, QNT is near $220 in the short term, which is still far from the historical high of $430. Since the trend of QNT is stable, and the main force with the largest number of coins increased its holdings of QNT on the 7th, it means that the price may still perform more strongly at a high level.