$70,000 and a Record Short Squeeze: The Start of a New Bitcoin Bull Cycle or a Bull Trap?

cryptonews.ruPubblicato 2026-08-20Pubblicato ultima volta 2026-08-20

Introduzione

Bitcoin surged past $70,000 on August 20, marking a 9% gain in 24 hours. Analysts note this triggered a historic short squeeze, forcing bearish traders to cover positions. The breakout above the key $66,000 resistance level is seen by many, including Crypto Candy and Michaël van de Poppe, as a shift to a bullish market structure, with targets set at $70,700, $75,000, and $73,600, provided support holds above $65,000. Daan Crypto Trades highlights a bullish engulfing weekly candle, suggesting a potential major trend reversal if the week closes above the 200-day EMA and a key bull market support band. However, trader Roman urges caution, pointing to low trading volume and a potential bearish divergence on weekly charts, which could indicate a retest of recent lows before a sustained uptrend. An AI-driven historical analysis draws parallels to a similar short squeeze in summer 2021, warning that such sharp rallies after consolidation can be temporary, often followed by a retest of previous support levels rather than an immediate, sustained bull market. The overall sentiment is cautiously optimistic but acknowledges the possibility of further volatility.

Bitcoin surpassed the $70,000 mark on August 20, with the asset's growth exceeding 9% over 24 hours. According to crypto YouTuber Crypto Rover, this event can be called the largest short squeeze in market history—traders who bet on a decline were forced to close their positions amid a sharp price increase.
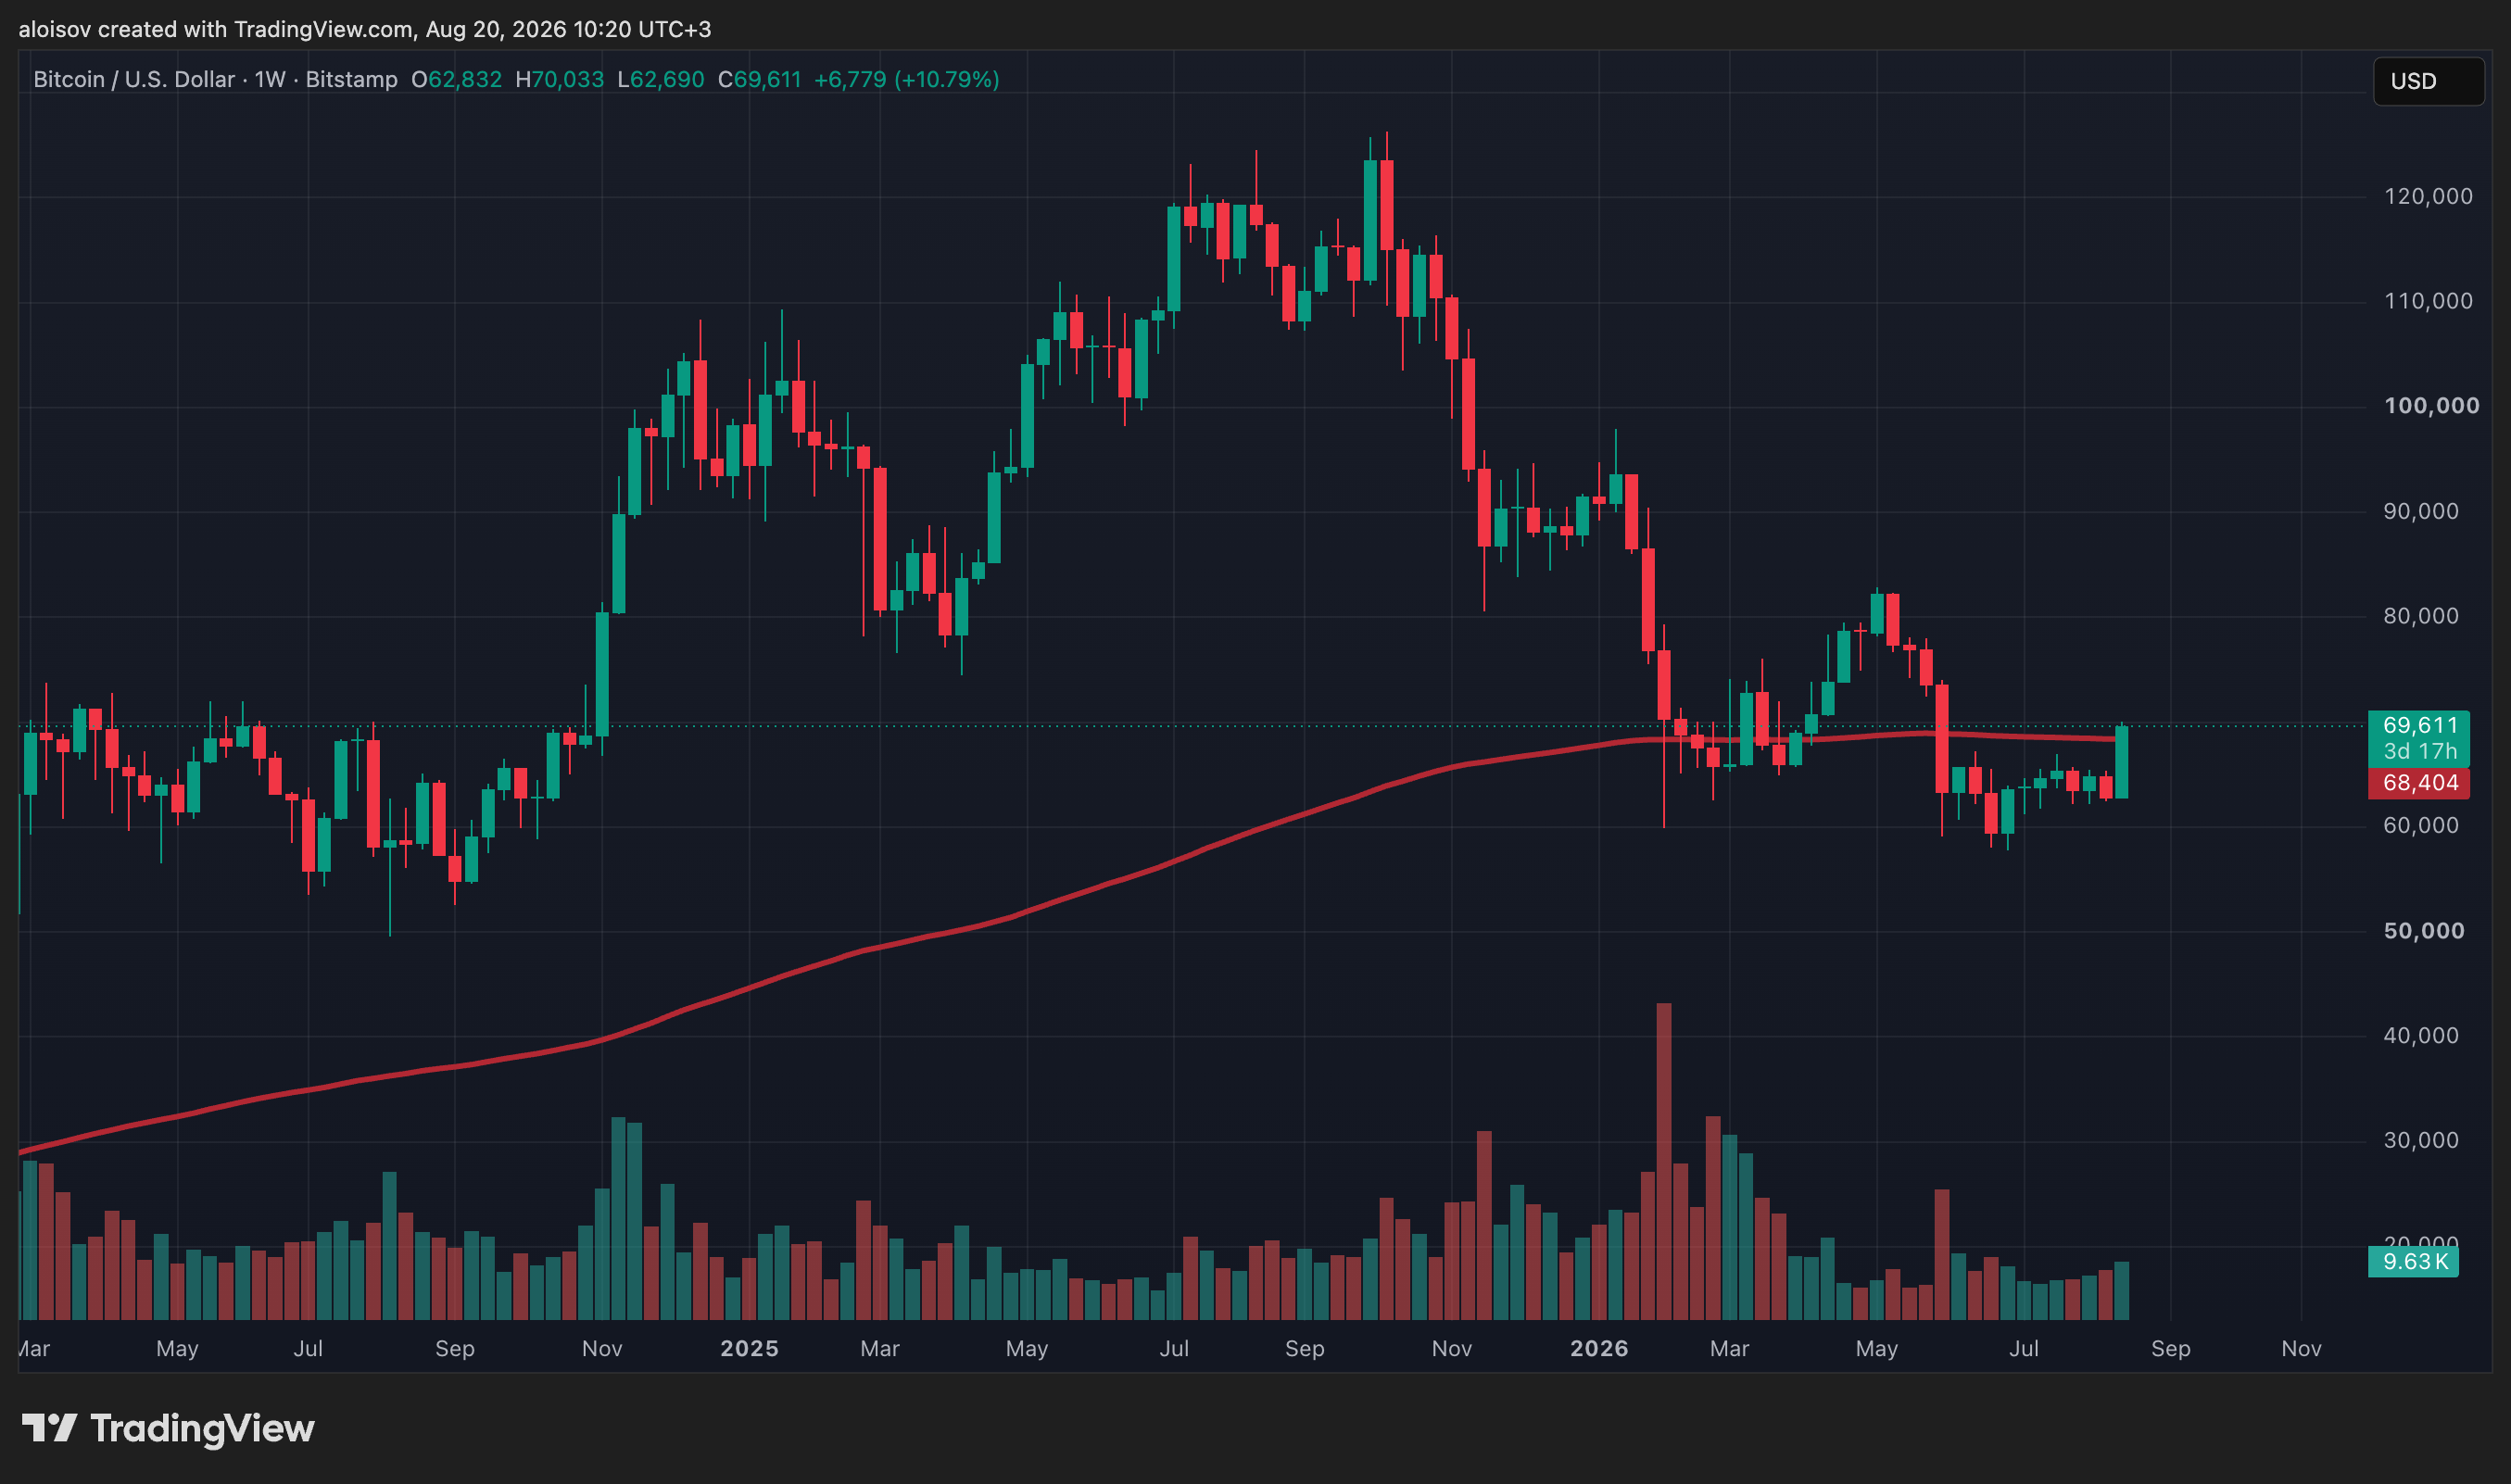
1-week chart of $BTC/USD and 200EMA. Source: Bitstamp

Breakout of Key Resistance

Analyst and trader Crypto Candy notes that after a prolonged consolidation, Bitcoin overcame all bearish barriers and closed above the previously marked resistance level of $66,000. According to her, the asset remained in a bearish zone as long as it stayed below this mark, but now the situation has changed: market sentiment has turned bullish. A short-term correction is not ruled out, but the overall scenario suggests a move first to $70,700, and then to $75,000. This forecast remains valid as long as the price stays above $65,000.
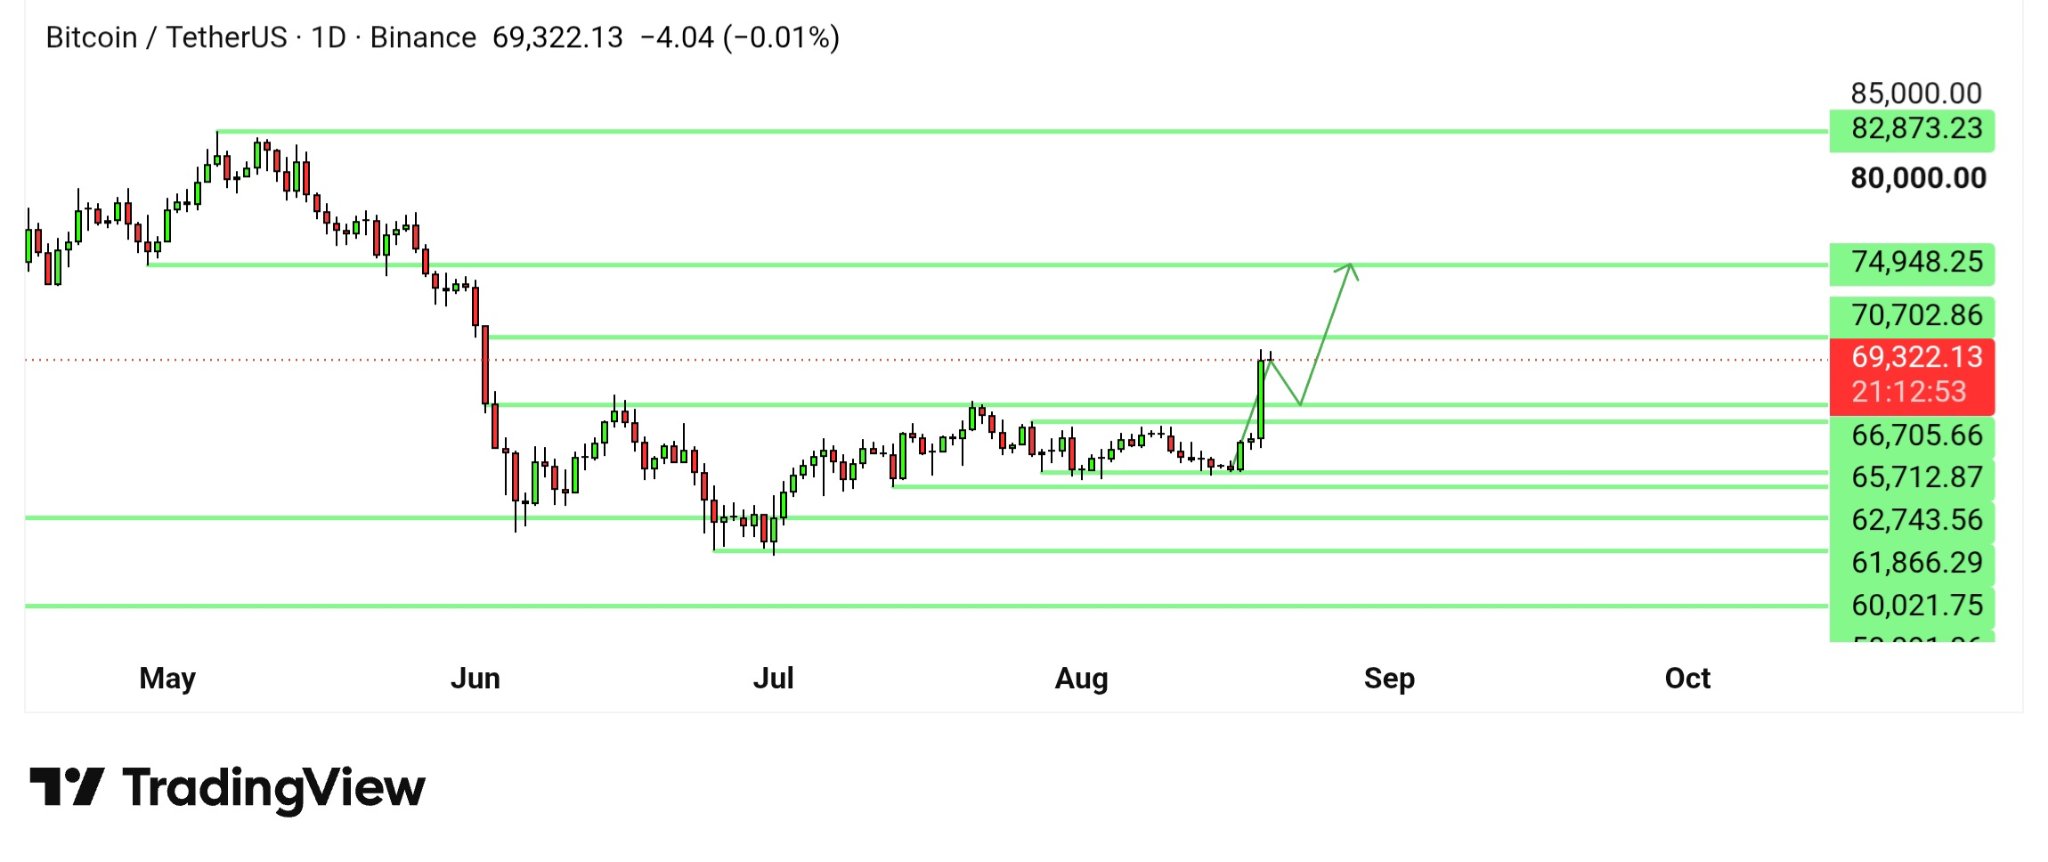
1-day chart of $BTC/USD. Analysis: Crypto Candy

A similar view is held by crypto trader, analyst, and entrepreneur Michaël van de Poppe. He points out that the higher the market rises, the more likely it is that the bottom of the bear cycle has already been formed. Bitcoin has exited the range and transitioned into an uptrend, therefore, in his opinion, attention should be paid to pullbacks on lower timeframes as points for opening long positions, and he names the $73,600 level as the next target on higher timeframes.
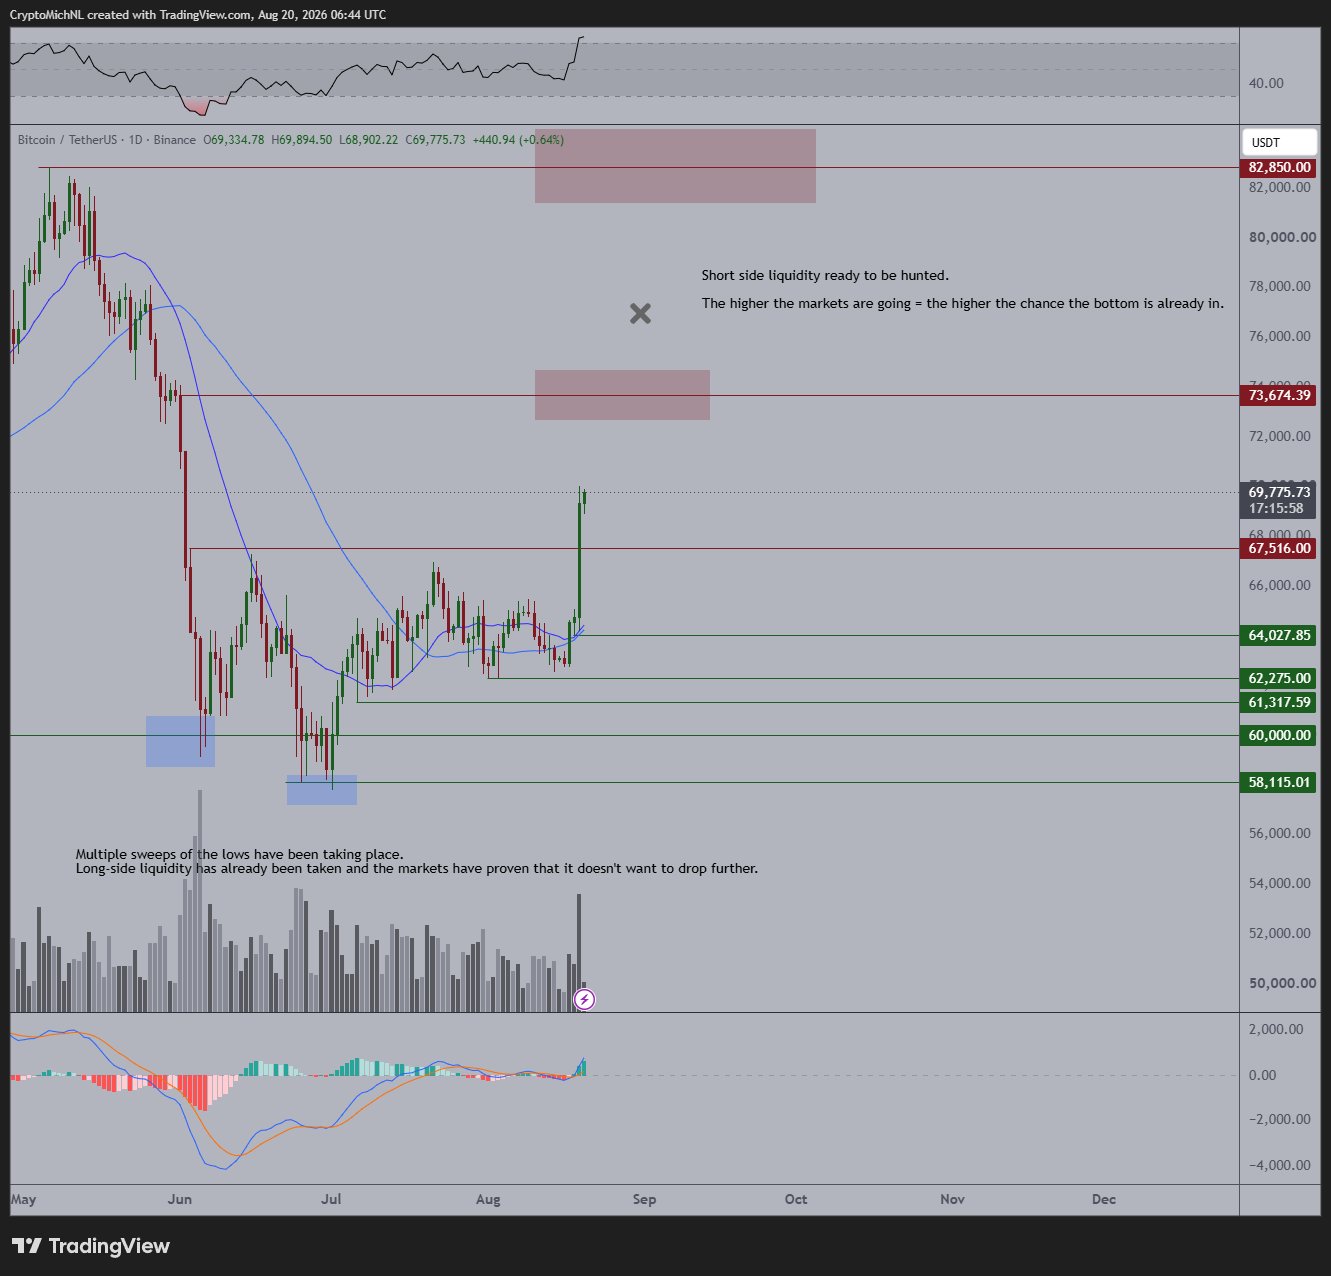
1-day chart of $BTC/USD. Analysis: Michaël van de Poppe

Confirmation of Reversal on Weekly Chart

Trader Daan Crypto Trades draws attention to the formation of a bullish engulfing weekly candlestick for Bitcoin. He names the 200-day exponential moving average on the weekly chart and the bull market support band, located just above the current price, as the next significant levels. In his opinion, a weekly close above these levels will confirm a full-fledged trend reversal on the higher timeframe.
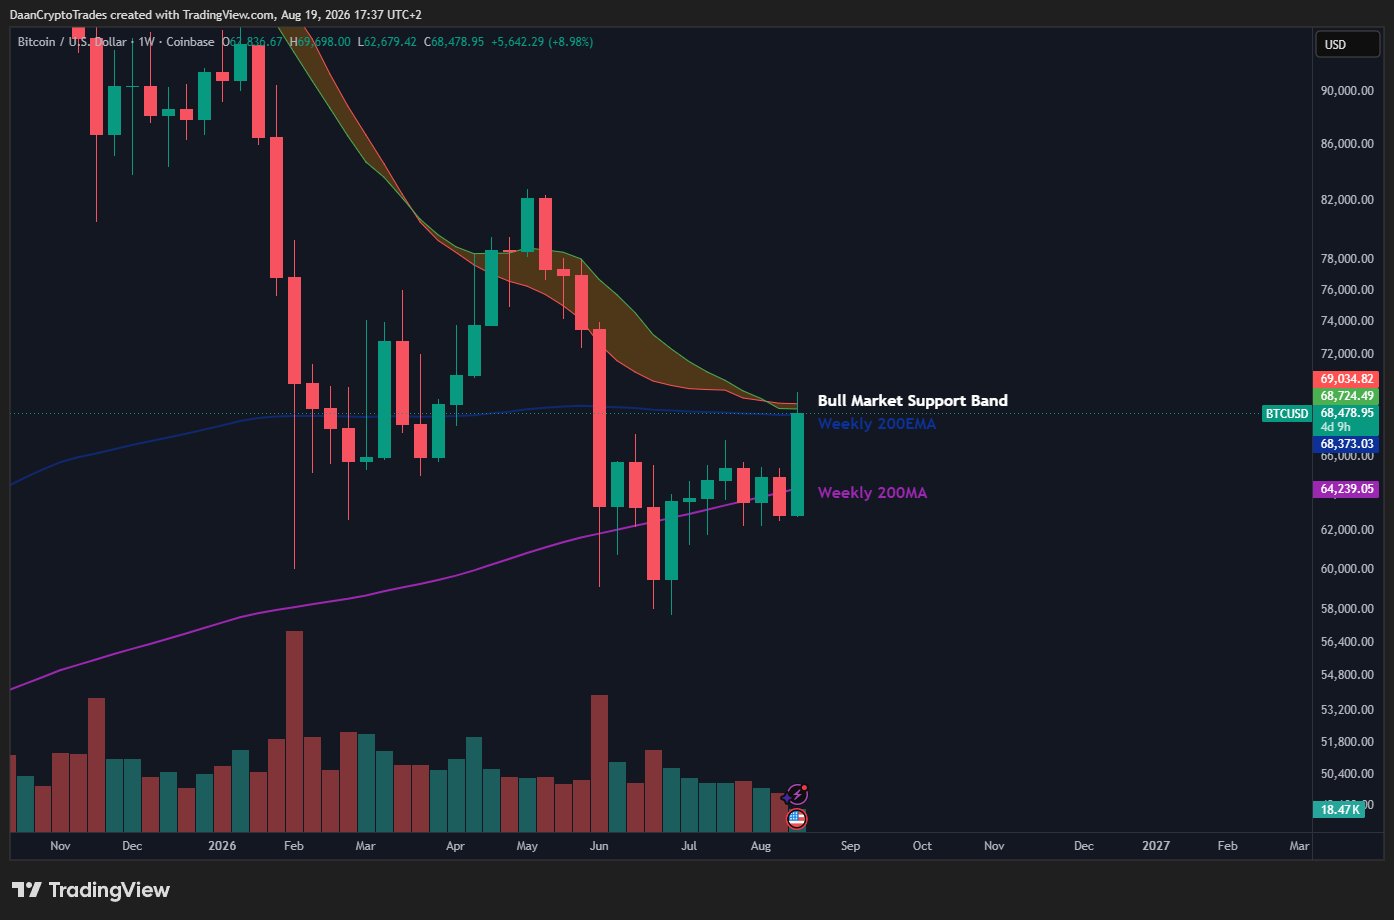
1-week chart of $BTC/USD. Analysis: Daan Crypto Trades

A more cautious position is taken by trader Roman. He admits he would like to see confirmation of a formed bottom for Bitcoin but draws attention to an important detail: the price increase on the weekly chart is accompanied by low trading volume and the potential formation of a bearish divergence. According to him, this does not rule out the possibility that the cycle minimum has already been passed, but it allows for a scenario where the market will renew the local minimum once more before finally turning upward.
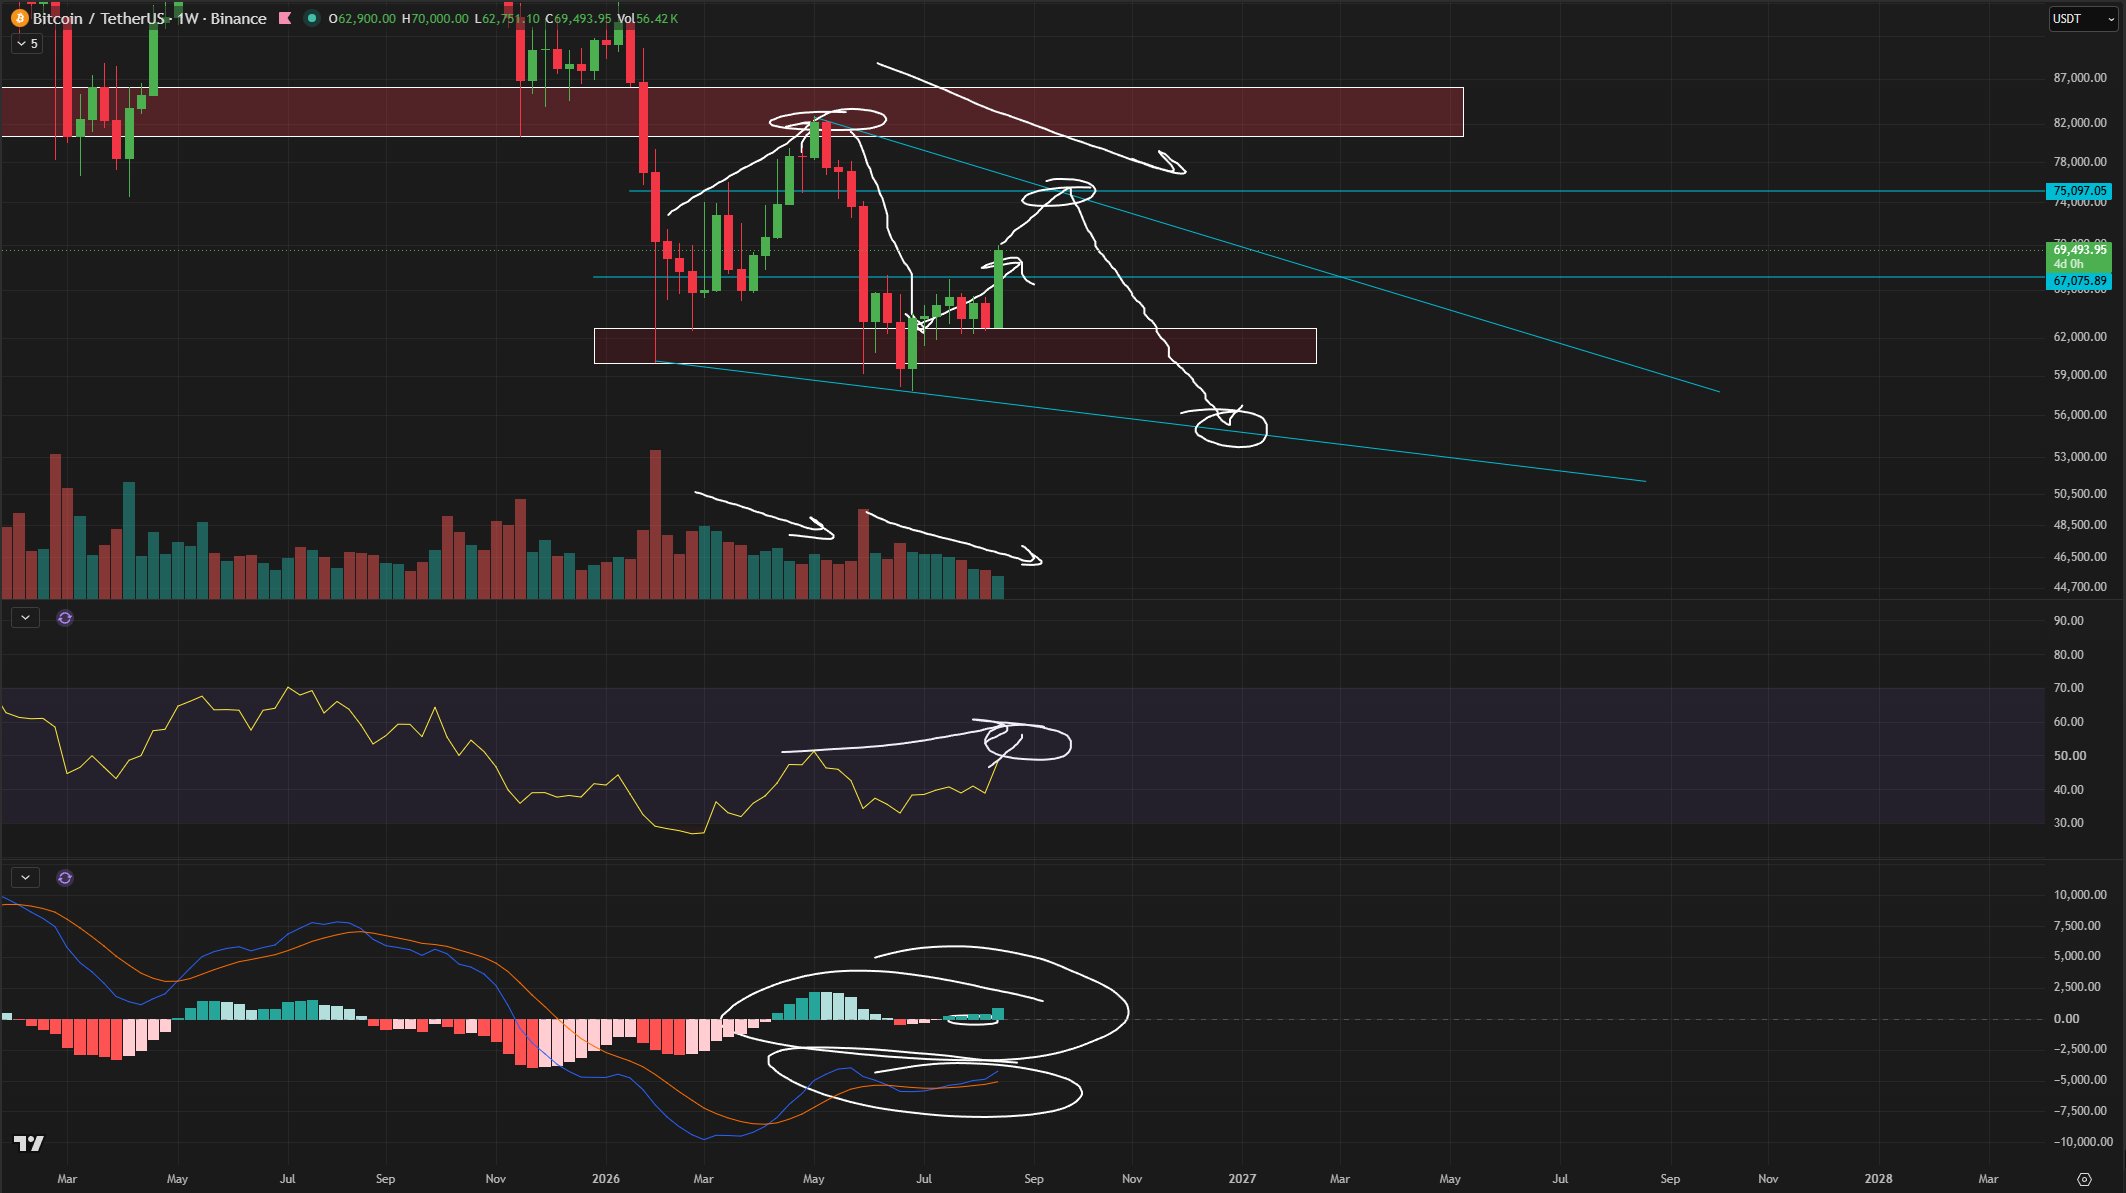
1-week chart of $BTC/USD. Analysis: Roman

AI Opinion

From the perspective of machine data analysis, the current rise of Bitcoin to $70,000 repeats the structure of events from five years ago. In the summer of 2021, the asset already experienced a similar short squeeze: then, the sum of short position liquidations exceeded $1 billion in one day, and the price bounced back almost 20% in a matter of hours. The parallel shows that sharp movements after prolonged consolidation often turn out to be short-term impulses rather than a sustainable trend reversal—the market often returns to testing previous lows after such surges.

end-content

Domande pertinenti

QAccording to the article, what key resistance level did Bitcoin break above, and what is the significance of this event?

ABitcoin broke above the key resistance level of $66,000. The significance, as noted by analyst Crypto Candy, is that the asset was previously in a bearish zone while trading below this level, but the breakout has now shifted market sentiment to bullish.

QWhat is the main concern raised by trader Roman regarding the current Bitcoin price rise?

ATrader Roman's main concern is that the price rise on the weekly chart is accompanied by low trading volume and the potential formation of a bearish divergence. This suggests the possibility that the market might retest the recent low again before a definitive upward reversal.

QWhat historical event does the AI analysis compare the current Bitcoin surge to, and what key parallel does it draw?

AThe AI analysis compares the current surge to a similar short squeeze event in the summer of 2021. It draws a parallel that sharp moves after prolonged consolidation are often short-lived impulses rather than sustainable trend reversals, and the market frequently retests previous lows after such spikes.

QWhat price target does analyst Crypto Candy set for Bitcoin in the near term, and what is the key condition for this scenario to remain valid?

AAnalyst Crypto Candy sets near-term price targets of $70,700 and then $75,000 for Bitcoin. The key condition for this bullish scenario to remain valid is for the price to hold above $65,000.

QWhat specific confirmation does trader Daan Crypto Trades say is needed to confirm a full-fledged trend reversal on the higher timeframe?

ATrader Daan Crypto Trades states that a weekly close above the 200-day exponential moving average (EMA) on the weekly chart and the bull market support band is needed to confirm a full-fledged trend reversal on the higher timeframe.

Letture associate

Bernstein Research Report Analysis: Circle Benefits from USDC Expansion Cycle, Maintains Outperform Rating with $140 Price Target

Bernstein Report Analysis: Circle Benefits from USDC Expansion Cycle, Maintains Outperform Rating with $140 Target Stablecoin markets are reversing. After nearly six months of stagnation and decline, the supply of USDC suddenly increased by $1.7 billion in the final week of August. Circle's stock price has rebounded 42% from its slump driven by concerns over OUSD competition. On August 24, Bernstein published a report stating this is not a temporary technical rebound. Four key factors are driving a new stablecoin expansion cycle: the macro interest rate environment, expansion of the on-chain capital market, proliferation of stablecoin payments, and the emerging use of AI agent payments. Circle, as the largest compliant stablecoin issuer, is positioned to benefit significantly. Bernstein maintains its "Outperform" rating for Circle with a $140 price target, implying a 59% upside from the current price. The recovery in USDC supply validates the macro logic. The US Treasury's long-end bond buyback plan is reshaping the macro narrative for stablecoins, with stablecoins absorbing incremental short-term Treasury supply. Both Bitcoin and stablecoins benefit from this macro shift. AI agent payments represent a new growth frontier. Stablecoin payments are extending from "person-to-person" to "machine-to-machine." Bernstein highlights the x402 payment protocol, designed for AI agents to autonomously hold wallets, discover services, and make instant micropayments using USDC. While current volumes are small, this signals stablecoins' evolution towards becoming a native currency for the digital economy. USDC accounts for over 99% of x402 transaction volume. Circle benefits from two structural trends. First, the expansion of the on-chain capital market: its ARC blockchain, with validators like BlackRock and DTCC, supports asset tokenization. USDC has also been used as collateral for regulated derivatives. Second, the continued adoption of stablecoin payments: USDC's share of adjusted transaction volume has risen from ~40% in 2025 to over 60% year-to-date in 2026. Bernstein's $140 valuation is based on a long-term discounted cash flow model, corresponding to ~23x 2028 adjusted EBITDA. Key risks include digital asset volatility, increased competition, and Circle's reliance on interest income for 99% of its revenue. The stablecoin expansion is a structural story, and Circle sits at the confluence of these driving trends.

marsbit4 min fa

Bernstein Research Report Analysis: Circle Benefits from USDC Expansion Cycle, Maintains Outperform Rating with $140 Price Target

marsbit4 min fa

A New Project in the ZEC Space: Vitalik's Only Coin Purchase in Two Years

Amidst the bullish market, Ethereum co-founder Vitalik Buterin made his first significant public investment in a new project token in nearly two years. In the first public CCA auction for The Interfold on Uniswap, he invested 16 ETH (approx. $28,000). Following its TGE on August 19th, $FOLD's price surged over 7x, driven largely by the "Vitalik bought it" narrative before a listing on Upbit caused another spike. The price has since settled back to a range primarily supported by this narrative. The Interfold is a privacy-focused project by Gnosis Guild, a protocol enabling multiple untrusting parties to perform verifiable computations without exposing private inputs. While technically complex compared to simpler privacy assets like ZEC, the project has gained significant attention due to Vitalik's public endorsement, repeated mentions at events, and his committed, unsold investment. Analysts view $FOLD optimistically. Unlike his previous investment in Truemarkets' $TRUE, which never listed on major exchanges, $FOLD quickly listed on Upbit, boasts a ~$27M circulating market cap (~$100M FDV), and benefits from a strong ETH and overall market sentiment. The primary investment thesis revolves around attention-driven factors—Vitalik's backing and market liquidity—rather than its complex underlying technology. However, at its current valuation, some question whether the risk/reward remains attractive compared to other chains with strong momentum.

marsbit5 min fa

A New Project in the ZEC Space: Vitalik's Only Coin Purchase in Two Years

marsbit5 min fa

Trading

Spot
活动图片