With Two Consecutive Quarters of Losses, Coinbase Must Rely on Paths Beyond Trading

marsbitPubblicato 2026-07-31Pubblicato ultima volta 2026-07-31

Introduzione

Coinbase posted its second consecutive quarterly net loss of $359 million on $1.22 billion in revenue for Q2, highlighting its vulnerability to crypto market cycles where weaker prices and lower volatility reduce user trading. However, the report also reveals a strategic shift in its business model. Despite a 25% quarter-over-quarter decline in global spot trading volume, Coinbase increased its market share to a company-record 10.3%. This suggests its position as a compliant U.S. on-ramp is strengthening even in a cooler market. A key development is the diversification of revenue streams. Transaction revenue fell to $599 million, nearly equaling subscription and services revenue of $555 million. Stablecoin services, generating $292 million, are becoming a crucial revenue "floor." This income, derived from interest on the $20 billion average USDC balance held on its platform, is less tied to daily trading activity. Furthermore, while spot trading volume dropped significantly, derivatives volume held steady at $1.03 trillion. Coinbase is pushing to integrate spot, stablecoin, and derivatives liquidity to create a more interconnected and sticky ecosystem for users. The GAAP net loss includes non-cash expenses like stock-based compensation and crypto asset valuation changes. Its adjusted EBITDA remained positive at $208 million for the 14th straight quarter, indicating core operations can cover ongoing costs. The company is also reducing expenses to manage the downturn. The ...

U.S. crypto trading platform Coinbase delivered an earnings report that's easy to misinterpret. In the second quarter, total revenue fell to $1.22 billion, with a GAAP net loss of $359 million. According to the earnings report supplement Coinbase filed with the U.S. Securities and Exchange Commission on July 30th, this marks the company's second consecutive quarter of net losses.

Looking solely at the income statement, the story seems familiar—the crypto cycle. Weak coin prices, declining volatility, reduced user trading, and consequently shrinking exchange revenue. But there's another narrative in this report. According to Coinbase's disclosure, its share of the crypto trading volume market rose to 10.3%, setting a new company-record high. In a receding quarter, it captured more traffic.

Coinbase's cyclicality hasn't disappeared; it's just that it no longer completely mirrors the cyclicality of spot trading. Market share, stablecoins, and derivatives are now splitting the company's revenue and liquidity sources into several distinct streams.

Why Does the Platform Grow Stronger as the Market Cools Down?
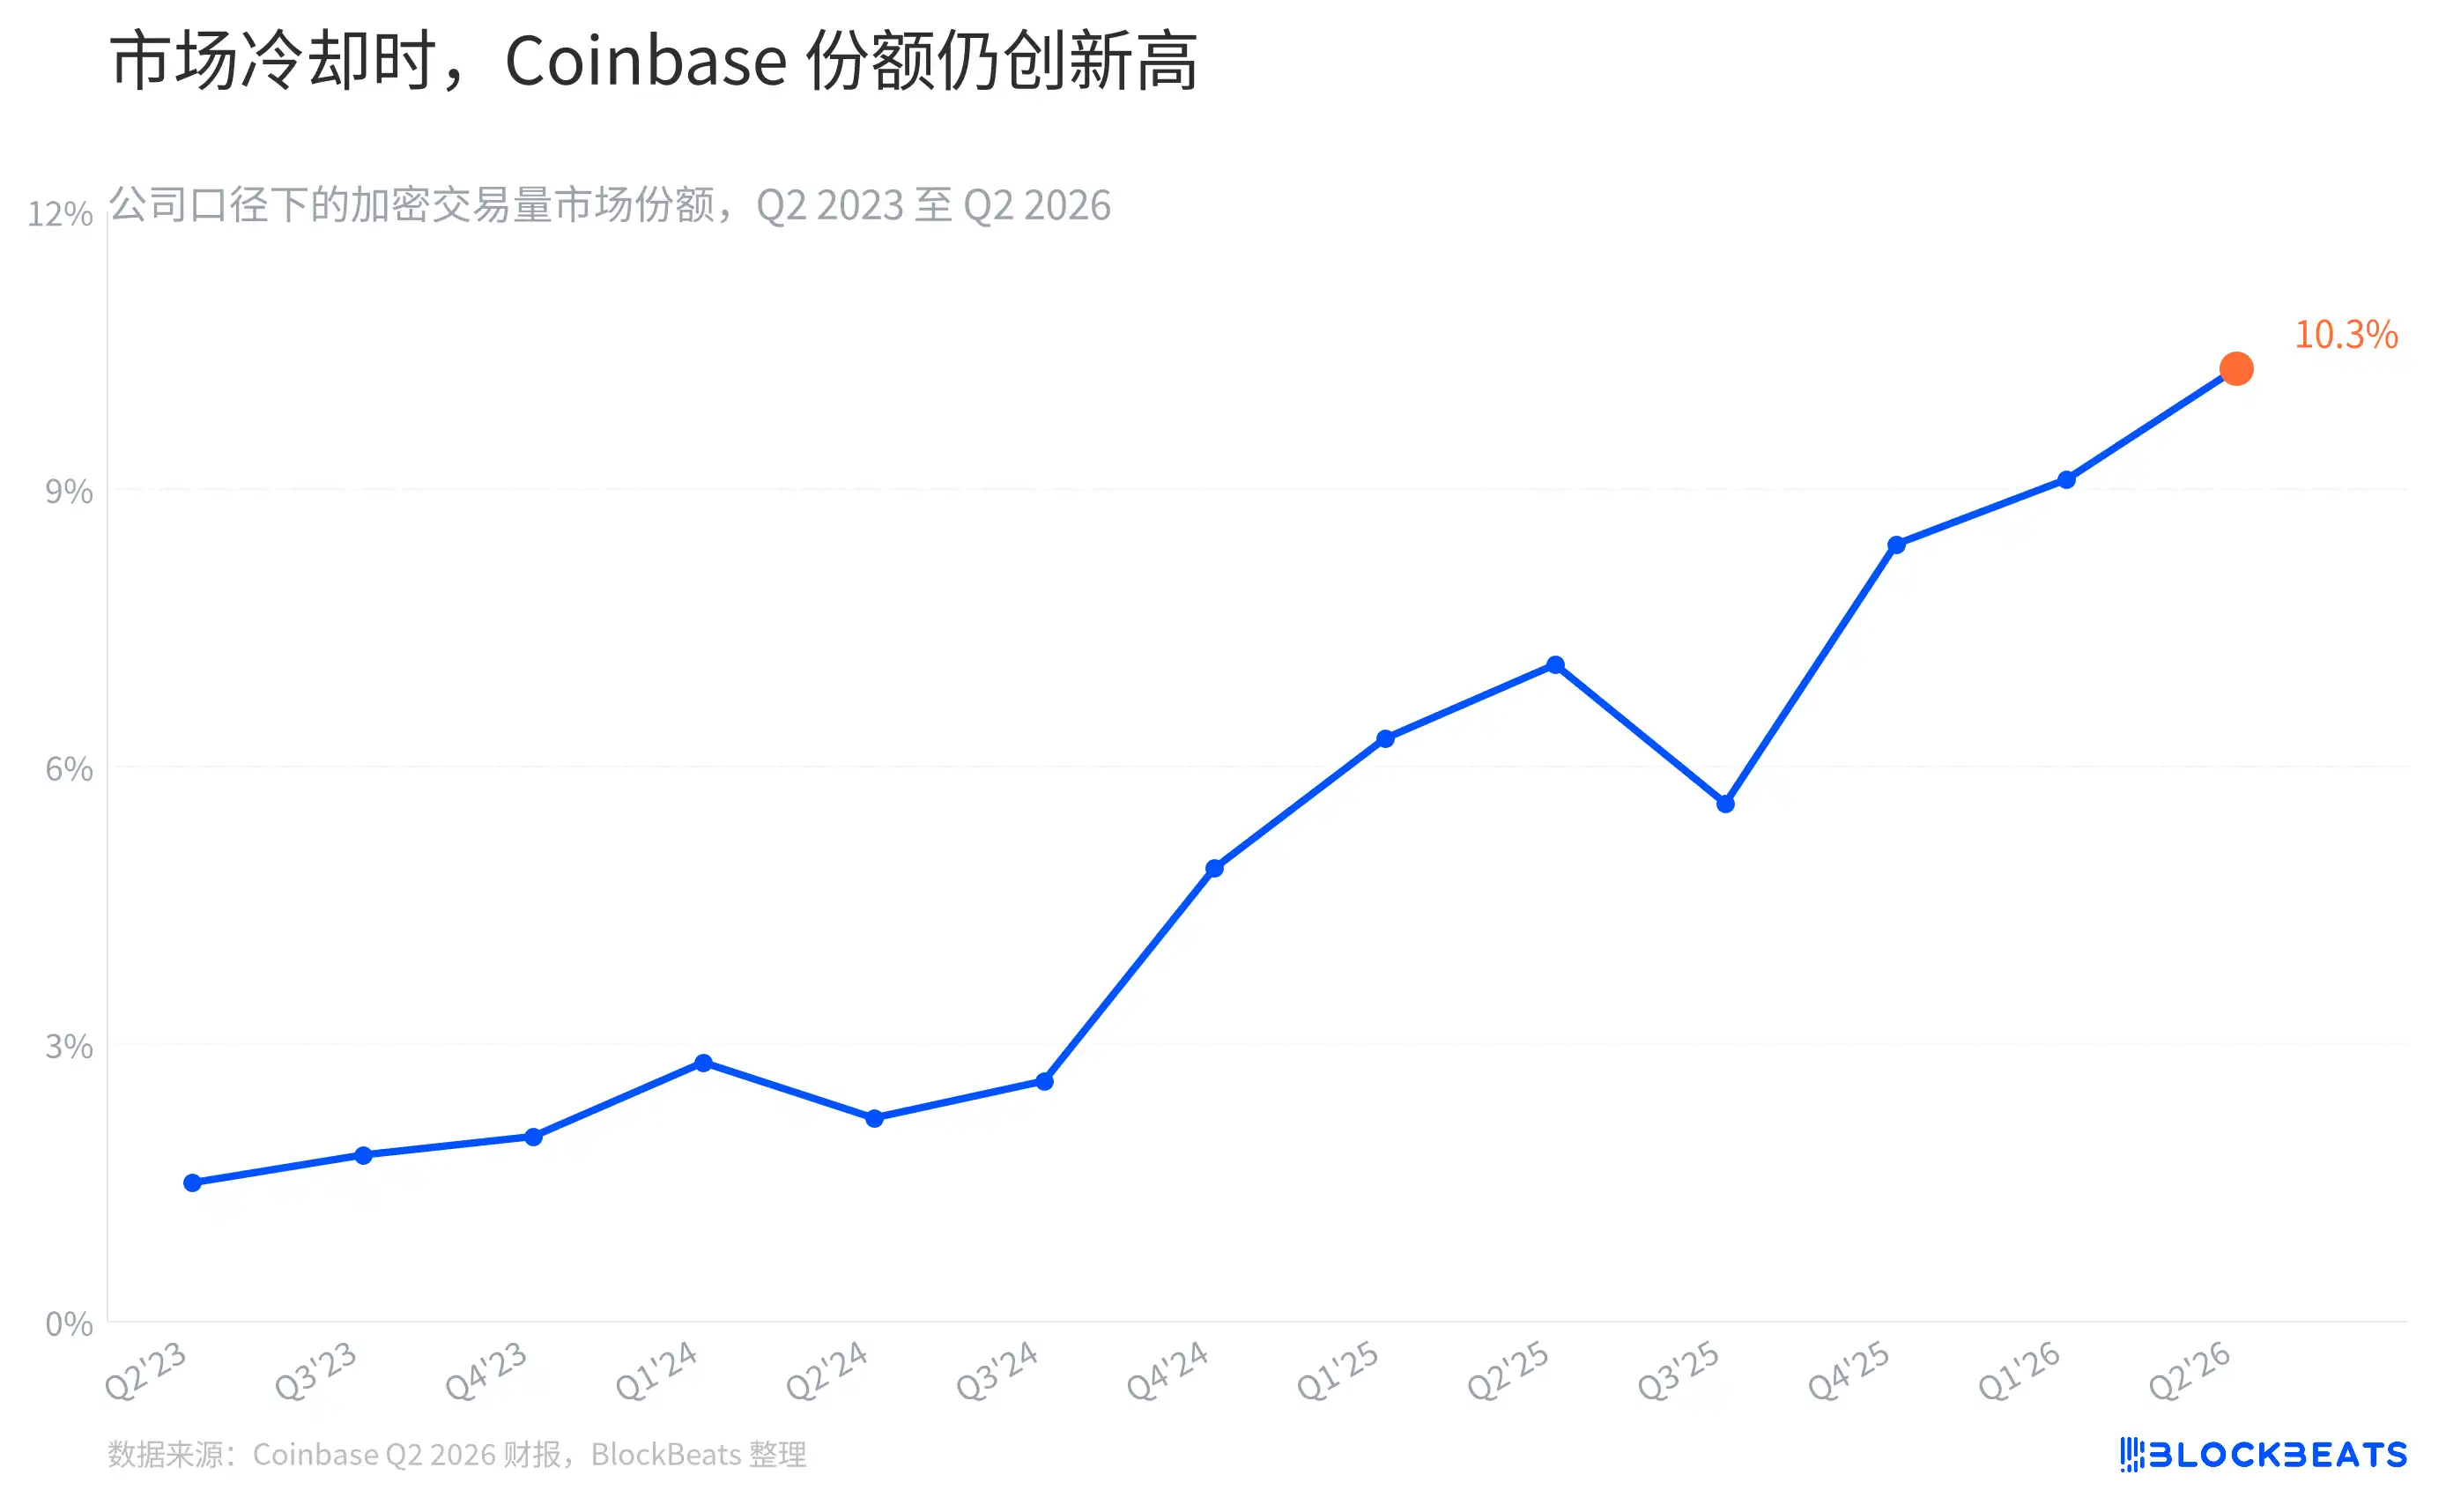
In the second quarter, the global crypto spot trading volume metric used by Coinbase fell 25% quarter-over-quarter. Yet, according to the company's earnings report, Coinbase's market share during the same period climbed from 9.1% in Q1 to 10.3%. Less revenue doesn't mean the platform's relative position has worsened.

Exchanges aren't fighting over a static pie. When the market is hot, retail investors flood in, and liquidity naturally thickens. When the market is dull, the users who remain test the platform's depth, product offerings, and compliant access channels. Coinbase's strongest tag has been its status as the compliant U.S. on-ramp. The current market share curve indicates this on-ramp is attracting a larger portion of trading activity.

However, this curve has its limits. Market share is Coinbase's internal calculation based on data from sources like CoinDesk Data, CoinMetrics, Dune, and Tardis, and includes stablecoin conversion activities. It's suitable for observing changes in its own competitiveness but should not be taken as the sole industry-wide market share standard.

What's Supporting Trading Revenue?
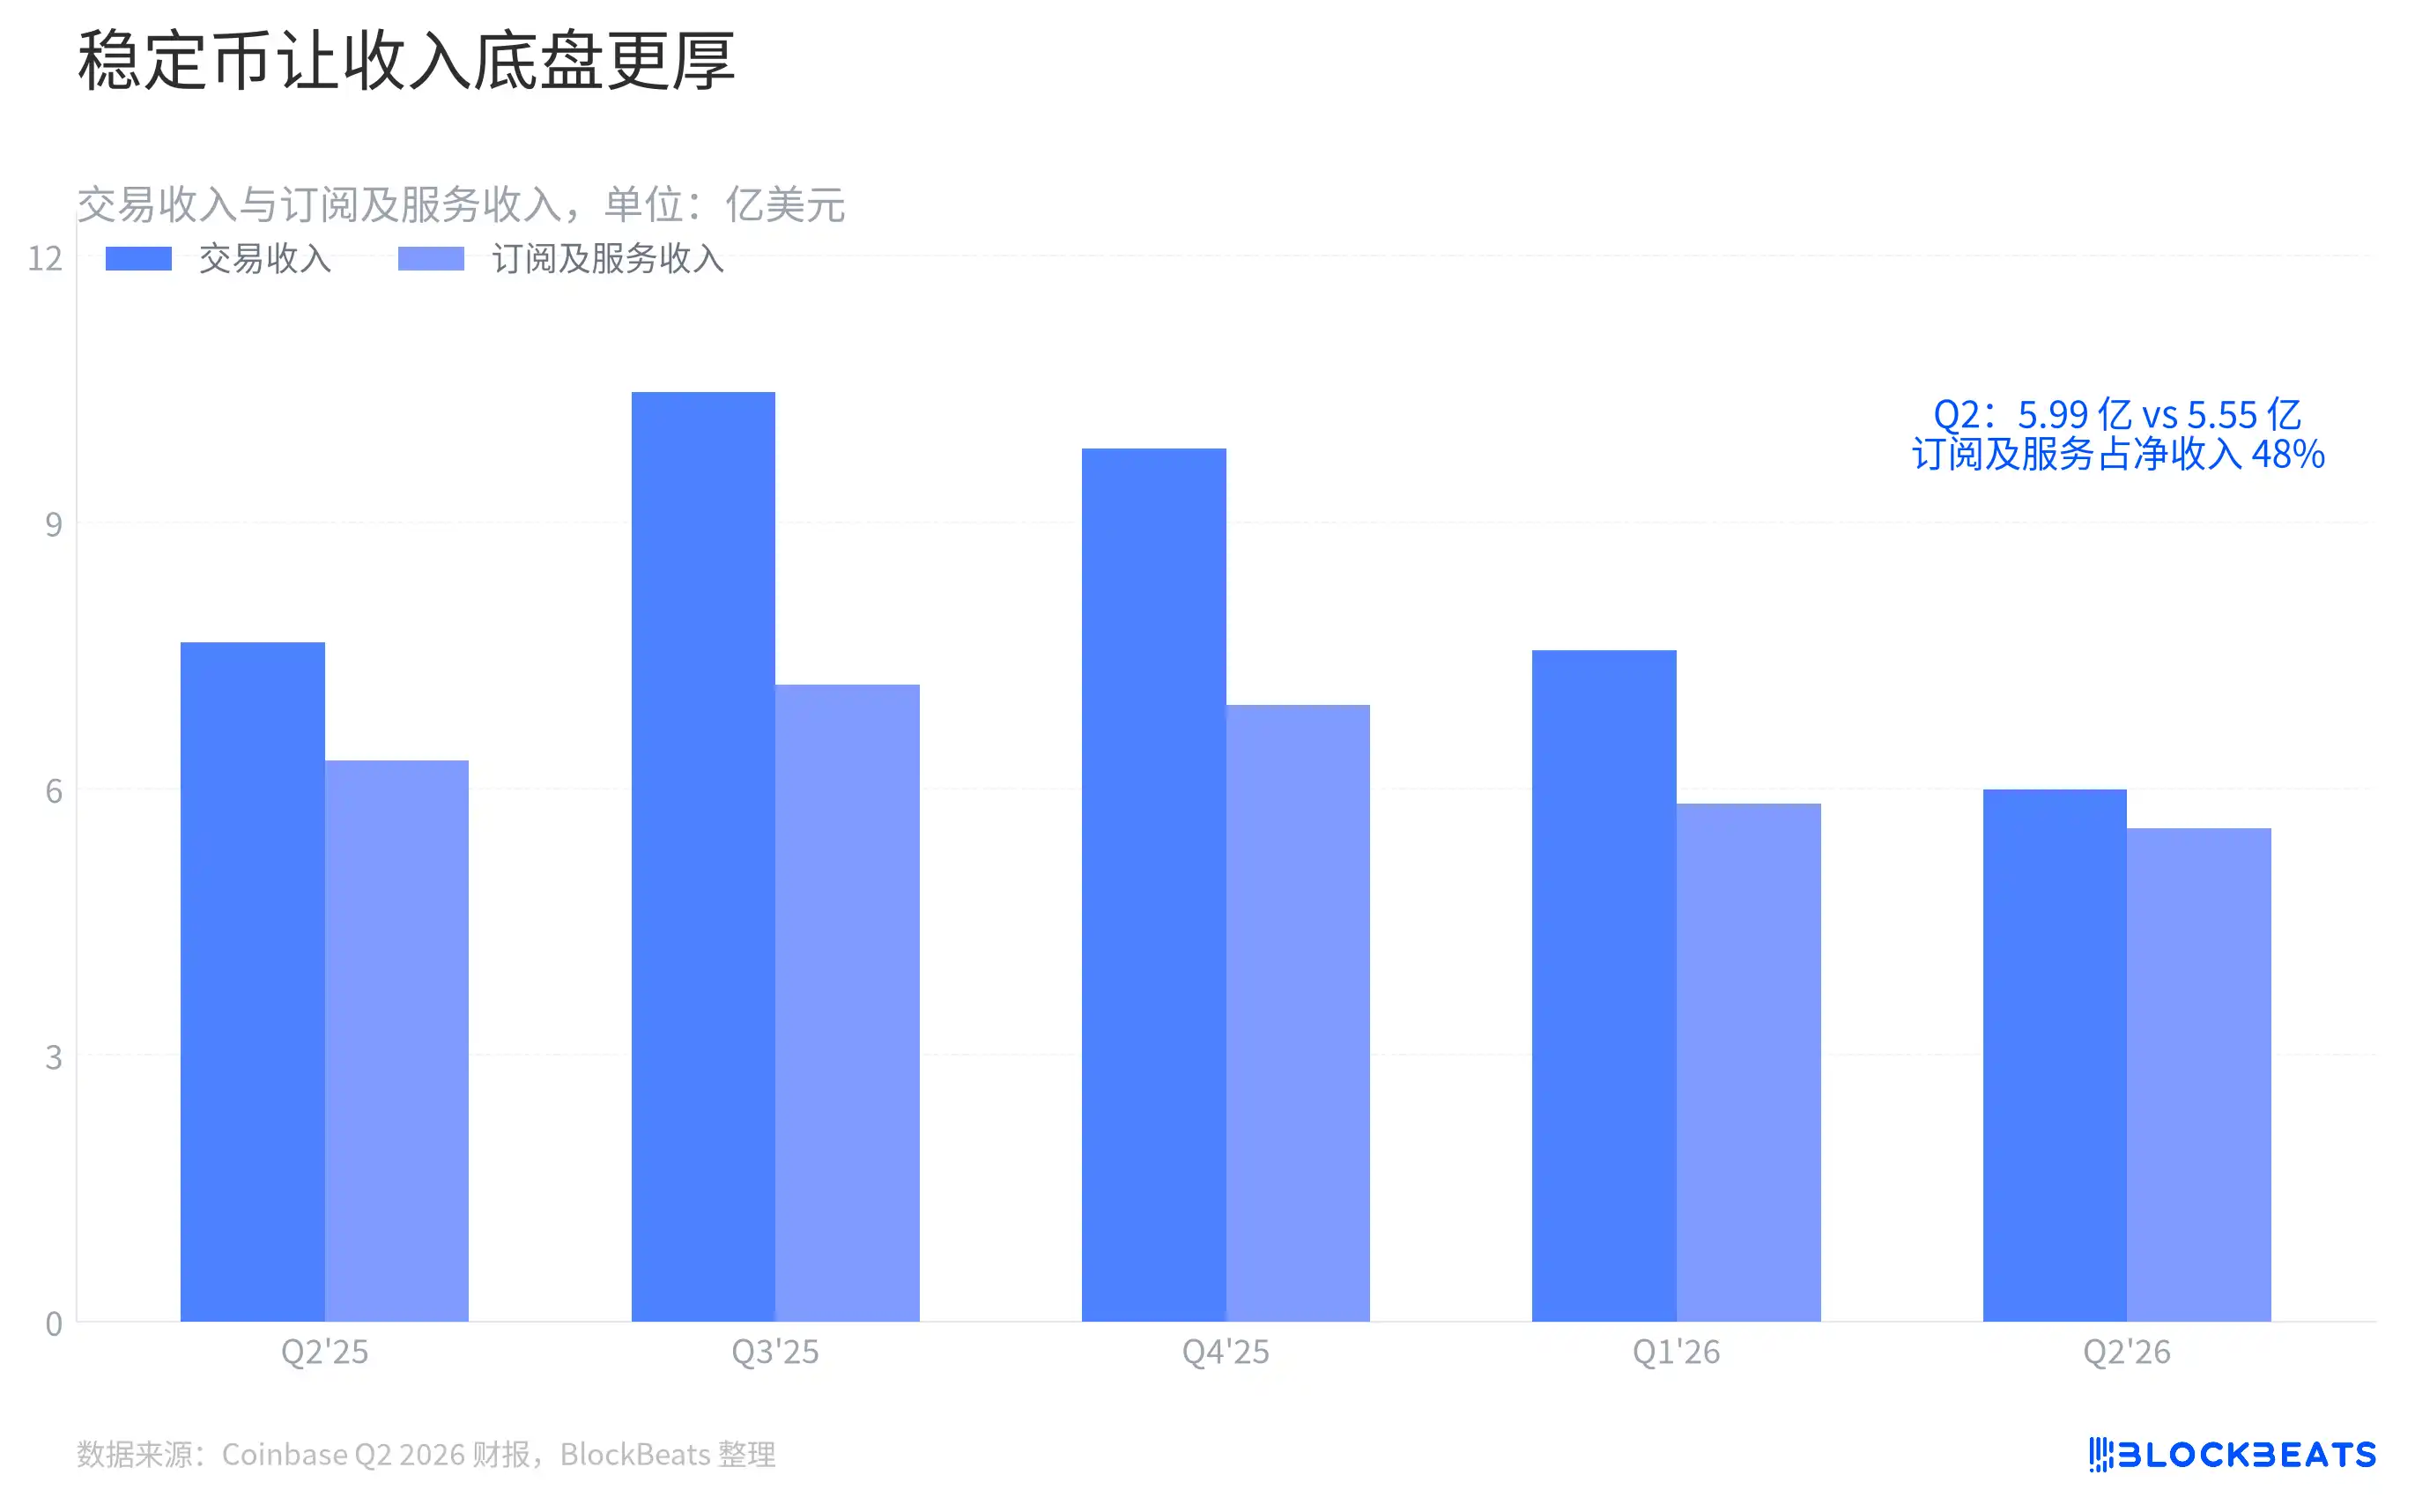
According to Coinbase's earnings report, second-quarter transaction revenue was $599 million, while subscription and services revenue was $555 million. The gap between them is now just a narrow sliver. In the past, transaction revenue was the primary beam that rose swiftly during bull markets. Now, subscription, custody, staking, interest, and stablecoin businesses are forming another layer of foundational income.

The largest portion comes from stablecoins. The company disclosed that stablecoin revenue this quarter was $292 million. Its logic differs from spot commission fees. When users hold USDC within Coinbase's products, the platform can share in the interest from reserve assets and partnership proceeds. A transaction commission is one-time. Stablecoin balances remain, generating returns on a daily basis.

This change is not abstract. The average USDC balance within Coinbase's products has risen to $20 billion. According to the company, over 30% of USDC's circulating supply was within its products at quarter-end. For the exchange, this is akin to turning wallets that were only opened during market rallies into accounts where funds can be parked.

This also explains why subscription and services revenue accounted for 48% of net revenue this quarter. This isn't to say Coinbase has become immune to coin price influences. Interest rate changes, fluctuations in USDC market cap, and user willingness to hold stablecoins will still impact this revenue line. However, its rhythm no longer needs to sync perfectly with spot trading volume.

After Spot Volume Shrinks, Where Does Liquidity Go?
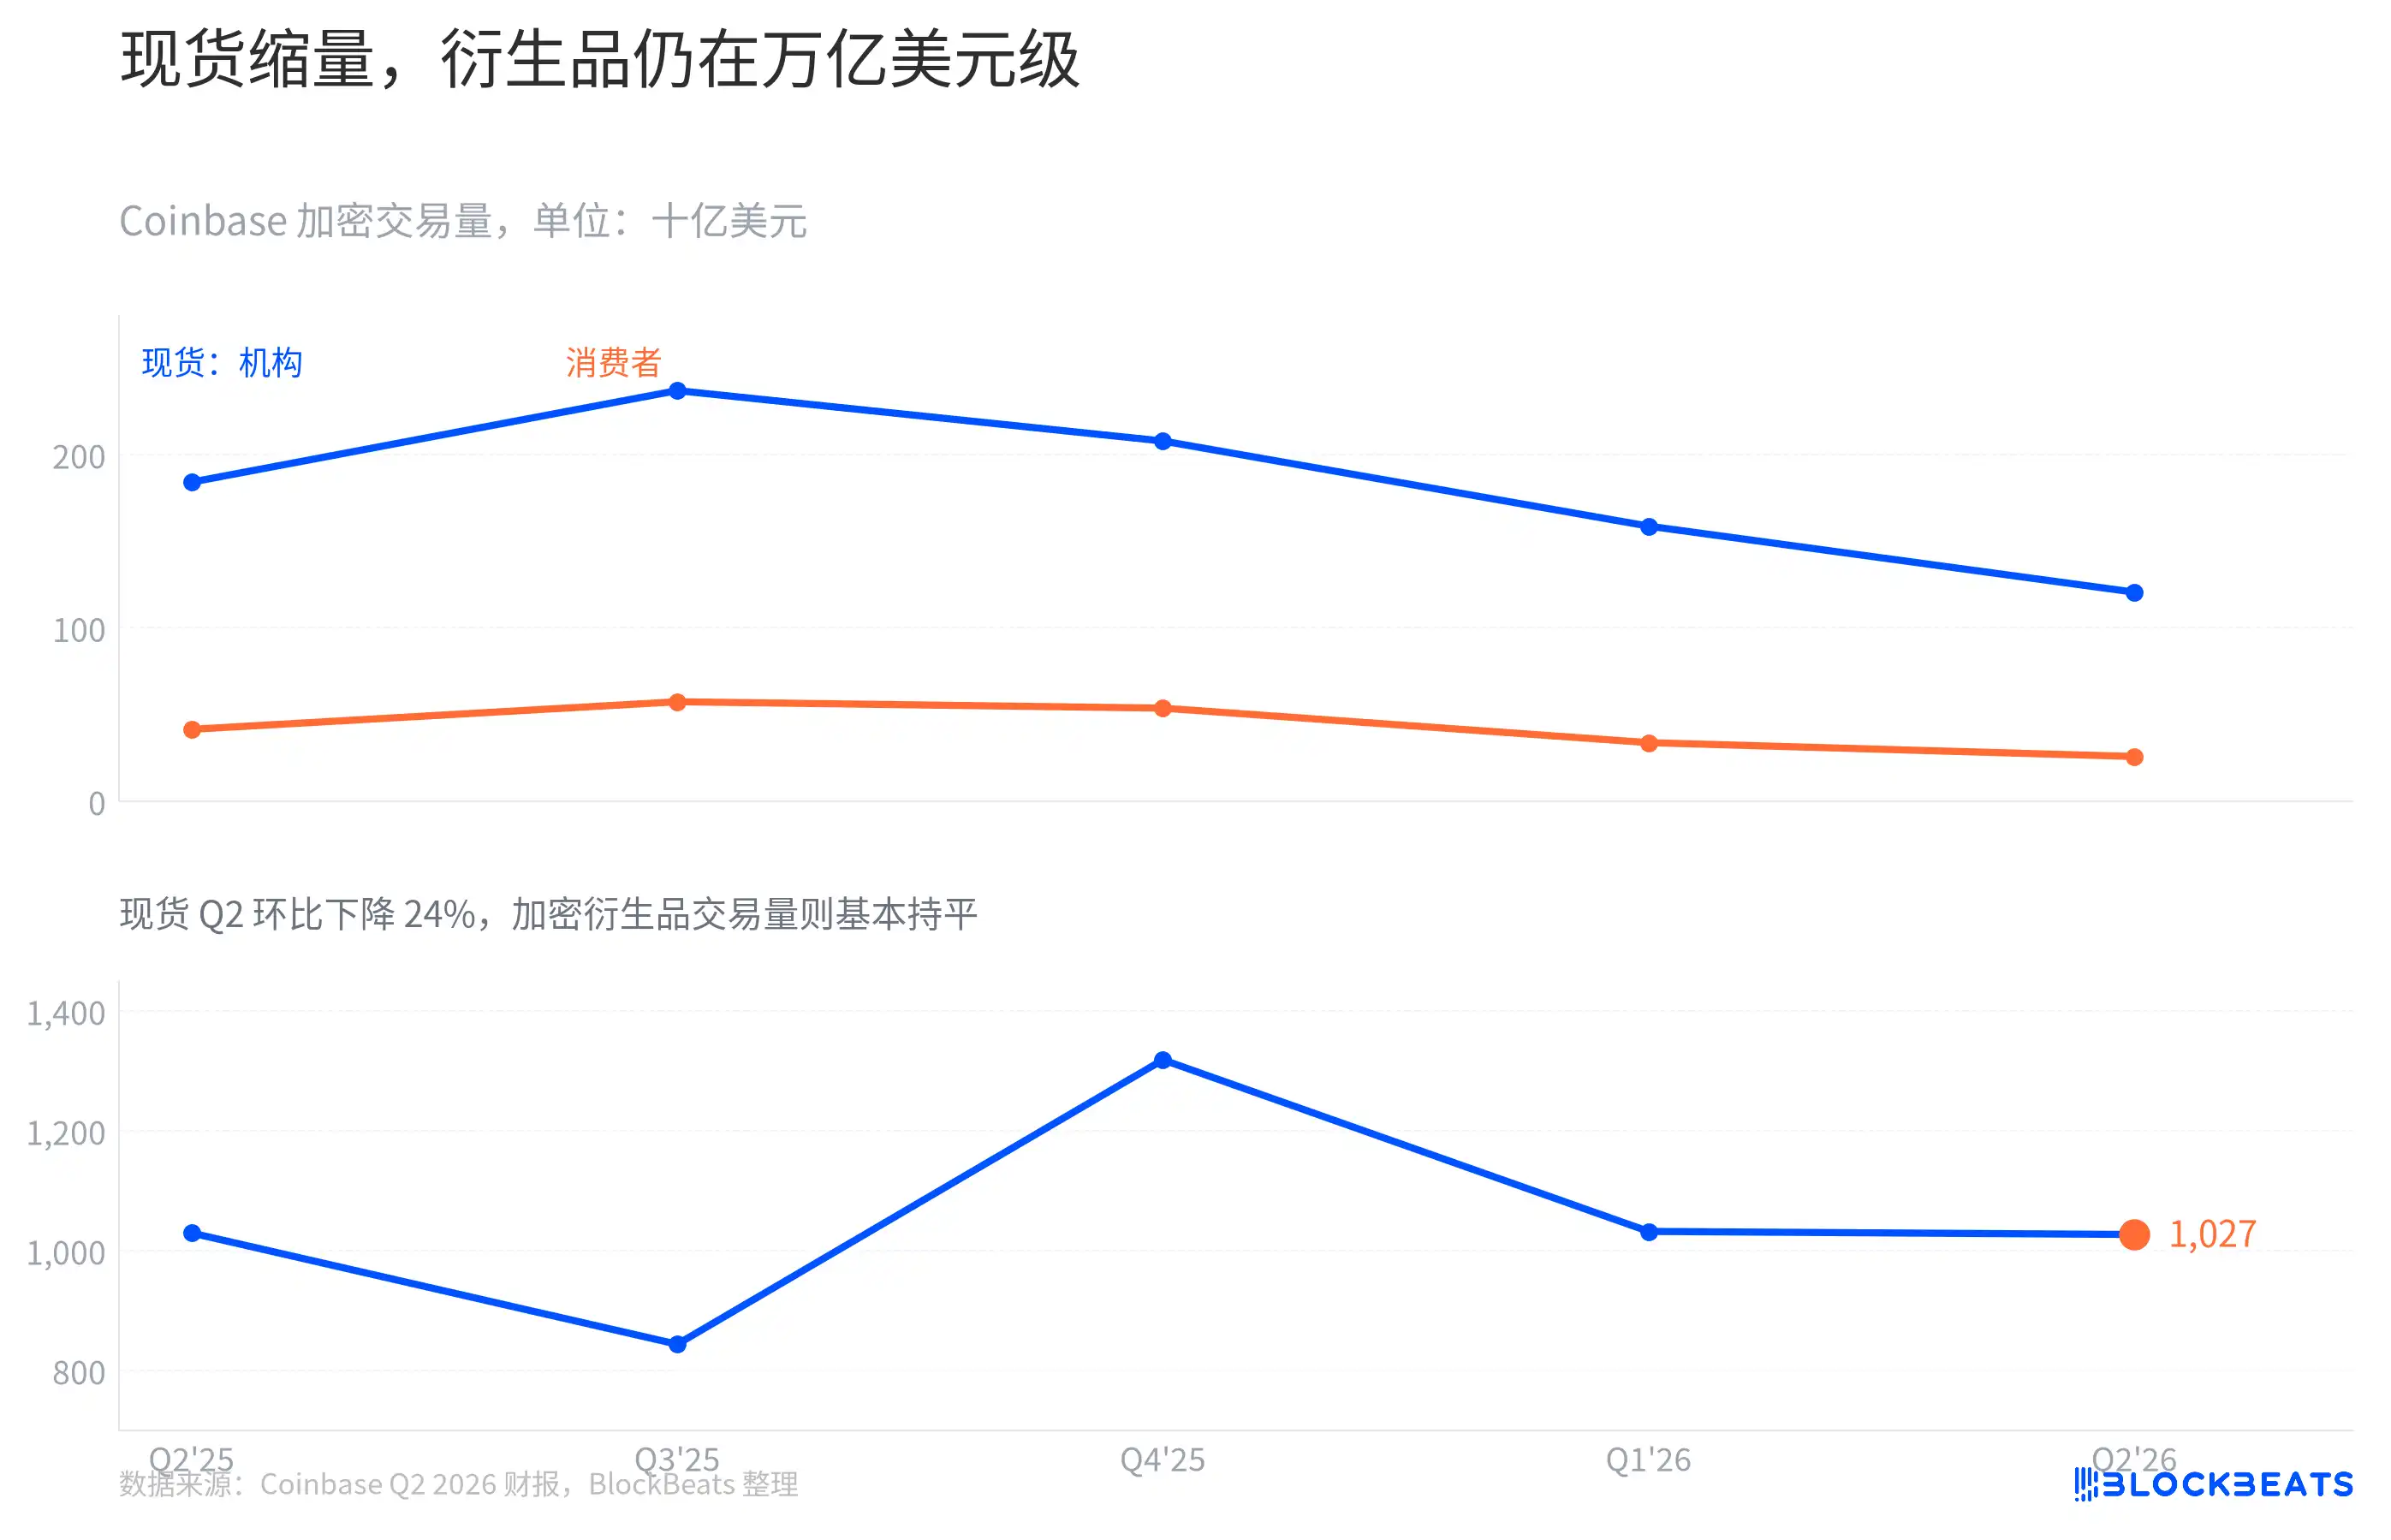
In the second quarter, Coinbase's crypto spot trading volume fell to $146.4 billion. Crypto derivatives trading volume remained at $1.03 trillion. According to the company's report, spot volume declined 24% quarter-over-quarter, while derivatives volume was largely flat.

This isn't a simple case of product substitution. Spot buying and selling are more akin to taking a directional bet on price, most likely to be postponed during low volatility. Derivatives serve purposes like leverage, hedging, and cross-market position adjustments; professional traders don't exit completely just because the market is quiet. Their trading volumes also can't be used directly to extrapolate revenue; derivatives are reported as notional amounts, and their fee structures and revenue recognition logic differ from spot.

Coinbase repeatedly emphasized global perpetual contracts, U.S. compliant access, and Deribit integration in its report. Its goal isn't just to add a derivatives tab next to the spot page; it's to enable one piece of collateral to support more trading needs. Once a platform can connect spot, stablecoins, and derivatives to the same pool of liquidity, the cost for users to leave is no longer just downloading another app.

Net Loss—Where Exactly Is the Loss?
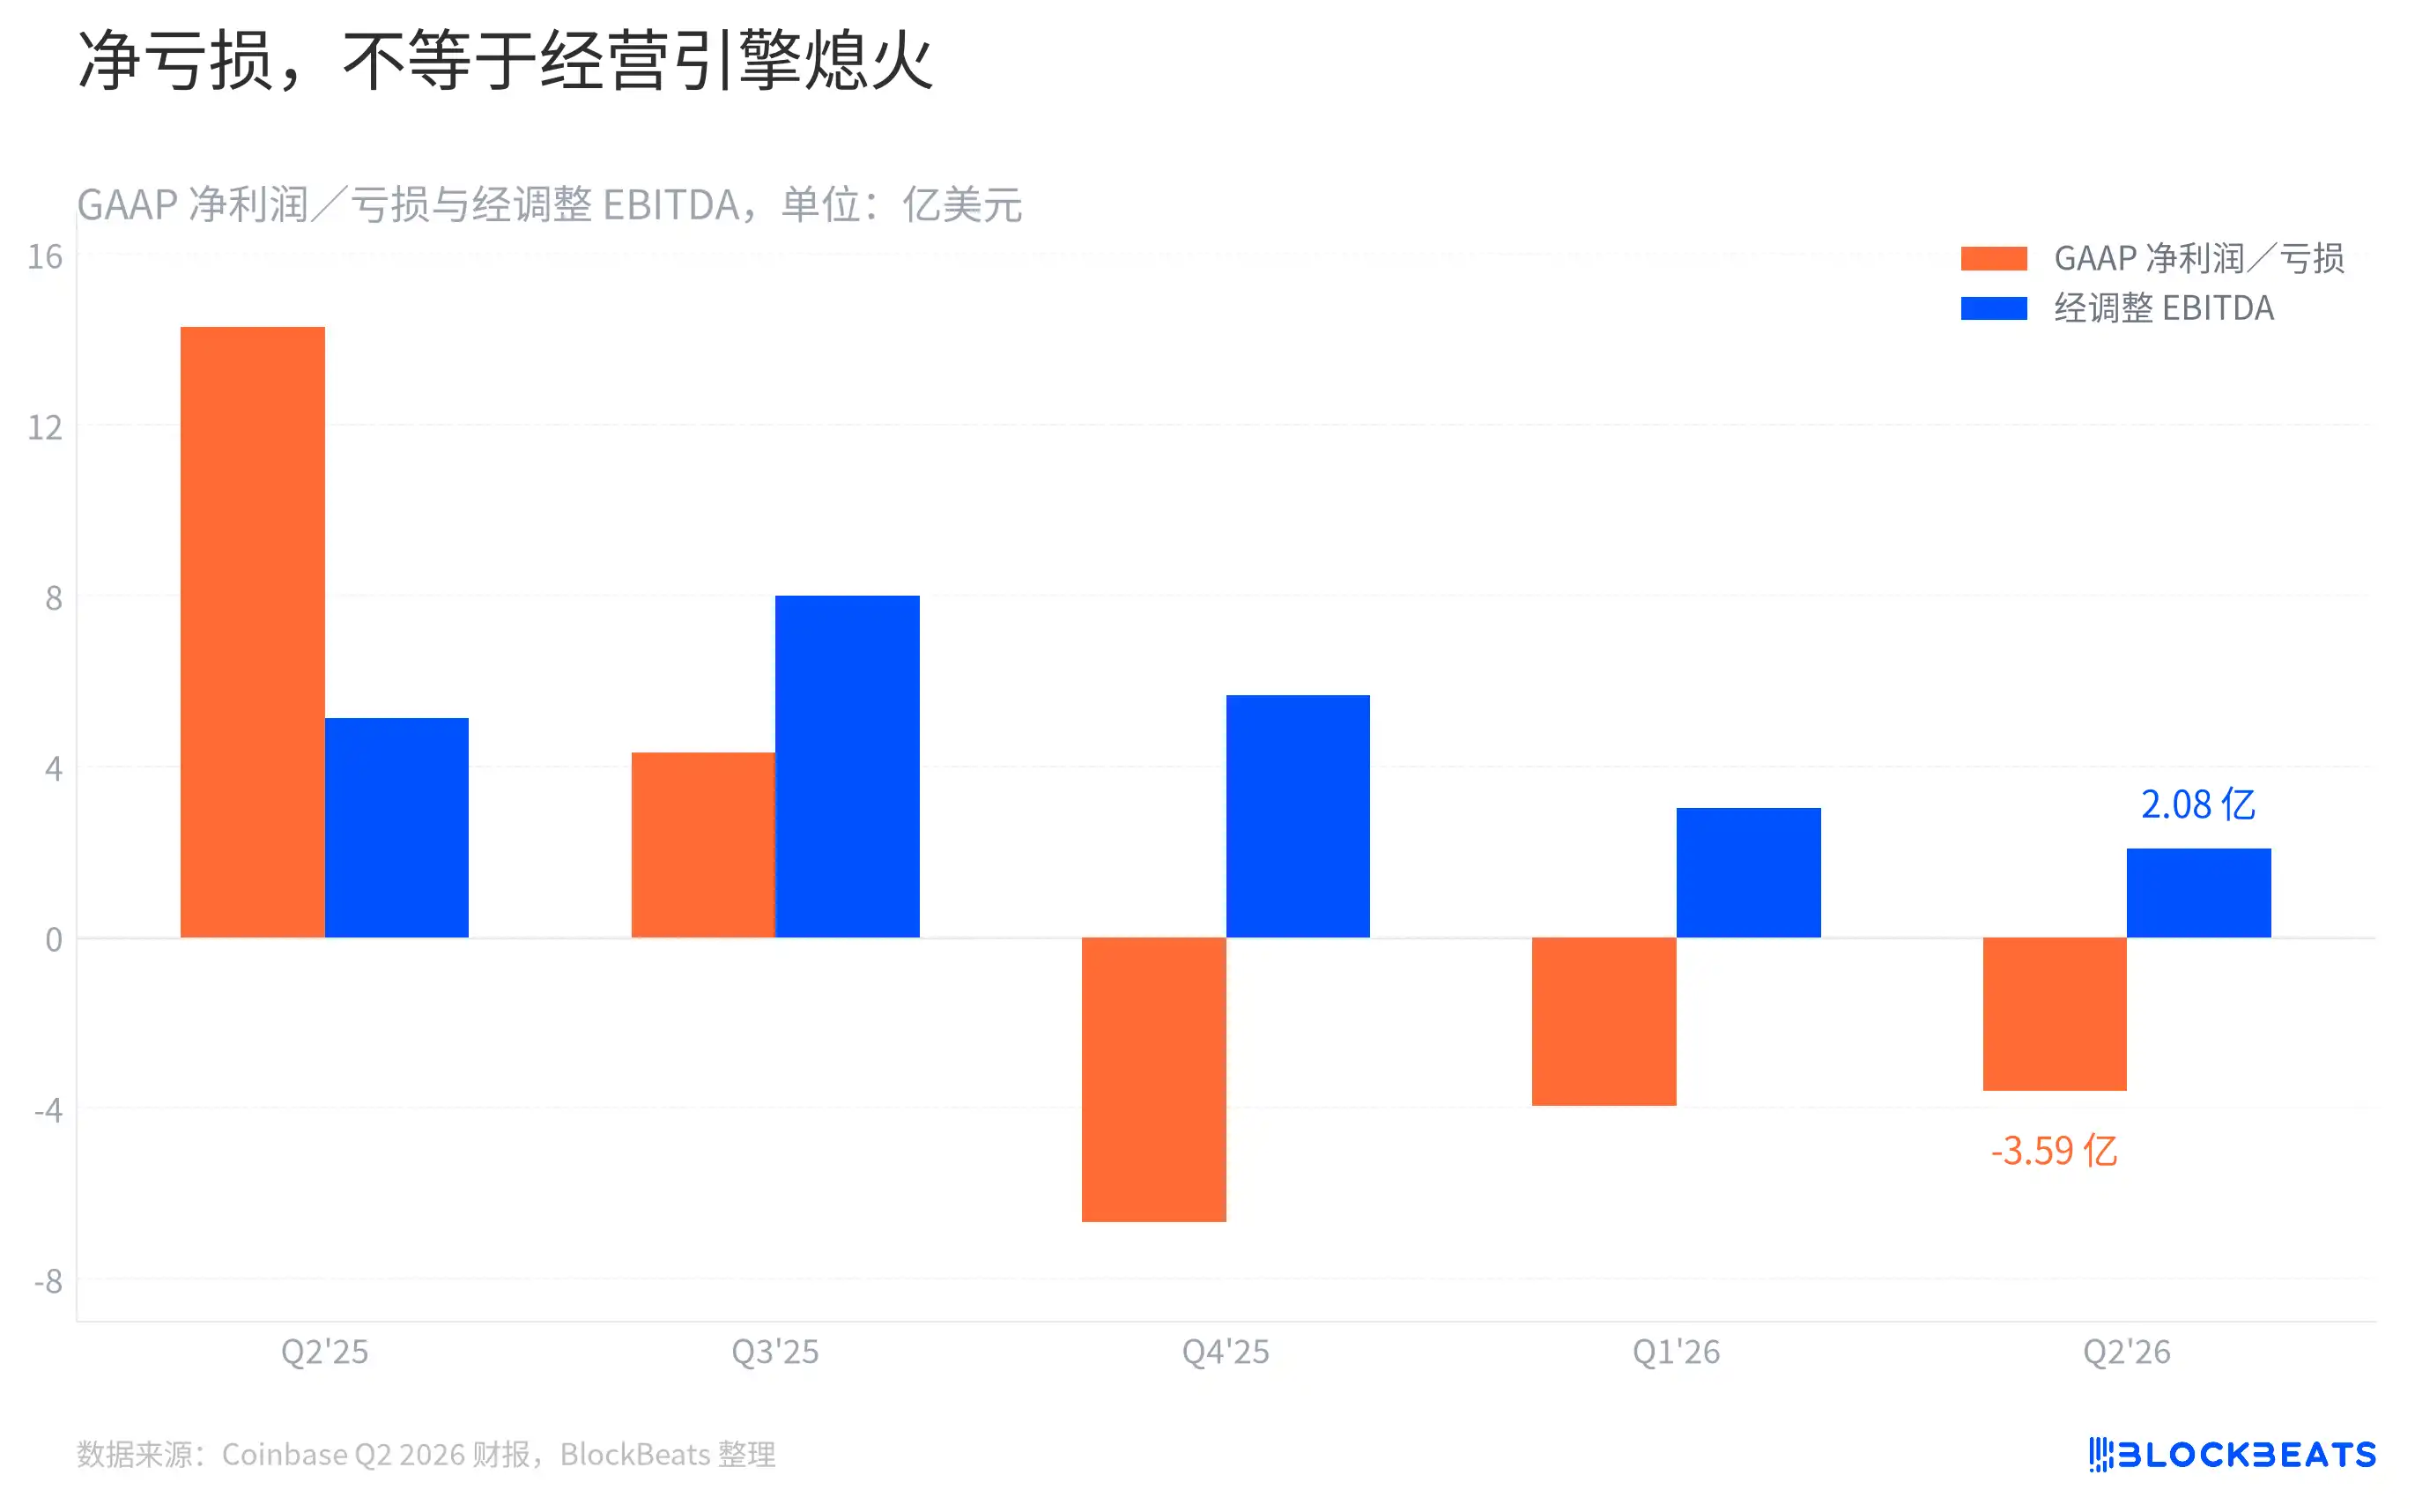
The GAAP net loss of $359 million this quarter is of course a real result. However, according to Coinbase's report, adjusted EBITDA for the same period remained positive at $208 million and has been positive for 14 consecutive quarters. The gap between these two bars is precisely what's most easily overlooked when reading the earnings report.

The GAAP income statement includes fair value changes of crypto asset investments, investment gains/losses, restructuring charges, and stock-based compensation in the current period's results. Adjusted EBITDA removes several of these items. It's a more direct gauge of whether operational activities can cover day-to-day costs in the period, but it's not an alternative scorecard to replace net profit.

According to the company's disclosure, the operating loss this quarter was $113 million, indicating that the decline in transaction revenue is still weighing on the profit side. Adjusted expenses decreased 9% quarter-over-quarter, and the full-year guidance for adjusted expenses was narrowed to $4.20 billion - $4.45 billion. Controlling expenses can reduce bleeding during low-volatility periods, but it cannot replace the validation of new revenue streams.

This is the real question left by Coinbase's earnings report. It has already proven it can gain market share even as the market cools and has stablecoins and derivatives keeping the platform afloat. The next time market trading volume declines, readers should watch not just how much revenue falls, but whether these new streams can continue channeling water into the same account.


Crypto di tendenza

Domande pertinenti

QAccording to the article, what were the main financial results for Coinbase in Q2?

AIn Q2, Coinbase reported total revenue falling to $1.22 billion and a GAAP net loss of $359 million, marking its second consecutive quarter of net loss.

QDespite a market downturn, what key competitive metric improved for Coinbase according to its internal calculations?

ACoinbase's share of global crypto spot trading volume (as calculated by the company) rose to 10.3% in Q2, a new record high under its methodology.

QWhat is the primary revenue driver for Coinbase's 'Subscriptions and services' income, specifically from stablecoins?

AThe primary driver is USDC. Coinbase earns interest and partnership revenue by holding USDC reserves for users. This income stream is based on the average balance held ($20 billion in Q2), not on transaction commissions.

QHow did trading activity in spot markets versus derivatives markets differ for Coinbase in Q2, and what does the article suggest is the reason?

ASpot trading volume fell 24% to $146.4 billion, while derivatives volume remained roughly flat at $1.03 trillion. The article suggests derivatives are less sensitive to low volatility as they serve needs like hedging and leverage for professional traders who remain active even in quiet markets.

QWhat is the key difference between Coinbase's GAAP net loss and its Adjusted EBITDA for Q2, and what does this indicate about its core operations?

AThe GAAP net loss of $359 million includes items like investment gains/losses and stock-based compensation. Adjusted EBITDA, which was positive at $208 million, excludes these to show that its core business operations were still generating cash to cover ongoing costs for the 14th consecutive quarter.

Letture associate

Low Investment Isn't Apple's Immunity Pass

While Meta and Google face investor scrutiny over ballooning AI capital expenditures, Apple's minimal AI investment has paradoxically become a strength. Its market cap recently reclaimed the global top spot, surpassing $5 trillion. The irony is deep: Apple's own AI efforts have lagged, with "Apple Intelligence" delayed and core talent lost, forcing reliance on partners like Google Gemini and Alibaba's Qianwen. Its Q3 FY2026 (Q2 CY) earnings initially seemed stellar. Revenue hit $109.4B (up 16% YoY), with iPhone and Mac sales, growing 22% and 29% respectively, driving most of the growth. However, the stock fell over 8% post-earnings. The primary concern was a weaker Q4 revenue growth forecast of 9-11%, below expectations, due to looming supply chain constraints. Apple is feeling the indirect cost of the AI boom. Soaring memory and chip prices, fueled by massive data center investments from Microsoft, Amazon, and others, are forcing Apple to raise Mac and iPad prices significantly. The upcoming iPhone launch is also expected to see substantial price hikes. Despite avoiding heavy AI infrastructure spending—its capital expenditures are actually down 28%—Apple cannot escape the industry-wide supply and cost pressures. While Apple's operating cash flow remains robust, its substantial R&D spending (up 32% YoY) has yet to yield major AI breakthroughs. As Tim Cook prepares to step down as CEO, Apple faces a challenging transition: balancing its premium hardware success against the strategic and cost pressures of the AI era it has so far cautiously navigated.

marsbit20 min fa

Low Investment Isn't Apple's Immunity Pass

marsbit20 min fa

PA Graphics Explanation | One Chart to Understand the Major Web3 Events in August 2026

**PANews Crypto Calendar: Key Web3 Events in August 2026** PANews introduces its revamped crypto calendar, featuring comprehensive coverage, flexible filtering, and easy export options. The market in August will be shaped by multiple key events across macroeconomics, regulation, tokenomics, and project developments: * **Macro & Policy:** Key US economic data releases (July Non-Farm Payrolls, CPI), the Federal Reserve meeting minutes, and the Jackson Hole Economic Symposium will be in focus. On the regulatory front, the US Senate plans to release a new draft of the *CLARITY Act*, while the EU's expanded crypto ban against Belarus comes into effect. * **Token Unlocks:** Significant token unlocks are scheduled for assets including ENA, AVAX, CONX, ZRO, and KAITO, which may influence market volatility. * **Project Updates & Shutdowns:** Several services, including Exchange Art, Ctrl Wallet, Zapper, NFTfi, and Summer.fi, are set to cease operations or undergo major adjustments. Users are advised to manage their assets accordingly. * **Corporate Activity:** Q2 earnings reports from companies like SpaceX, Circle, and Nvidia are due. Unitree Robotics will initiate its IPO subscription on the STAR Market, and Moonshot AI plans to begin a Pre-IPO financing round. * **Industry Events:** Major conferences such as Bitcoin Asia 2026 and the 2026 Digital Expo will take place. The overarching market narrative for August will revolve around macroeconomic expectations, regulatory developments, token unlock schedules, and ongoing industry consolidation.

marsbit30 min fa

PA Graphics Explanation | One Chart to Understand the Major Web3 Events in August 2026

marsbit30 min fa

Wall Street's Most Famous 'Cassandra' Now Has His Sights Set on Nvidia

Michael Burry, the famed "Big Short" investor, has once again captured Wall Street's attention with a series of short positions against major tech and semiconductor stocks, most notably Nvidia. In late June and July, through his "Cassandra Unchained" newsletter, Burry disclosed short bets against Nvidia, Tesla, Applied Materials, Caterpillar, the SOXX semiconductor ETF, and later, Micron Technology. His core thesis revolves around potential distortions in the AI infrastructure boom, specifically questioning whether extended depreciation schedules (e.g., 6 years vs. a realistic 2-3 years for AI chips) by cloud giants like Microsoft and Google artificially inflate profits. He also raises concerns about possible "off-balance-sheet circular financing," where chip demand might be propped up by vendor-backed funding to clients. Nvidia's stock experienced volatility following these disclosures, briefly dipping but largely holding near Burry's reported entry points, leaving his positions roughly flat or slightly underwater as of late July. This move is part of a pattern for Burry, whose track record since his legendary 2008 bet is mixed. He has faced notable losses, such as on Tesla in 2021, while scoring on broader market turns like the 2020 pandemic crash. His methodology focuses intensely on free cash flow and scrutinizing original financial documents to spot overvaluation and structural risks, but it often struggles with timing the market. The article contrasts Burry's stance with other prominent investors. Steve Eisman, another "Big Short" figure, is not shorting Nvidia, citing strong fundamentals but expressing nervousness about sustainability. Jim Chanos agrees with the broad "accounting mismatch" concern—comparing it to the dot-com bubble—but targets financial leverage in private equity firms rather than the chip stocks themselves. While Nvidia's short interest remains relatively low at 1.3-1.4% of float, the massive stock size means absolute short losses have been significant, exceeding $5 billion earlier this year. The piece concludes that for ordinary investors, the key takeaway is not replicating specific short bets but learning from the critical frameworks these investors use: questioning rosy accounting, identifying structural vulnerabilities, and maintaining skepticism during market euphoria, even if pinpointing the exact catalyst for a downturn remains elusive.

marsbit55 min fa

Wall Street's Most Famous 'Cassandra' Now Has His Sights Set on Nvidia

marsbit55 min fa

Weekly Selection丨Epic Stock Market Volatility, Changxin Tech's IPO Reshapes Storage Landscape, Saylor Aims to Re-Anchor STRC Around September 8th

PANews Weekly Digest: Market Turmoil, Tech Breakthroughs, and Crypto Developments. The week saw significant volatility across global markets. South Korea's KOSPI index experienced extreme turbulence, including multiple trading halts, largely driven by sharp declines in AI hardware stocks like SK Hynix. In contrast, China's Changxin Xinqiao (CXC) achieved a landmark IPO with a market cap surpassing 4 trillion yuan, marking a major success for the domestic DRAM industry after a decade of losses. In the crypto and Web3 space, several key narratives emerged. AI is driving demand for new infrastructure, with projects like AI agent wallets and programmable payments gaining traction, attracting interest from firms like Coinbase. The Bitcoin mining sector is pivoting, with companies like MARA focusing on energy management as electricity becomes a core AI-era asset. Meanwhile, the RWA (Real World Assets) sector faces a "utilization puzzle," with hundreds of billions in on-chain assets remaining dormant. Notable market movements included a historic single-day surge of over 17% for the KOSPI index and a significant migration of $16.5 billion in staked ETH within the Lido ecosystem. Michael Saylor announced a target to re-peg the STRC stablecoin around September 8th. Other highlights include discussions on Ethereum's ambitious 2030 roadmap for scaling and privacy, analysis showing high protocol revenues not always translating to token price gains, and warnings from Citi about potential extreme commodity price shocks by late 2026.

marsbit1 h fa

Weekly Selection丨Epic Stock Market Volatility, Changxin Tech's IPO Reshapes Storage Landscape, Saylor Aims to Re-Anchor STRC Around September 8th

marsbit1 h fa

When the Market Begins to Question AI Capex: A Full Analysis of Q2 Earnings Reports from Five Tech Giants

In late July 2026, five major US tech giants—Alphabet, Intel, Microsoft, Meta, and Apple—released their Q2 earnings reports. While all companies exceeded revenue and profit expectations, driven by strong AI-related business growth, investor reactions diverged sharply due to concerns over escalating AI capital expenditures (capex) and their impact on free cash flow. Alphabet reported strong revenue growth and a surging cloud business, but its stock fell after announcing a doubled year-on-year capex and negative quarterly free cash flow for the first time. Intel posted its strongest revenue growth in over 15 years, but its stock experienced volatile trading after significantly raising its full-year capex guidance. Microsoft saw its stock surge after beating estimates and, crucially, lowering its capex forecast while projecting positive free cash flow. Meta faced the most severe sell-off as its profits declined despite revenue beats, with free cash flow plunging over 90% and its capex guidance raised. Apple reported record June-quarter results, but its stock plummeted after providing Q4 revenue guidance that fell short of expectations, citing supply chain constraints and forex headwinds. The overall takeaway is that the market's focus has shifted from validating AI demand to scrutinizing the timeline for returns on massive AI investments. Companies demonstrating a clearer path to managing capex and preserving free cash flow, like Microsoft, were rewarded, while those signaling continued aggressive spending faced investor skepticism.

Odaily星球日报1 h fa

When the Market Begins to Question AI Capex: A Full Analysis of Q2 Earnings Reports from Five Tech Giants

Odaily星球日报1 h fa

Trading

Spot

Articoli Popolari

Come comprare T

Benvenuto in HTX.com! Abbiamo reso l'acquisto di Threshold Network Token (T) semplice e conveniente. Segui la nostra guida passo passo per intraprendere il tuo viaggio nel mondo delle criptovalute.Step 1: Crea il tuo Account HTXUsa la tua email o numero di telefono per registrarti il tuo account gratuito su HTX. Vivi un'esperienza facile e sblocca tutte le funzionalità,Crea il mio accountStep 2: Vai in Acquista crypto e seleziona il tuo metodo di pagamentoCarta di credito/debito: utilizza la tua Visa o Mastercard per acquistare immediatamente Threshold Network TokenT.Bilancio: Usa i fondi dal bilancio del tuo account HTX per fare trading senza problemi.Terze parti: abbiamo aggiunto metodi di pagamento molto utilizzati come Google Pay e Apple Pay per maggiore comodità.P2P: Fai trading direttamente con altri utenti HTX.Over-the-Counter (OTC): Offriamo servizi su misura e tassi di cambio competitivi per i trader.Step 3: Conserva Threshold Network Token (T)Dopo aver acquistato Threshold Network Token (T), conserva nel tuo account HTX. In alternativa, puoi inviare tramite trasferimento blockchain o scambiare per altre criptovalute.Step 4: Scambia Threshold Network Token (T)Scambia facilmente Threshold Network Token (T) nel mercato spot di HTX. Accedi al tuo account, seleziona la tua coppia di trading, esegui le tue operazioni e monitora in tempo reale. Offriamo un'esperienza user-friendly sia per chi ha appena iniziato che per i trader più esperti.

461 Totale visualizzazioniPubblicato il 2024.12.10Aggiornato il 2026.06.02

Come comprare T

Discussioni

Benvenuto nella Community HTX. Qui puoi rimanere informato sugli ultimi sviluppi della piattaforma e accedere ad approfondimenti esperti sul mercato. Le opinioni degli utenti sul prezzo di T T sono presentate come di seguito.

活动图片