Solana flashes buy signal, but key resistance levels keep recovery in check

ambcryptoPubblicato 2026-07-15Pubblicato ultima volta 2026-07-15

Introduzione

Crypto trading volumes have been declining since July 2024, hitting their lowest two-year average, indicating weak demand and low market confidence. This thin liquidity can lead to sharp price moves. Against this backdrop, analyst Ali Martinez notes that Solana (SOL) has flashed a bullish buy signal on the 3-day chart using the SuperTrend indicator, with key levels to watch at $96 and $121. Furthermore, long-term holder data shows consistent accumulation throughout 2026. However, SOL's broader price structure remains bearish, having broken previous swing lows. Key resistance levels from Fibonacci analysis are at $83.79 and $90.22, with the $116 realized price level posing a major overhead supply hurdle. Recent large on-chain token movements, such as a $15.14 million transfer from Alameda Research, have also contributed to selling pressure and liquidations. In summary, while recent signals and holder activity offer a bullish near-term case, significant resistance levels and weak market-wide capital flows continue to challenge a sustained SOL recovery.

The trading volumes of the top crypto assets have been dwindling since July 2024, wrote the analytics platform Santiment in a post on X.
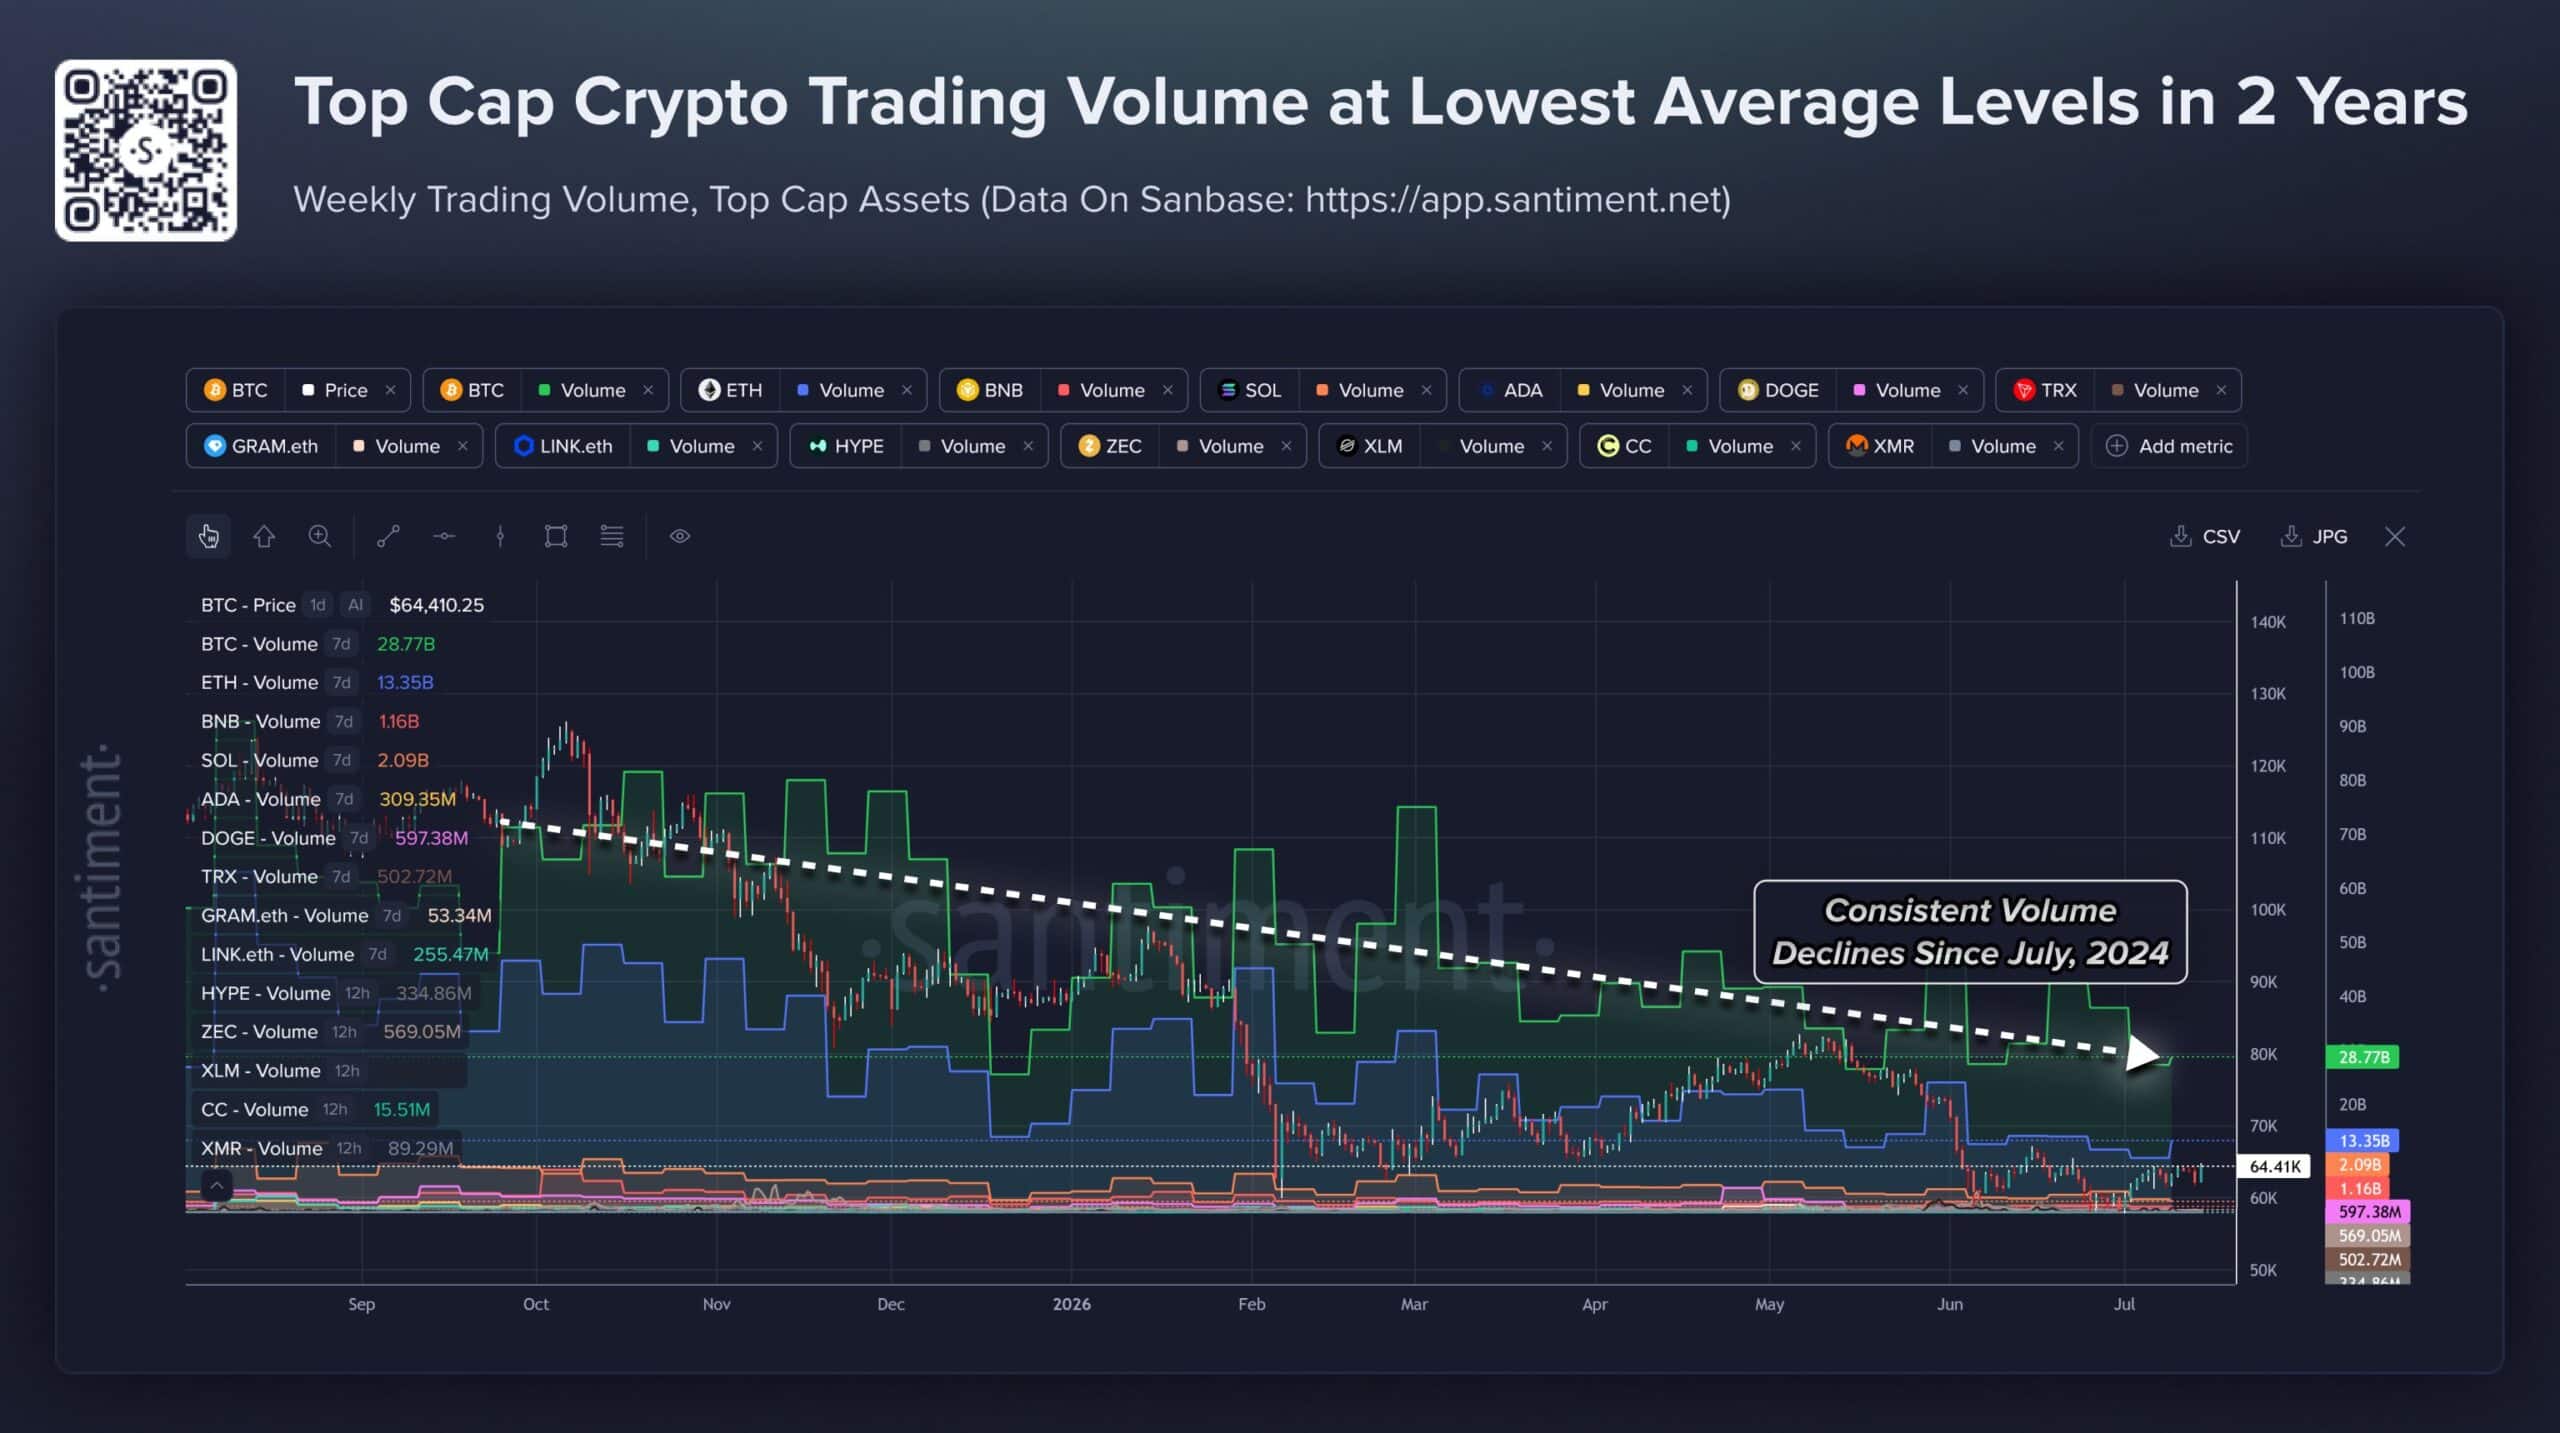
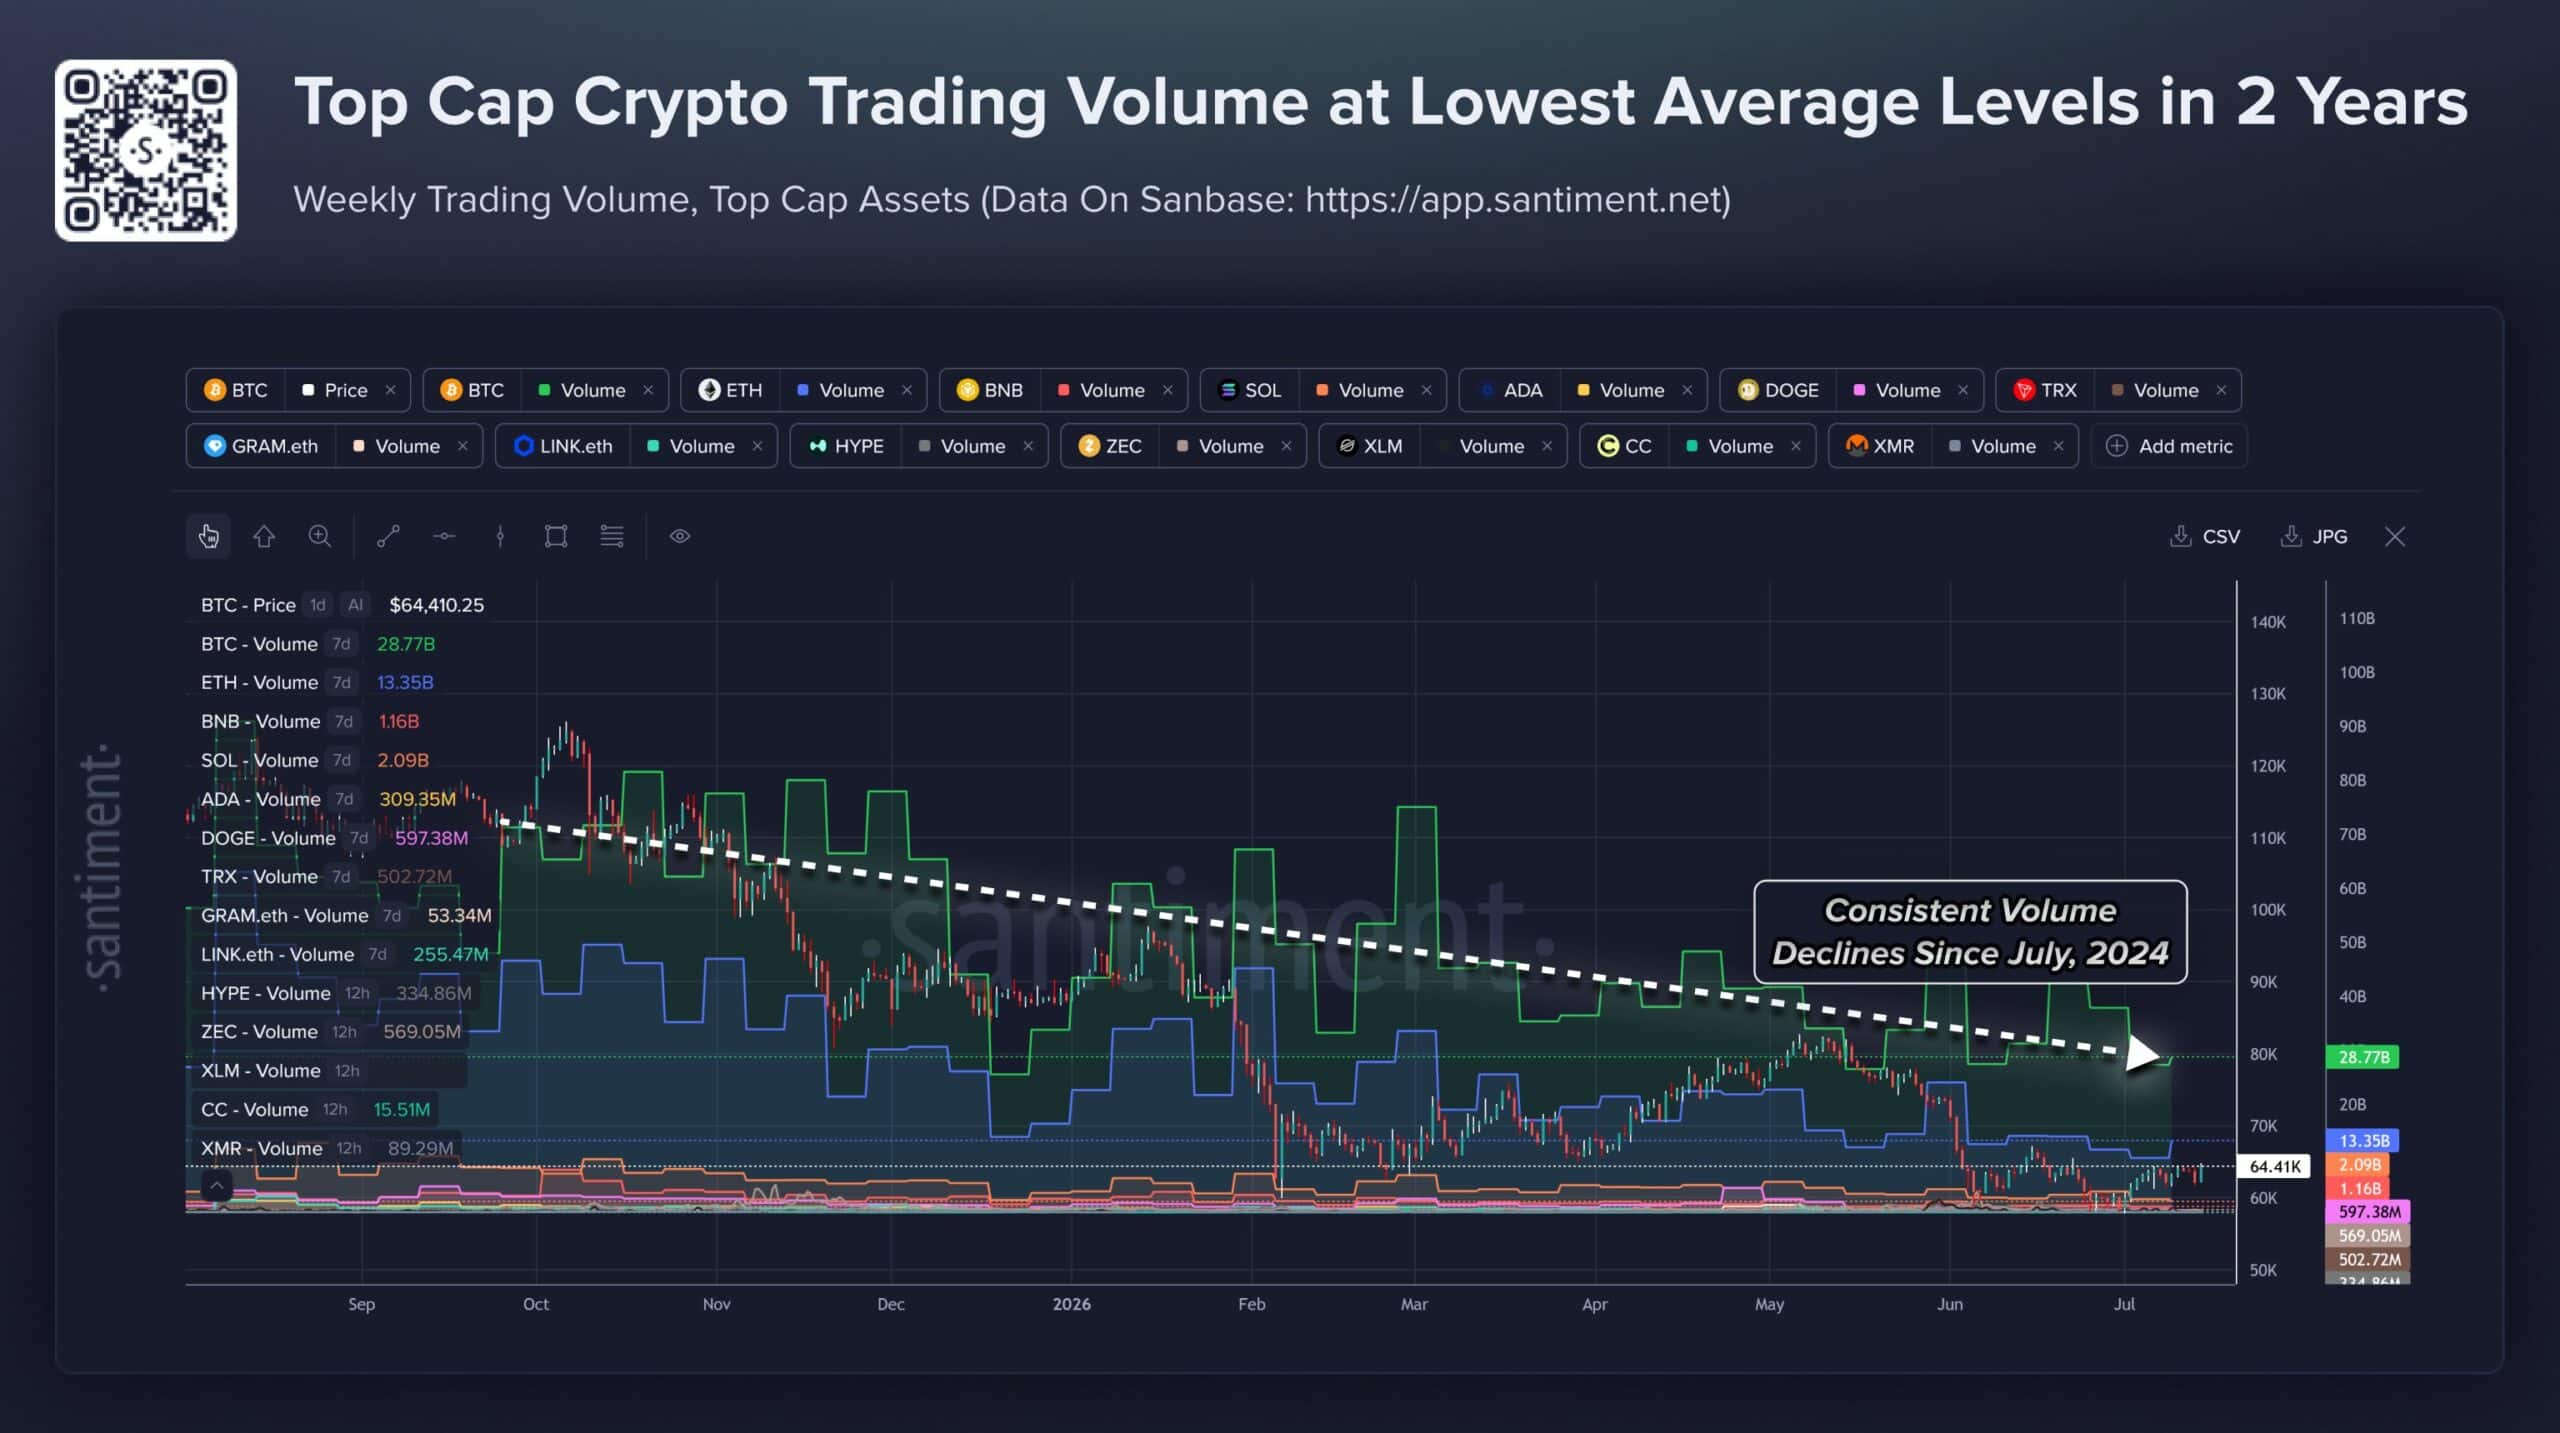
Source: Santiment on X

The trading activity was at its weakest average level in two years. It reflected weak demand and lower market confidence. Market participants are not rotating capital as aggressively, and each sell-off prompts more capital to flee.

Heavy macro pressure, Bitcoin [BTC] spot ETF outflows, and bearish price action since October 2025 for the leading crypto helped explain the dwindling volumes.

Thin liquidity means that reduced demand would mean rallies can be more easily faded. Yet, if seller exhaustion has reached cyclical extremes, a subsequent recovery could be quick, and even modest buying pressure could move prices quickly.

The Solana buying opportunity
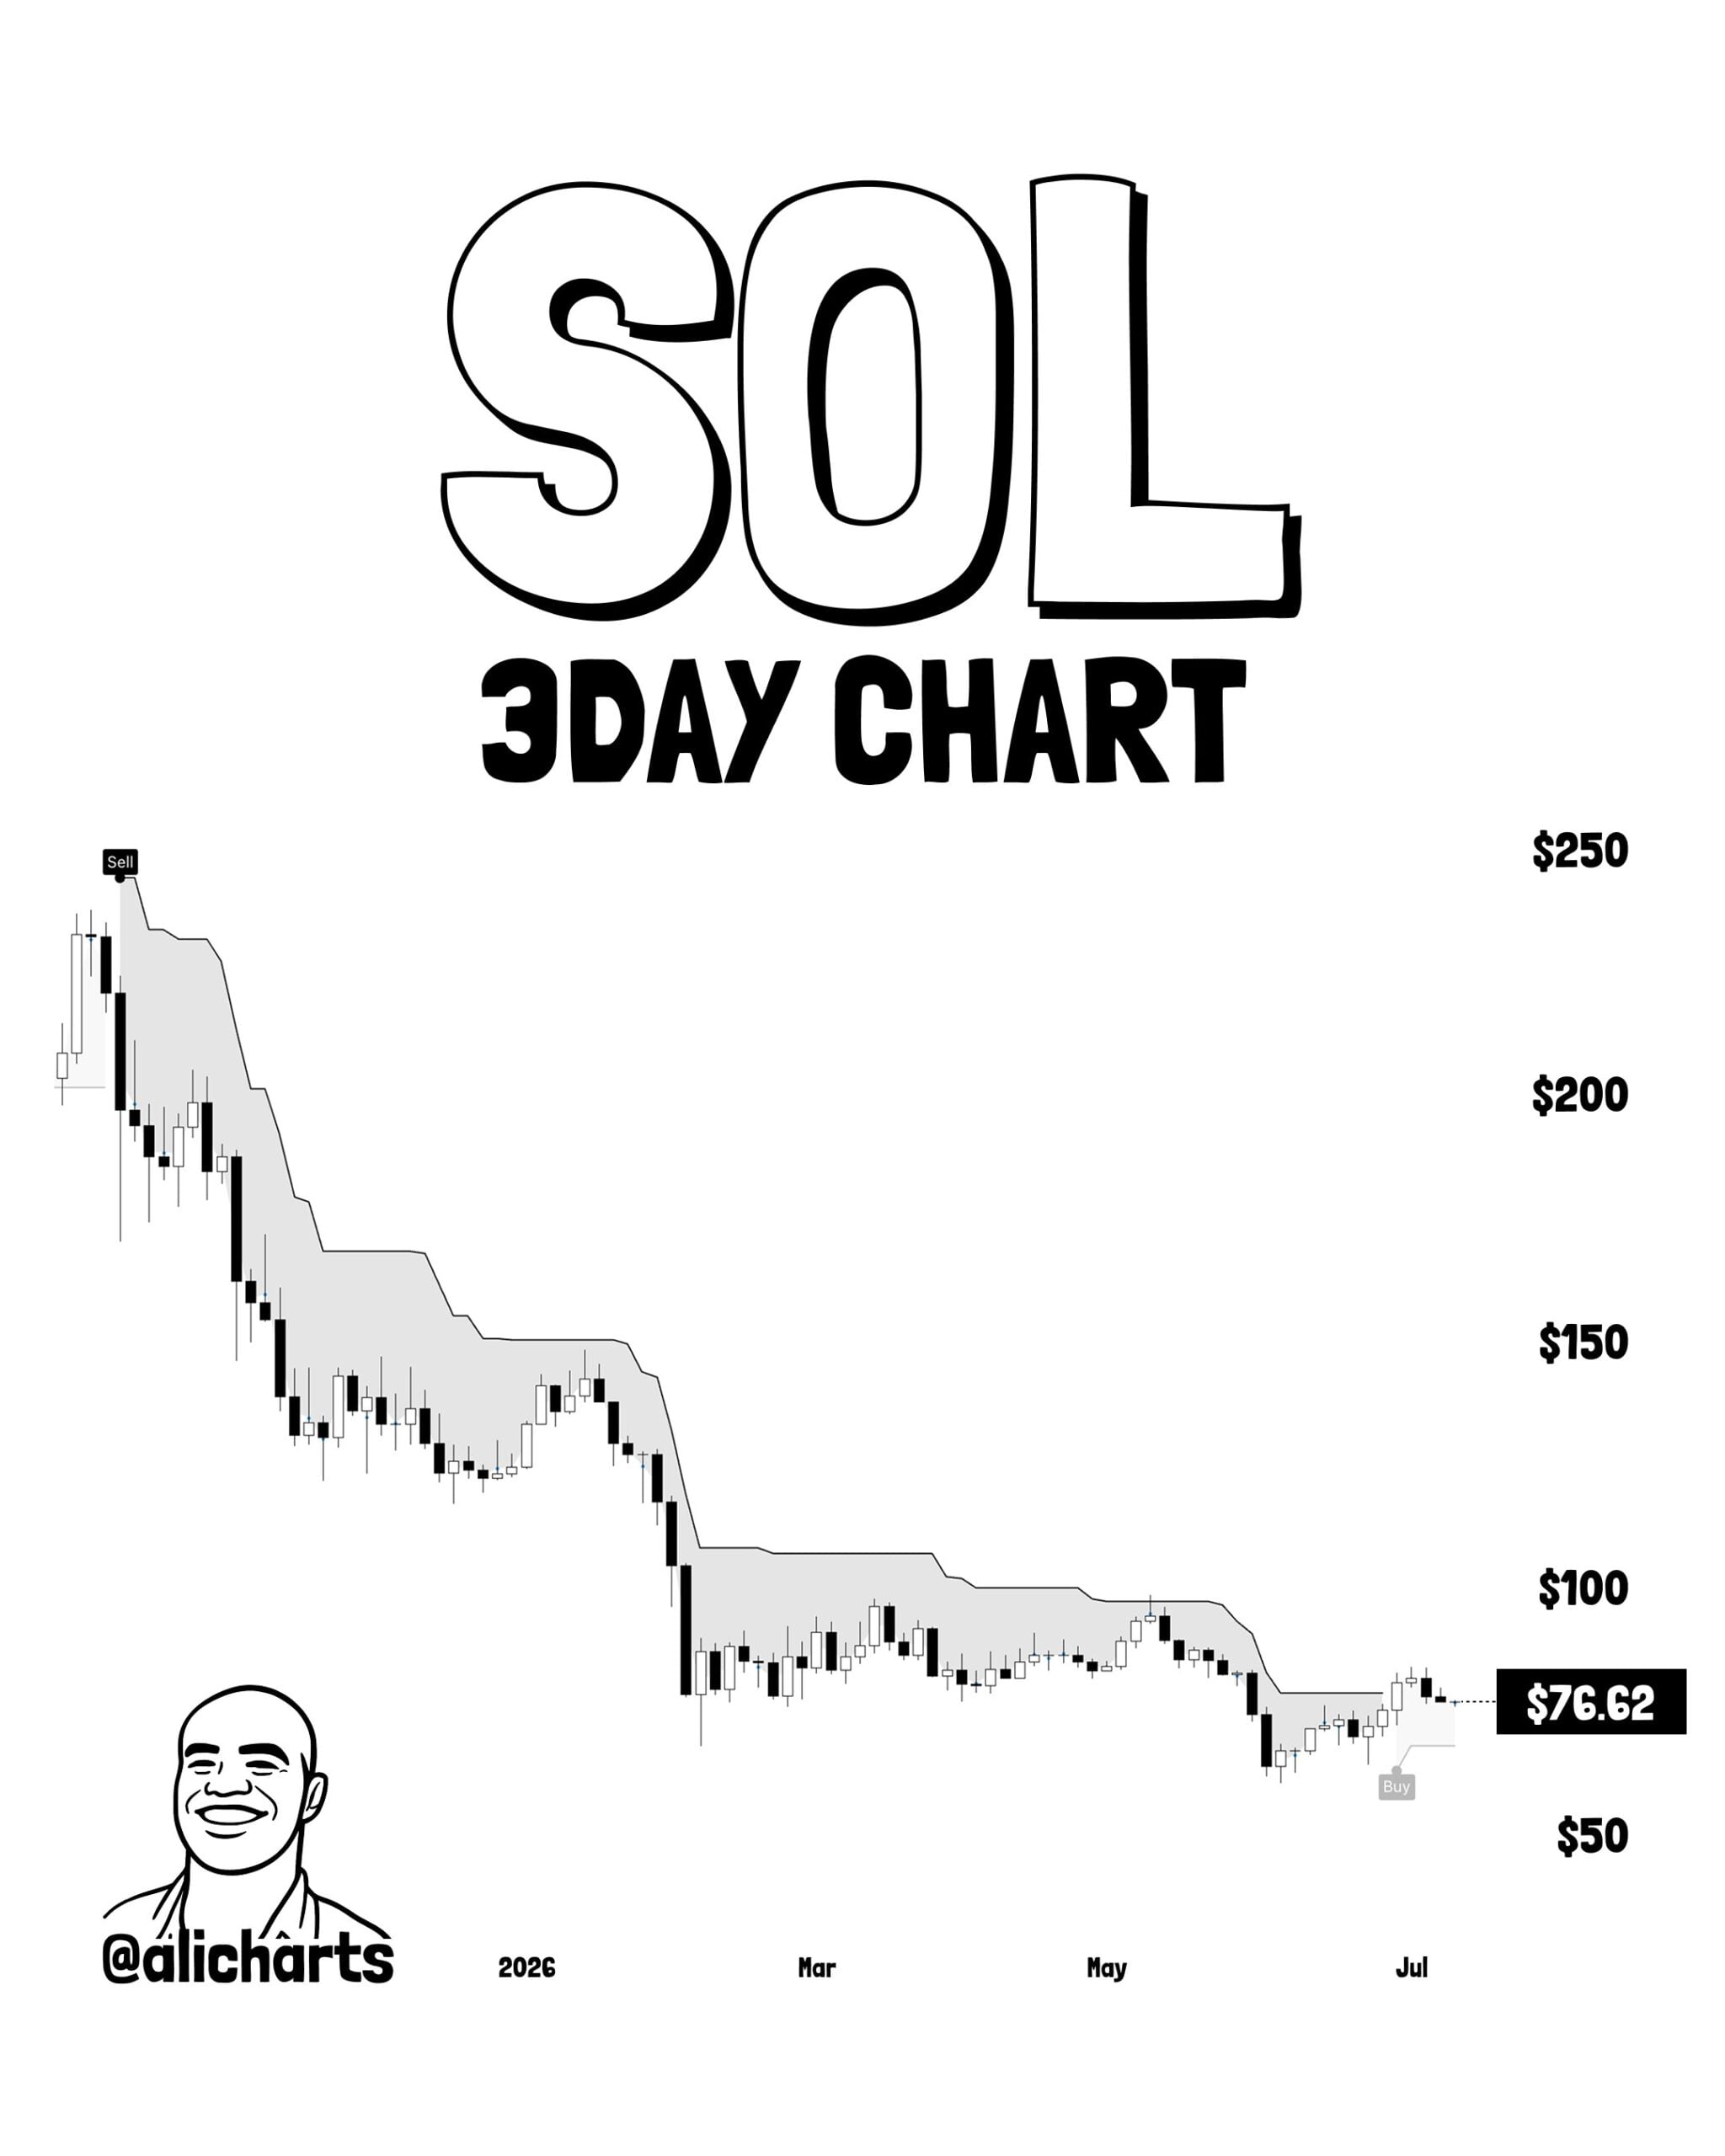
Source: Ali Charts on X

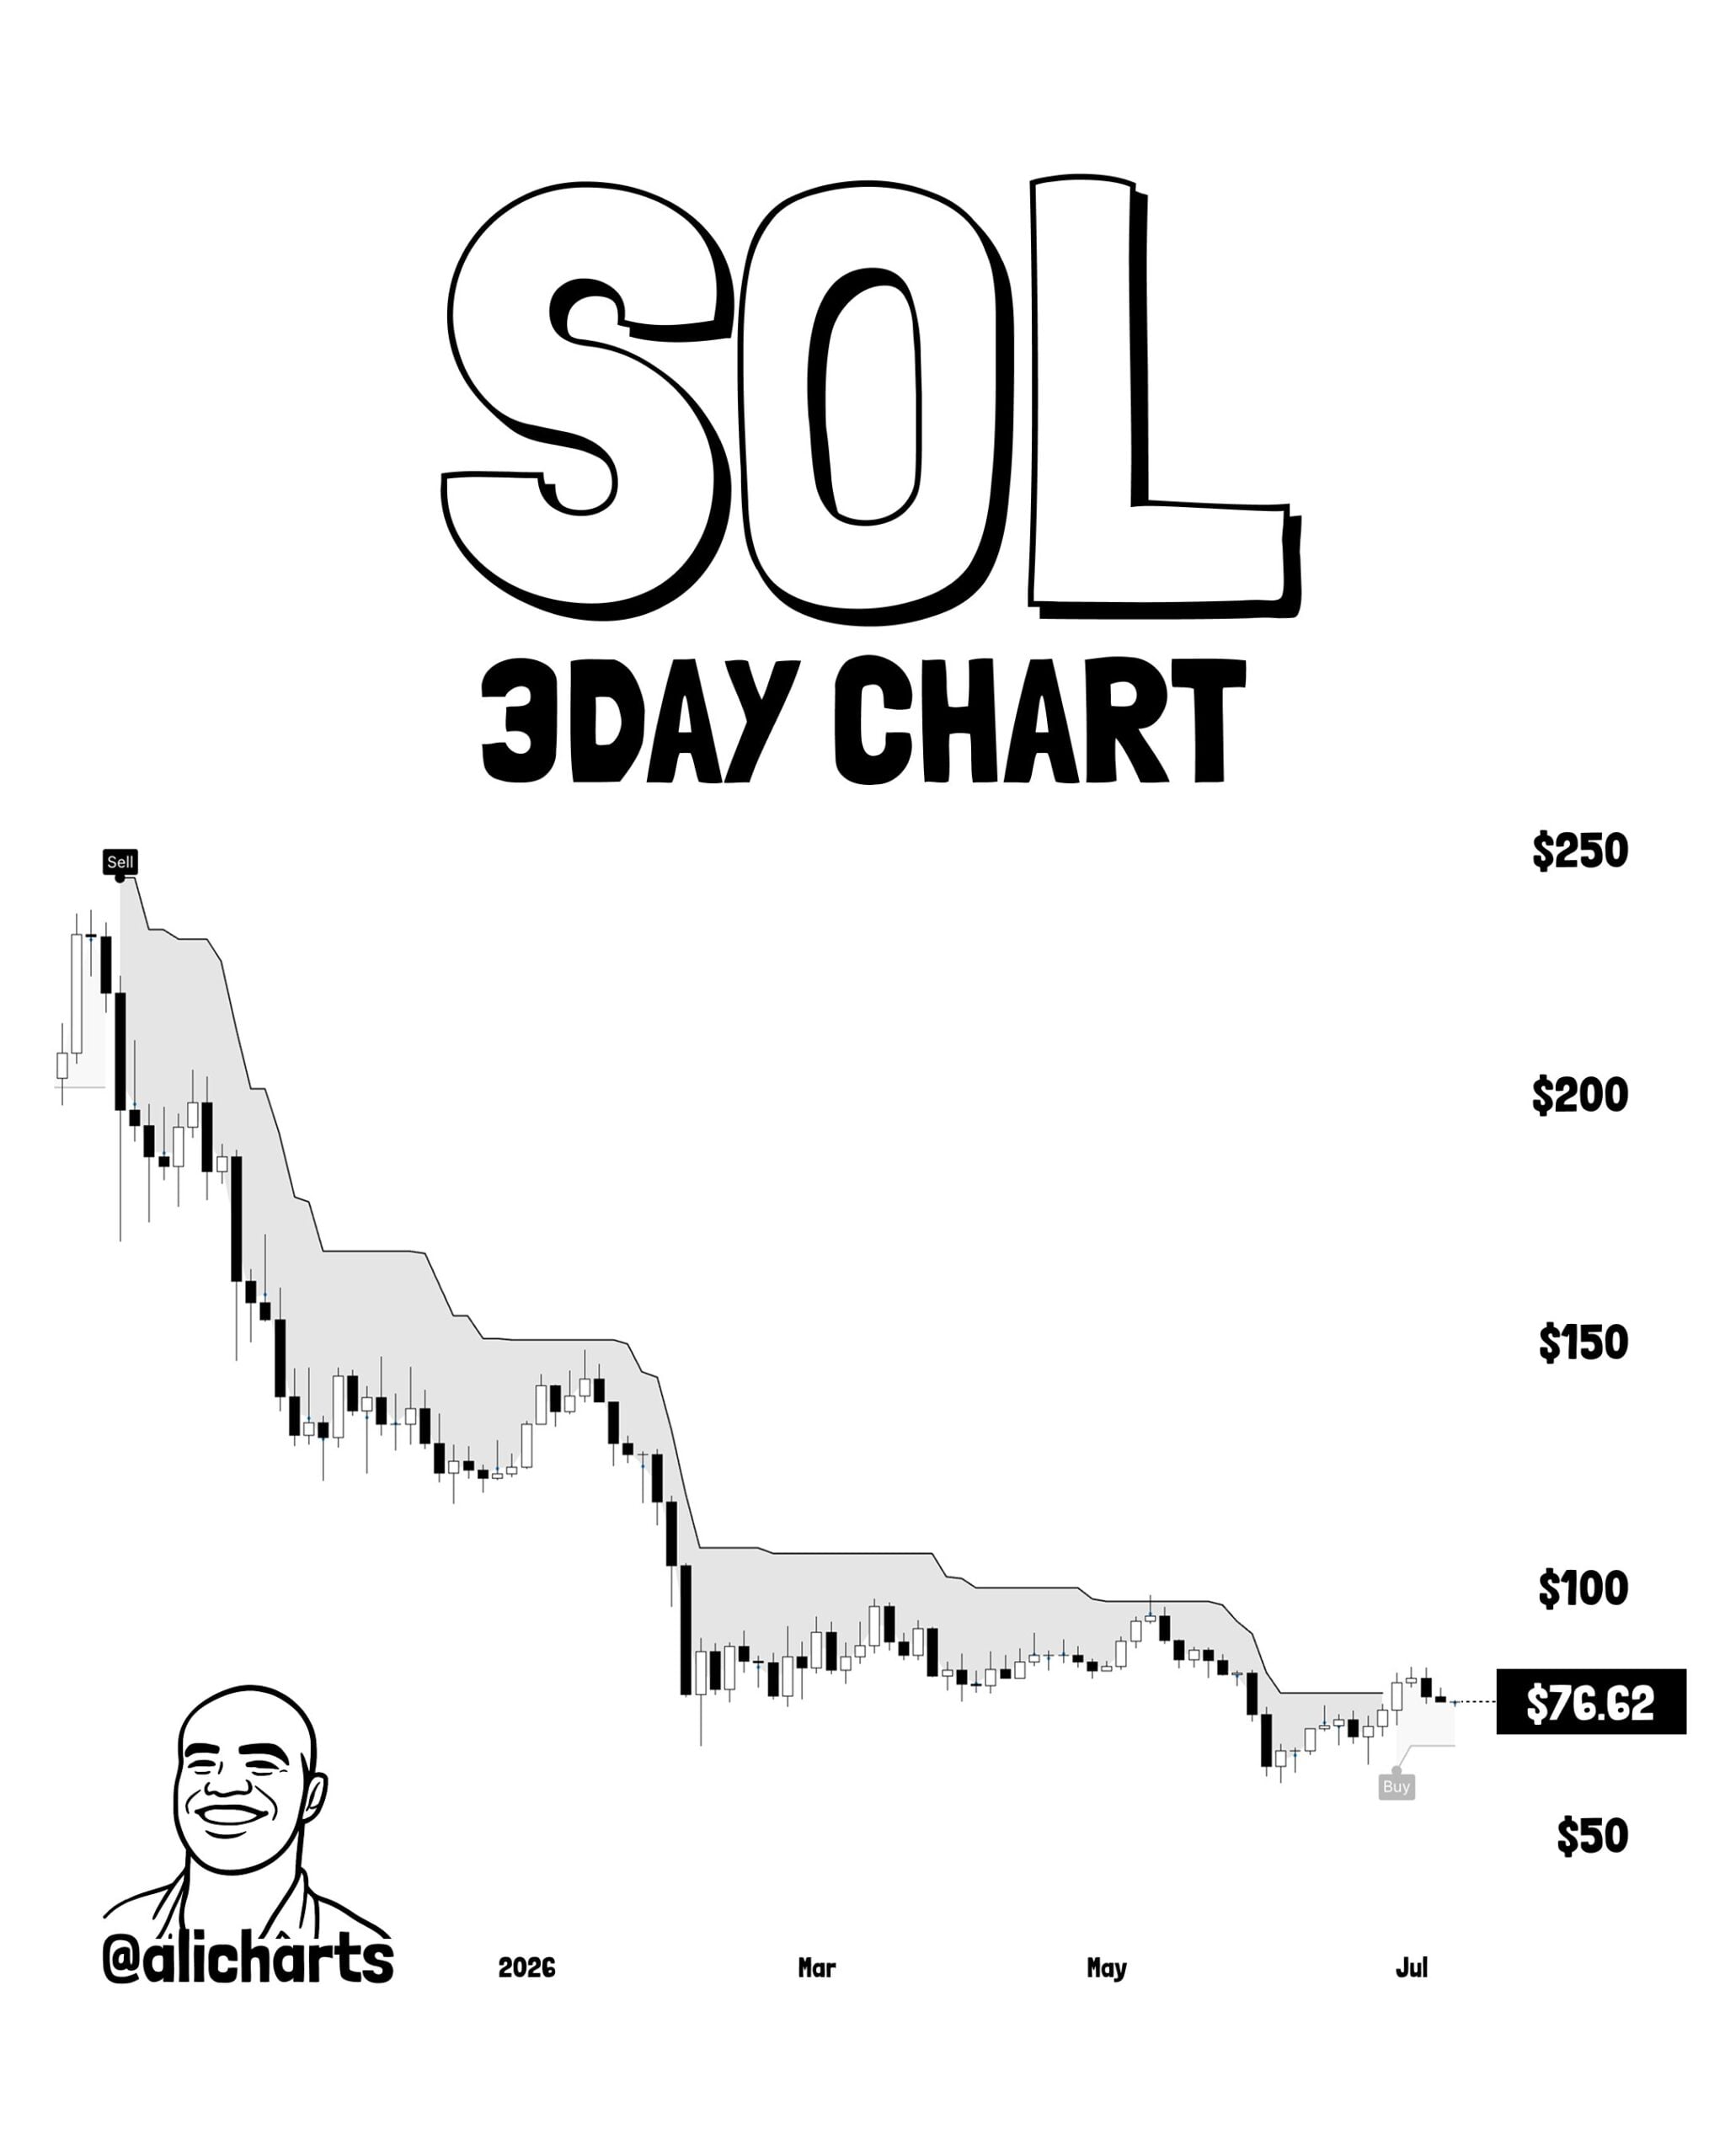
Against this backdrop of reduced volume, Solana [SOL] has turned bullish, according to crypto analyst Ali Martinez. The popular technical analyst used the SuperTrend tool on the 3-day timeframe to show that the ATR trailing stop has flipped bullishly.

This is a buy signal, and the $96 and $121 levels were the next levels to watch out for.

The Hodler Net Position Change metric on Glassnode has been positive throughout 2026. The metric tracks the monthly position change among long-term investors, and positive trends show hodlers were actively adding to their holdings.

SOL still trading within a bearish trend
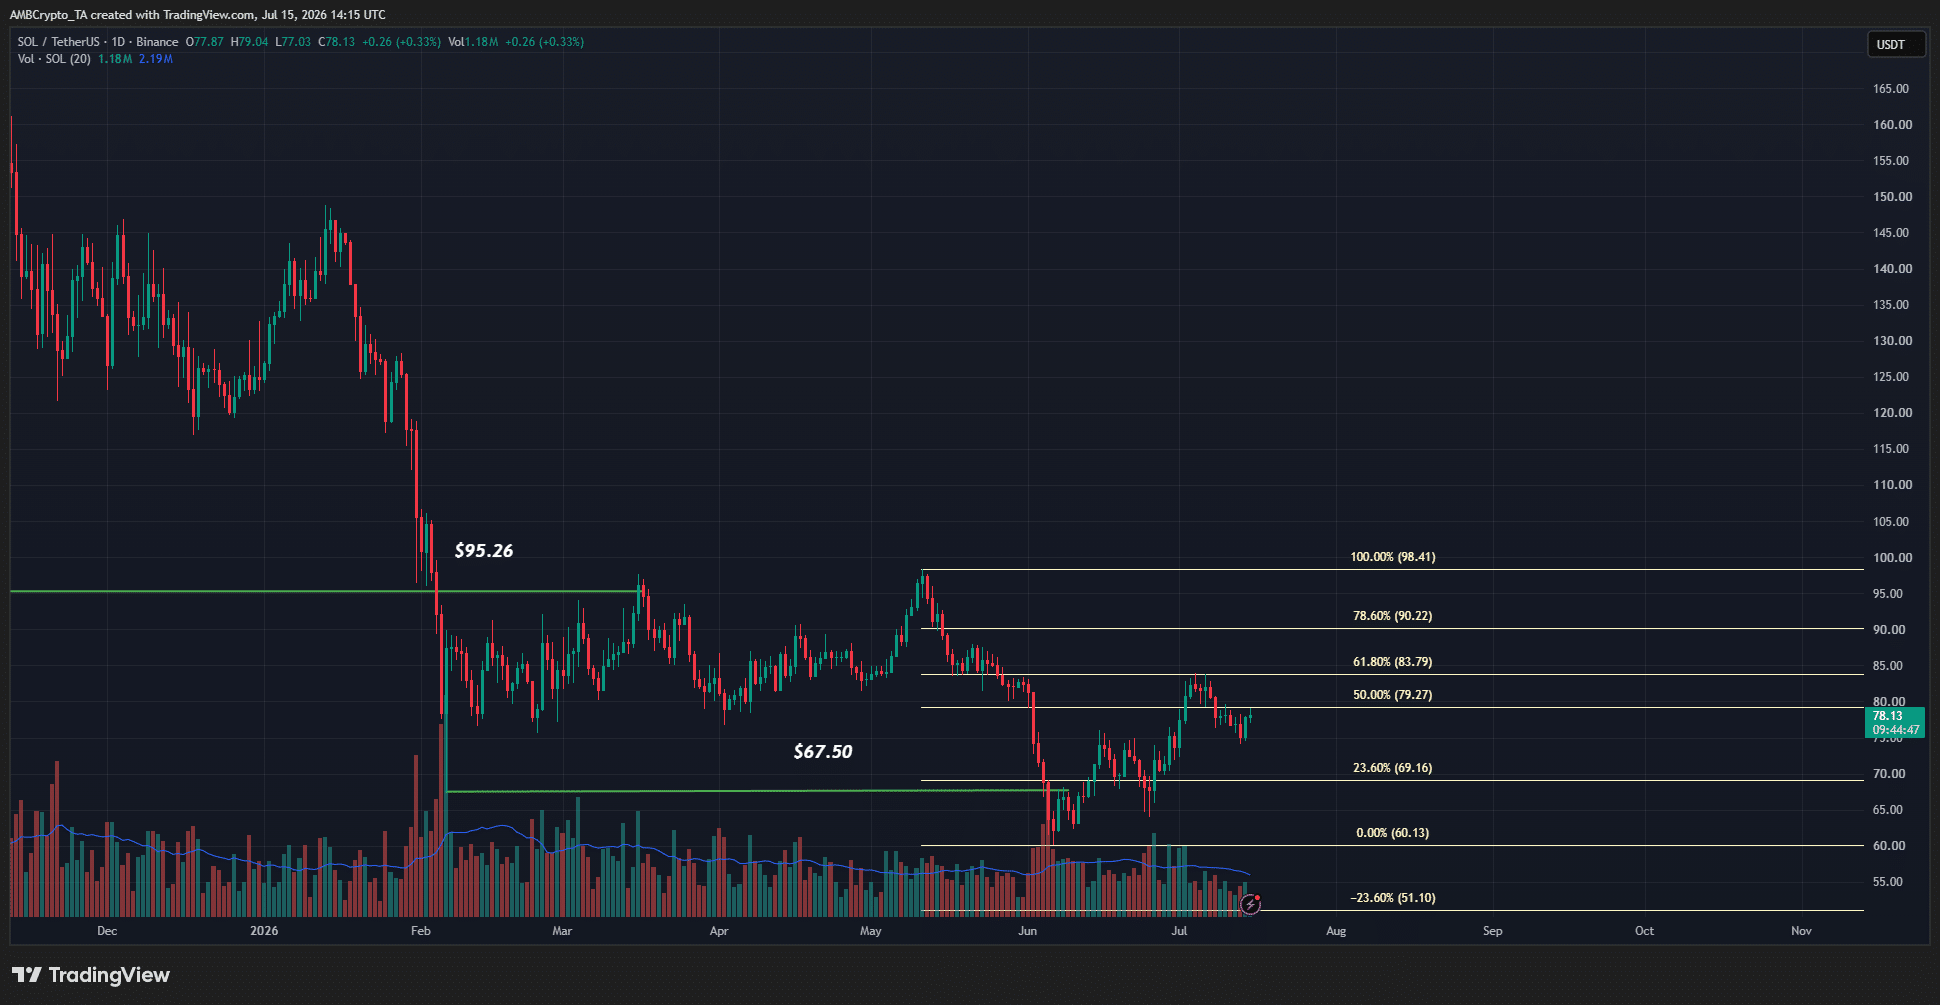
Source: SOL/USDT on TradingView

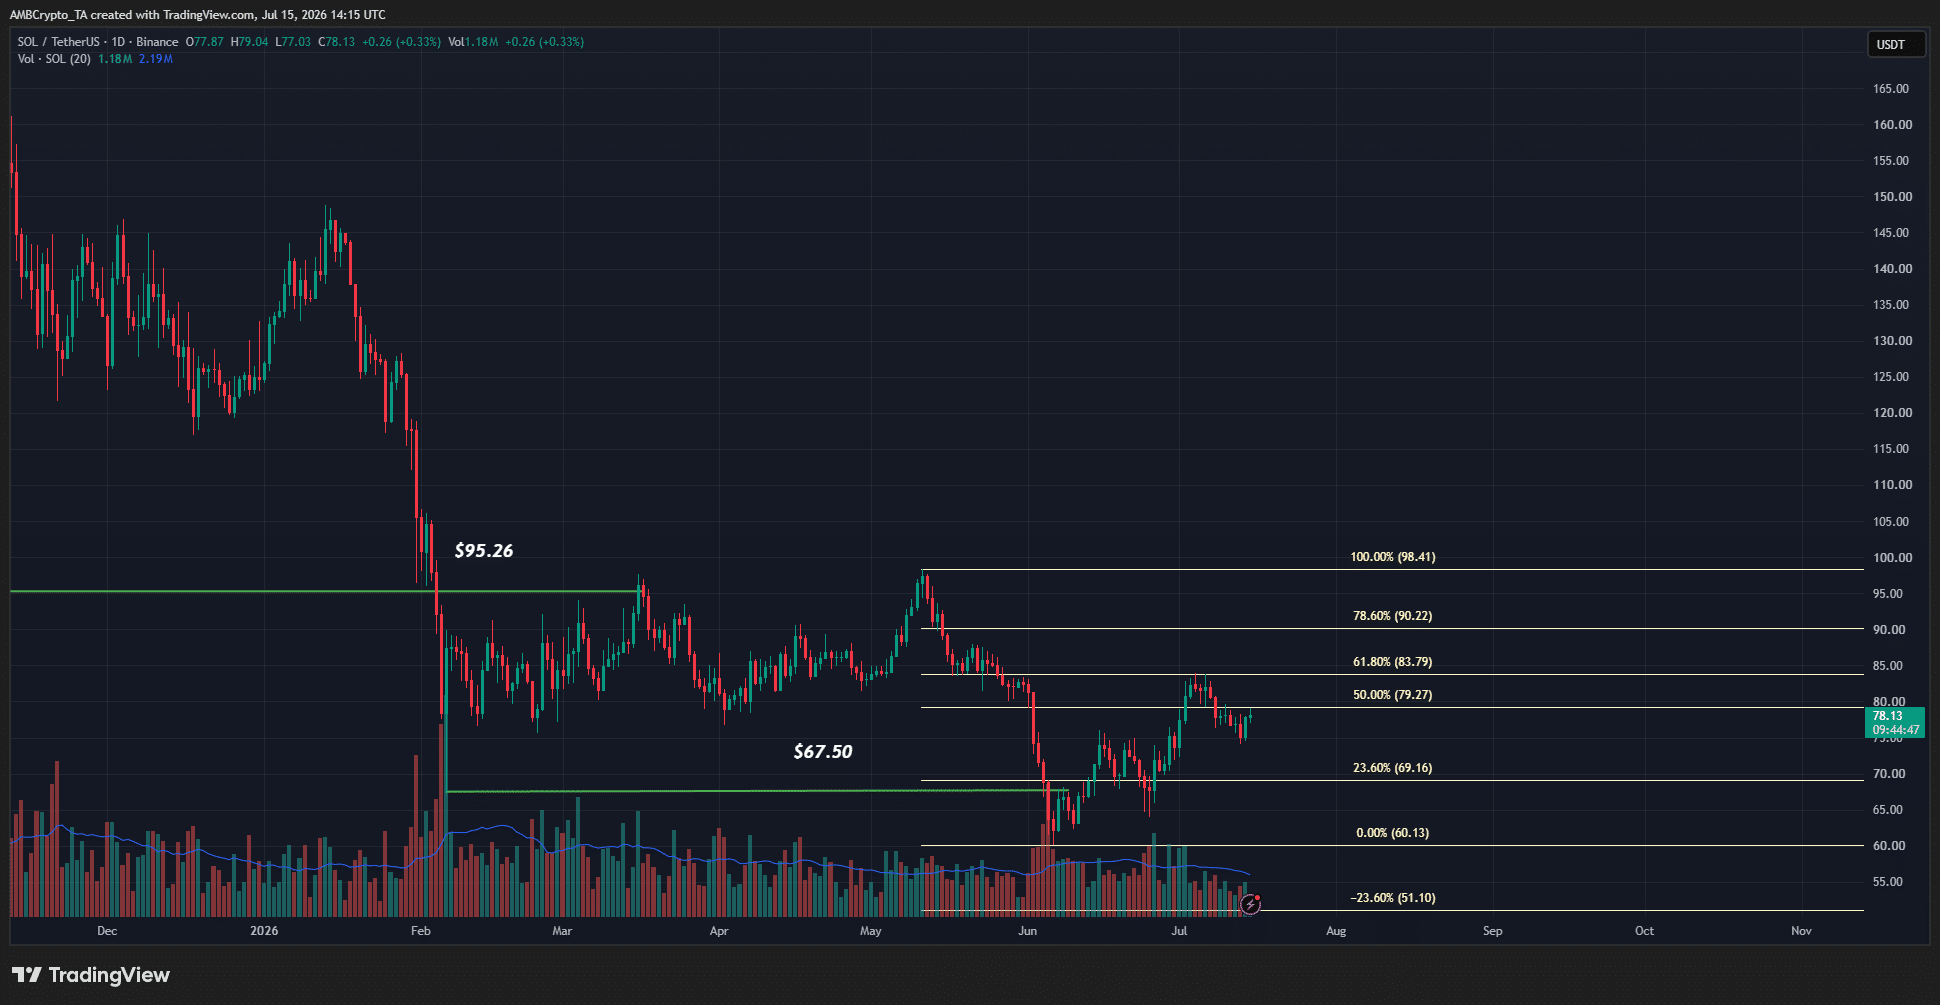
The swing lows at $95.26 and $67.50 were broken earlier this year, keeping the bearish Solana swing structure in place. Based on the drop from $98.41 to $60.13, Fibonacci retracement levels were plotted.

The $83.79 and $90.22 were the key resistance levels to watch out for. Another one was the $116 level, which was the realized price of Solana. Since the market price was well below this level, it showed that the aggregate holder base was facing unrealized losses.

This can prompt a sell-off on subsequent price bounces, making recovery harder until the wider market recovers and attracts greater capital inflows.

Recent selling pressure has also been reinforced by large token movements. A $15.14 million onchain SOL token move from Alameda Research was spotted recently, and the subsequent short-term price move resulted in just over $10 million in long liquidations.


Final Summary

  • The Solana buy signal in recent days and hodler accumulation trends throughout 2026 gave the altcoin a bullish tint.
  • Yet, the price charts and overhead supply zones meant a meaningful recovery would be difficult and requires greater capital inflows.


Crypto di tendenza

Domande pertinenti

QAccording to Ali Martinez, what time frame and indicator were used to identify the bullish buy signal for Solana?

AAccording to crypto analyst Ali Martinez, he used the SuperTrend tool on the 3-day timeframe to identify that the ATR trailing stop had flipped bullishly, signaling a buy signal for Solana.

QWhat are the two key price levels mentioned as next to watch for Solana based on the bullish signal?

ABased on the bullish buy signal, the two key price levels to watch for Solana are $96 and $121.

QWhat does the Hodler Net Position Change metric being positive throughout 2026 indicate about Solana investors?

AThe Hodler Net Position Change metric being positive throughout 2026 indicates that long-term Solana investors (hodlers) were actively adding to their holdings and accumulating throughout that period.

QWhich Fibonacci retracement levels are highlighted as key resistance levels for Solana's price recovery?

AThe Fibonacci retracement levels highlighted as key resistance levels for Solana's price recovery are $83.79, $90.22, and the $116 level (which corresponds to Solana's realized price).

QWhat on-chain event from Alameda Research was mentioned as reinforcing recent selling pressure on Solana?

AA $15.14 million on-chain Solana token move from Alameda Research was mentioned as reinforcing recent selling pressure, which contributed to over $10 million in long liquidations following a short-term price move.

Letture associate

Trading

Spot

Articoli Popolari

Come comprare CHECK

Benvenuto in HTX.com! Abbiamo reso l'acquisto di Checkmate (CHECK) semplice e conveniente. Segui la nostra guida passo passo per intraprendere il tuo viaggio nel mondo delle criptovalute.Step 1: Crea il tuo Account HTXUsa la tua email o numero di telefono per registrarti il tuo account gratuito su HTX. Vivi un'esperienza facile e sblocca tutte le funzionalità,Crea il mio accountStep 2: Vai in Acquista crypto e seleziona il tuo metodo di pagamentoCarta di credito/debito: utilizza la tua Visa o Mastercard per acquistare immediatamente CheckmateCHECK.Bilancio: Usa i fondi dal bilancio del tuo account HTX per fare trading senza problemi.Terze parti: abbiamo aggiunto metodi di pagamento molto utilizzati come Google Pay e Apple Pay per maggiore comodità.P2P: Fai trading direttamente con altri utenti HTX.Over-the-Counter (OTC): Offriamo servizi su misura e tassi di cambio competitivi per i trader.Step 3: Conserva Checkmate (CHECK)Dopo aver acquistato Checkmate (CHECK), conserva nel tuo account HTX. In alternativa, puoi inviare tramite trasferimento blockchain o scambiare per altre criptovalute.Step 4: Scambia Checkmate (CHECK)Scambia facilmente Checkmate (CHECK) nel mercato spot di HTX. Accedi al tuo account, seleziona la tua coppia di trading, esegui le tue operazioni e monitora in tempo reale. Offriamo un'esperienza user-friendly sia per chi ha appena iniziato che per i trader più esperti.

648 Totale visualizzazioniPubblicato il 2026.01.19Aggiornato il 2026.06.02

Come comprare CHECK

Discussioni

Benvenuto nella Community HTX. Qui puoi rimanere informato sugli ultimi sviluppi della piattaforma e accedere ad approfondimenti esperti sul mercato. Le opinioni degli utenti sul prezzo di CHECK CHECK sono presentate come di seguito.

活动图片