Análisis del salto del 16% de Artificial Superintelligence Alliance: ¿Próximo objetivo en $0.30 para FET?

ambcryptoPubblicato 2026-03-24Pubblicato ultima volta 2026-03-24

Introduzione

La Alianza de Superinteligencia Artificial (FET) experimentó un fuerte repunte del 15,5%, alcanzando un máximo local de $0.238 tras defender el nivel de soporte de $0.20. Este impulso se debe a una rotación de capital hacia el sector de criptomonedas de inteligencia artificial, con flujos netos negativos en exchanges (-1,5 millones de FET), lo que redujo las reservas a mínimos de 2024 e indicó una menor presión de venta. Aunque los indicadores técnicos (como el cruce de medias móviles y el MACD alcista) sugieren un momentum positivo y un posible objetivo en $0.30, las ballenas mantienen presión vendedora en el rango de $0.20-$0.22, lo que podría frenar el avance y llevar el precio nuevamente hacia $0.20 si la demanda no se mantiene.

En medio del resurgimiento más amplio del mercado de criptomonedas, Artificial Superintelligence Alliance realizó un fuerte cambio de tendencia. Después de una semana de movimiento lateral, FET finalmente defendió el nivel de $0.20 y subió a un máximo local de $0.239 antes de retroceder ligeramente.

Al momento de escribir este artículo, Artificial Superintelligence Alliance [FET] cotizaba a $0.238, un aumento del 15.5% en los gráficos diarios. Con el aumento de precio, la altcoin superó sus promedios móviles de 9 días, reflejando un fuerte impulso alcista.

FET experimentó una fuerza general del sector, ya que los tokens de IA obtuvieron ganancias considerables, con todas las principales monedas de IA, incluyendo TAO y Render, repuntando.

Por lo tanto, el mercado muestra un sentimiento positivo renovado en la narrativa de IA, impulsando una entrada significativa de capital al sector. FET, junto con otras monedas de IA, experimentó una fuerte demanda especulativa.

FET experimenta una rotación de capital renovada

En medio de una rotación de capital en todo el sector, FET vio entradas masivas de capital a medida que los compradores tardíos se apresuraban a entrar al mercado para posicionarse.

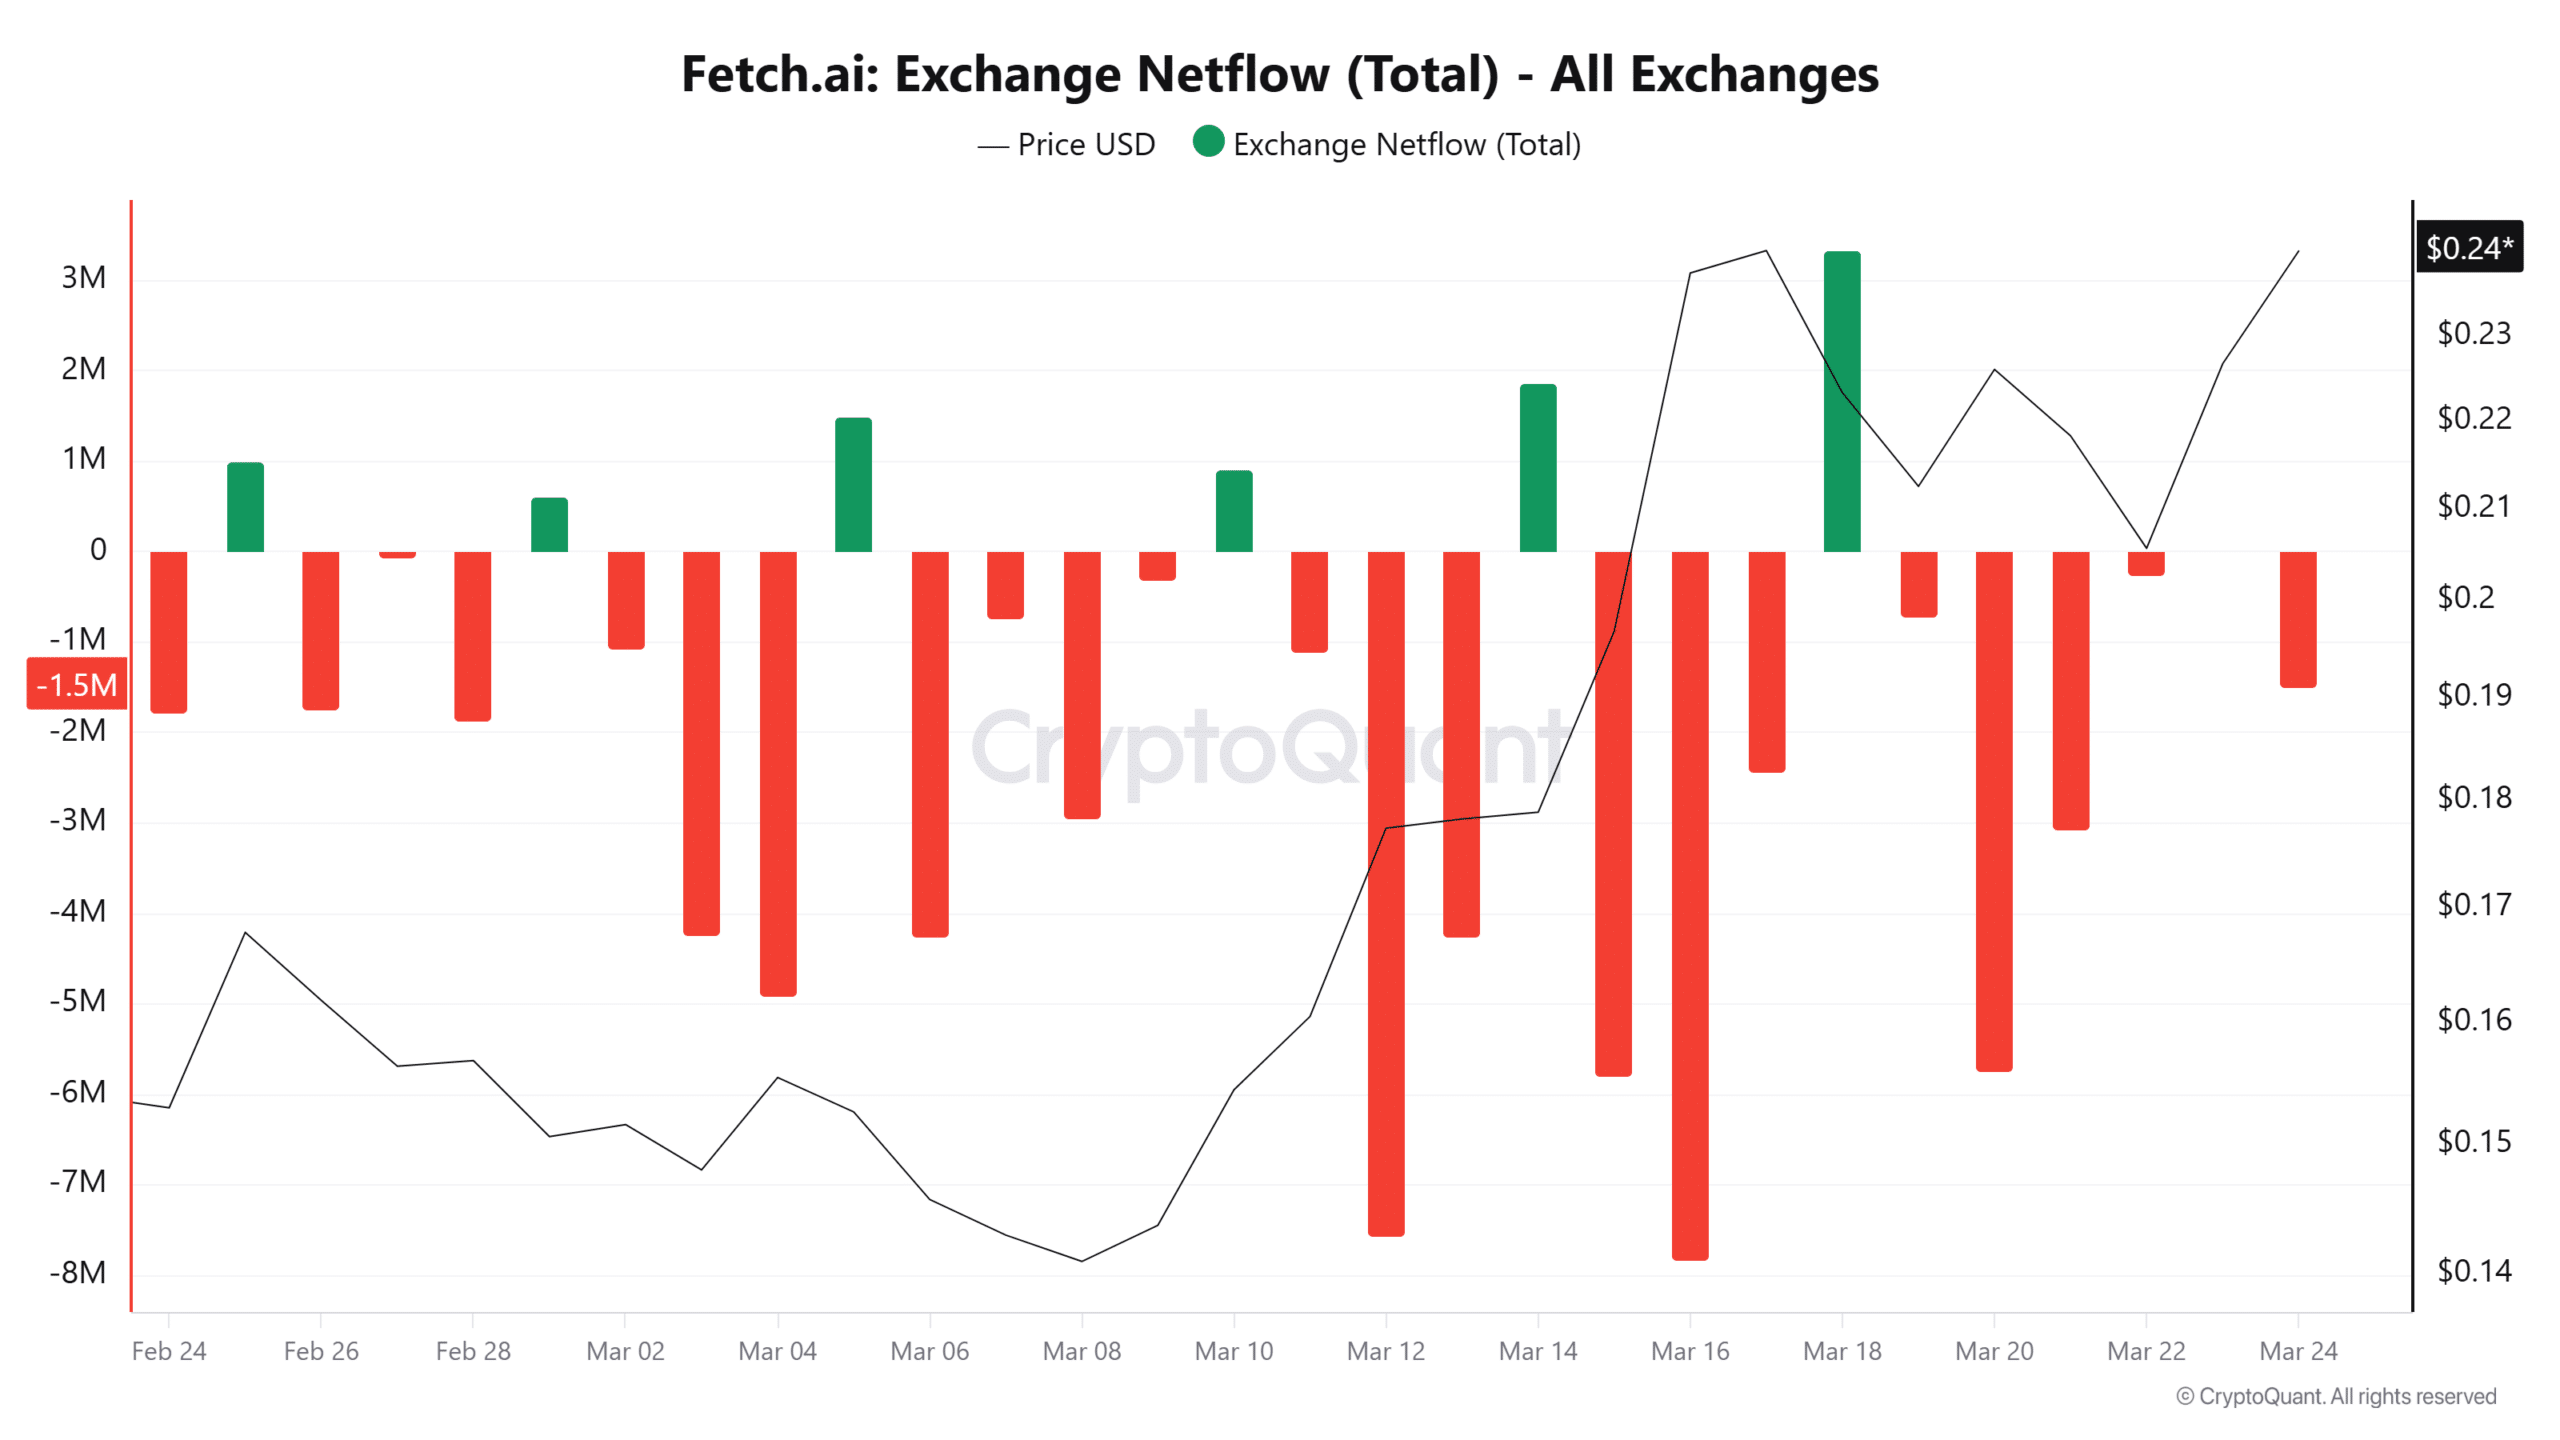
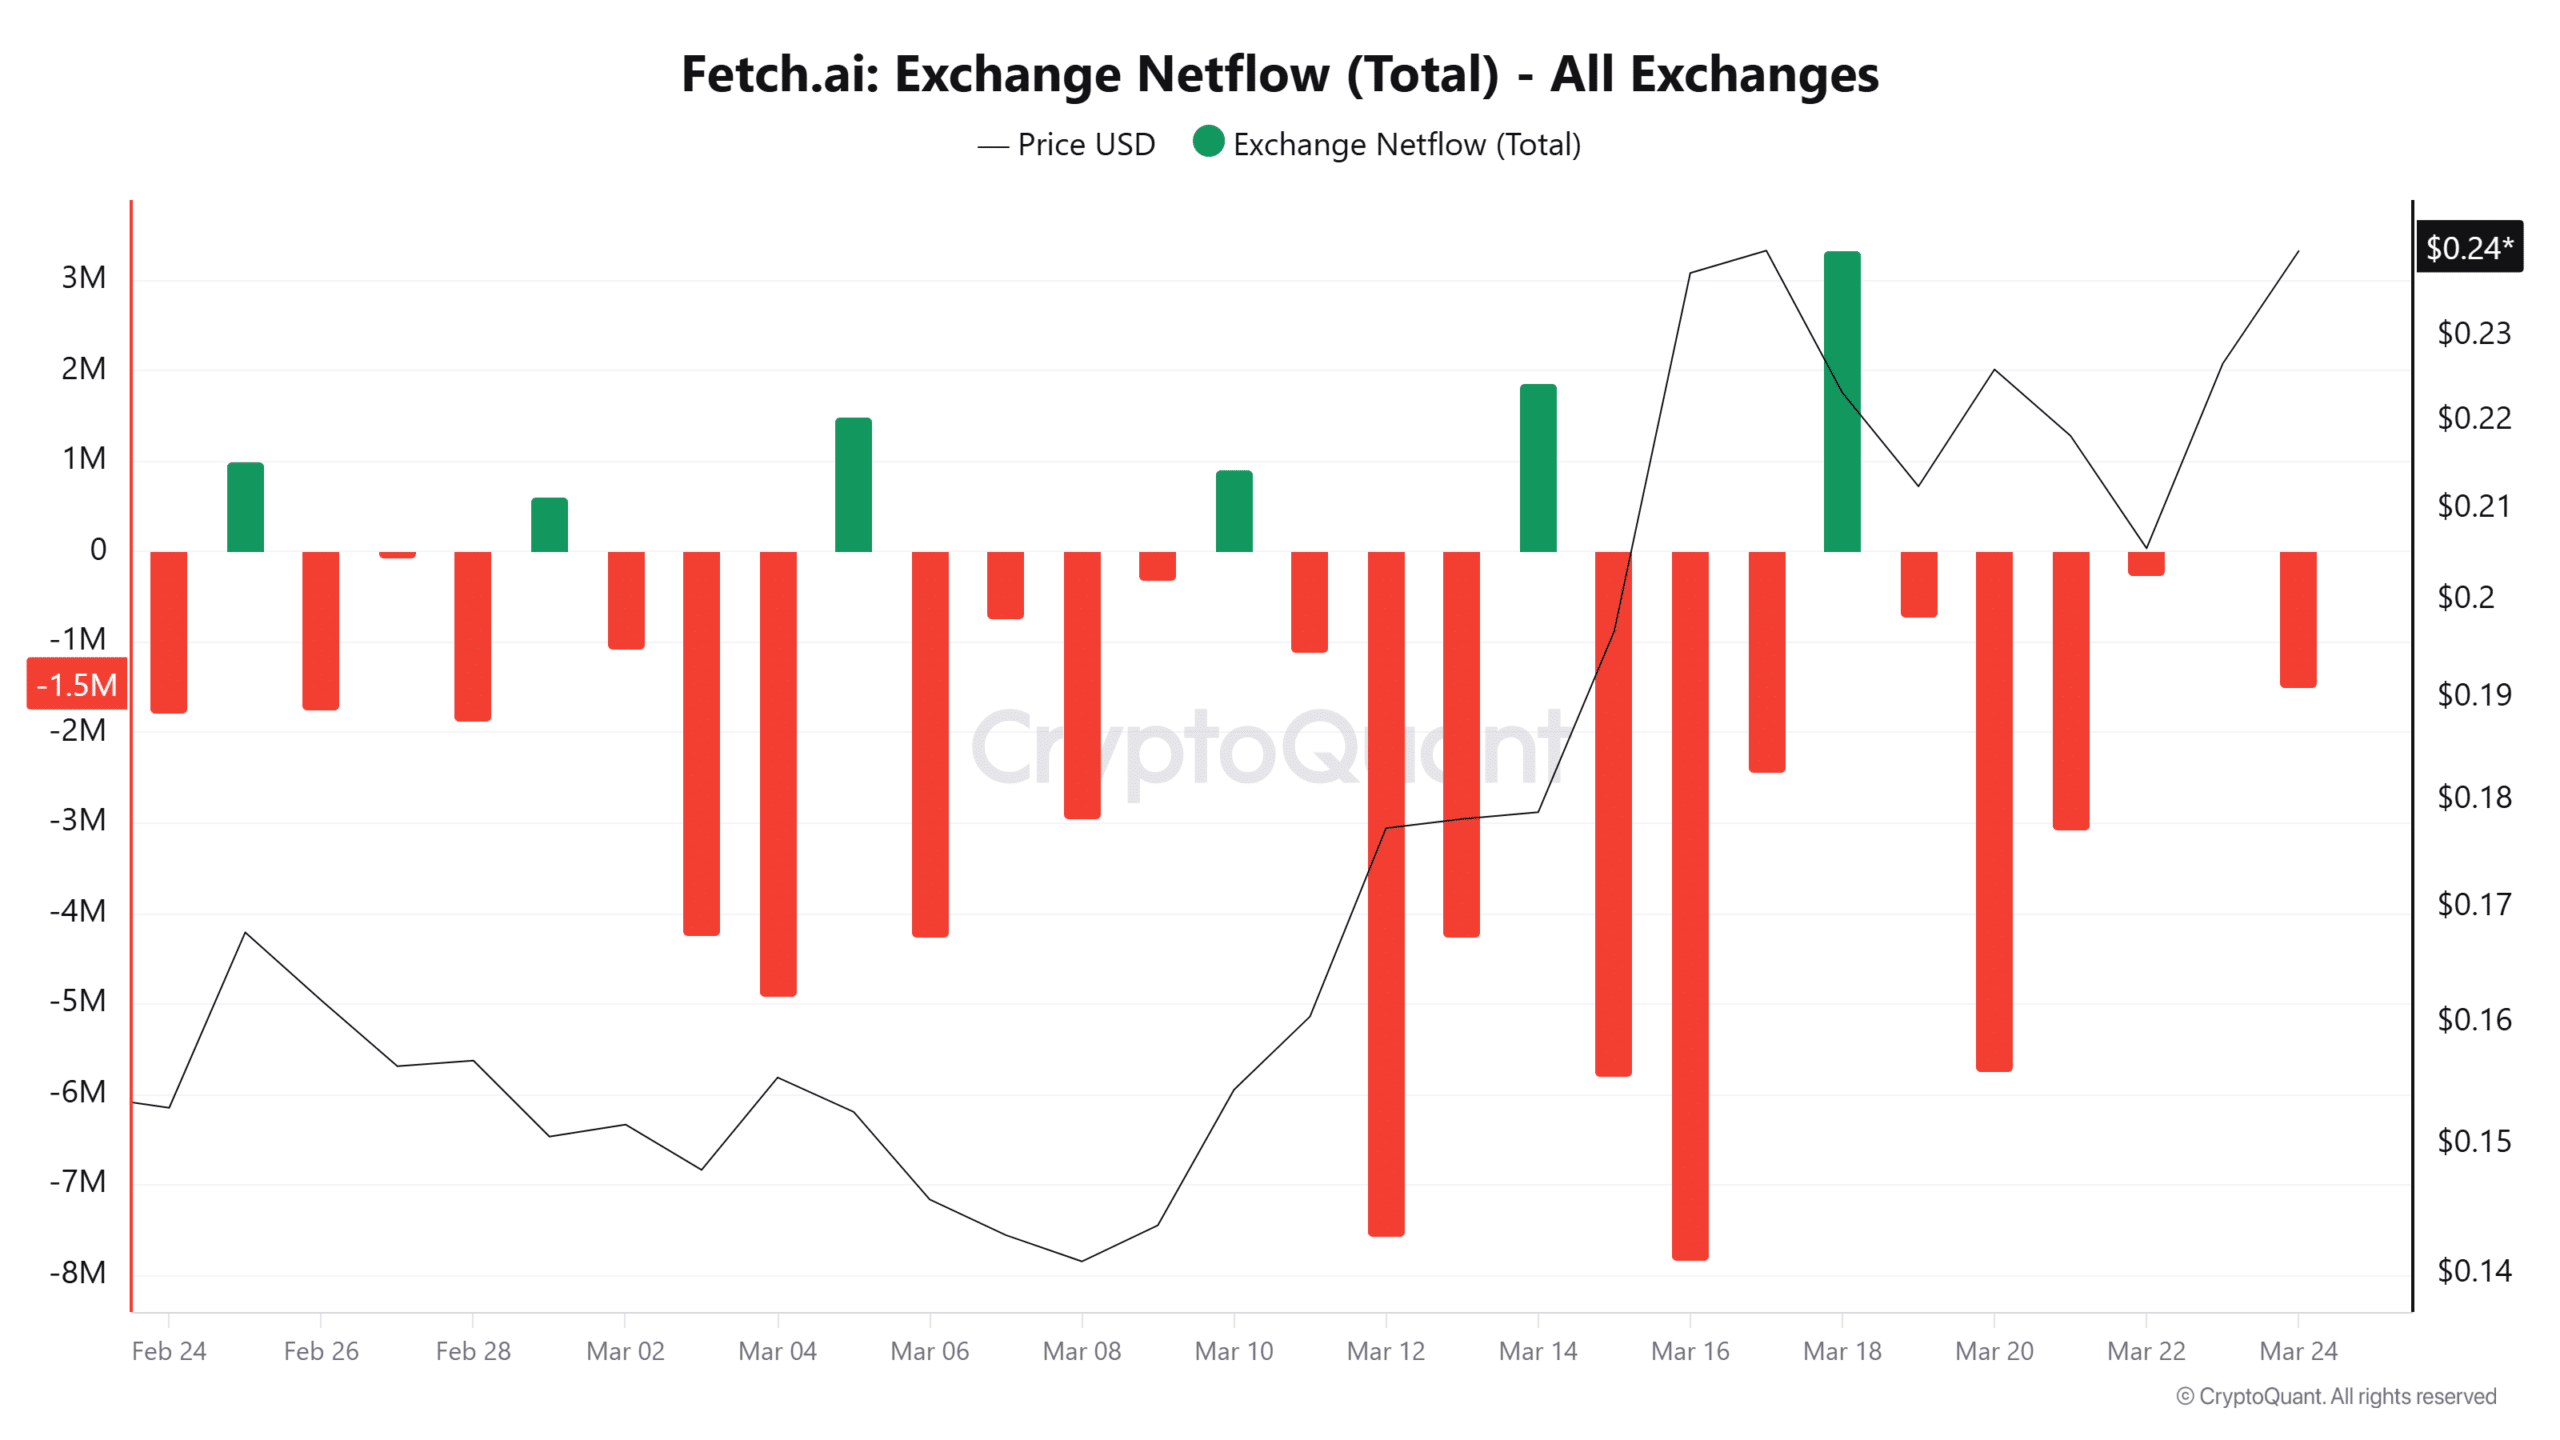
En las últimas 24 horas, más de 17.7 millones de FET salieron de los exchanges, en comparación con 16.2 millones de entradas. Como resultado, el Netflow de Exchange de la altcoin cayó a -1.5 millones, una disminución significativa desde los 7k del día anterior.
Fuente: CryptoQuant

Tal cambio de tendencia indicó un cambio significativo en el sentimiento del mercado, con compradores superando a vendedores.

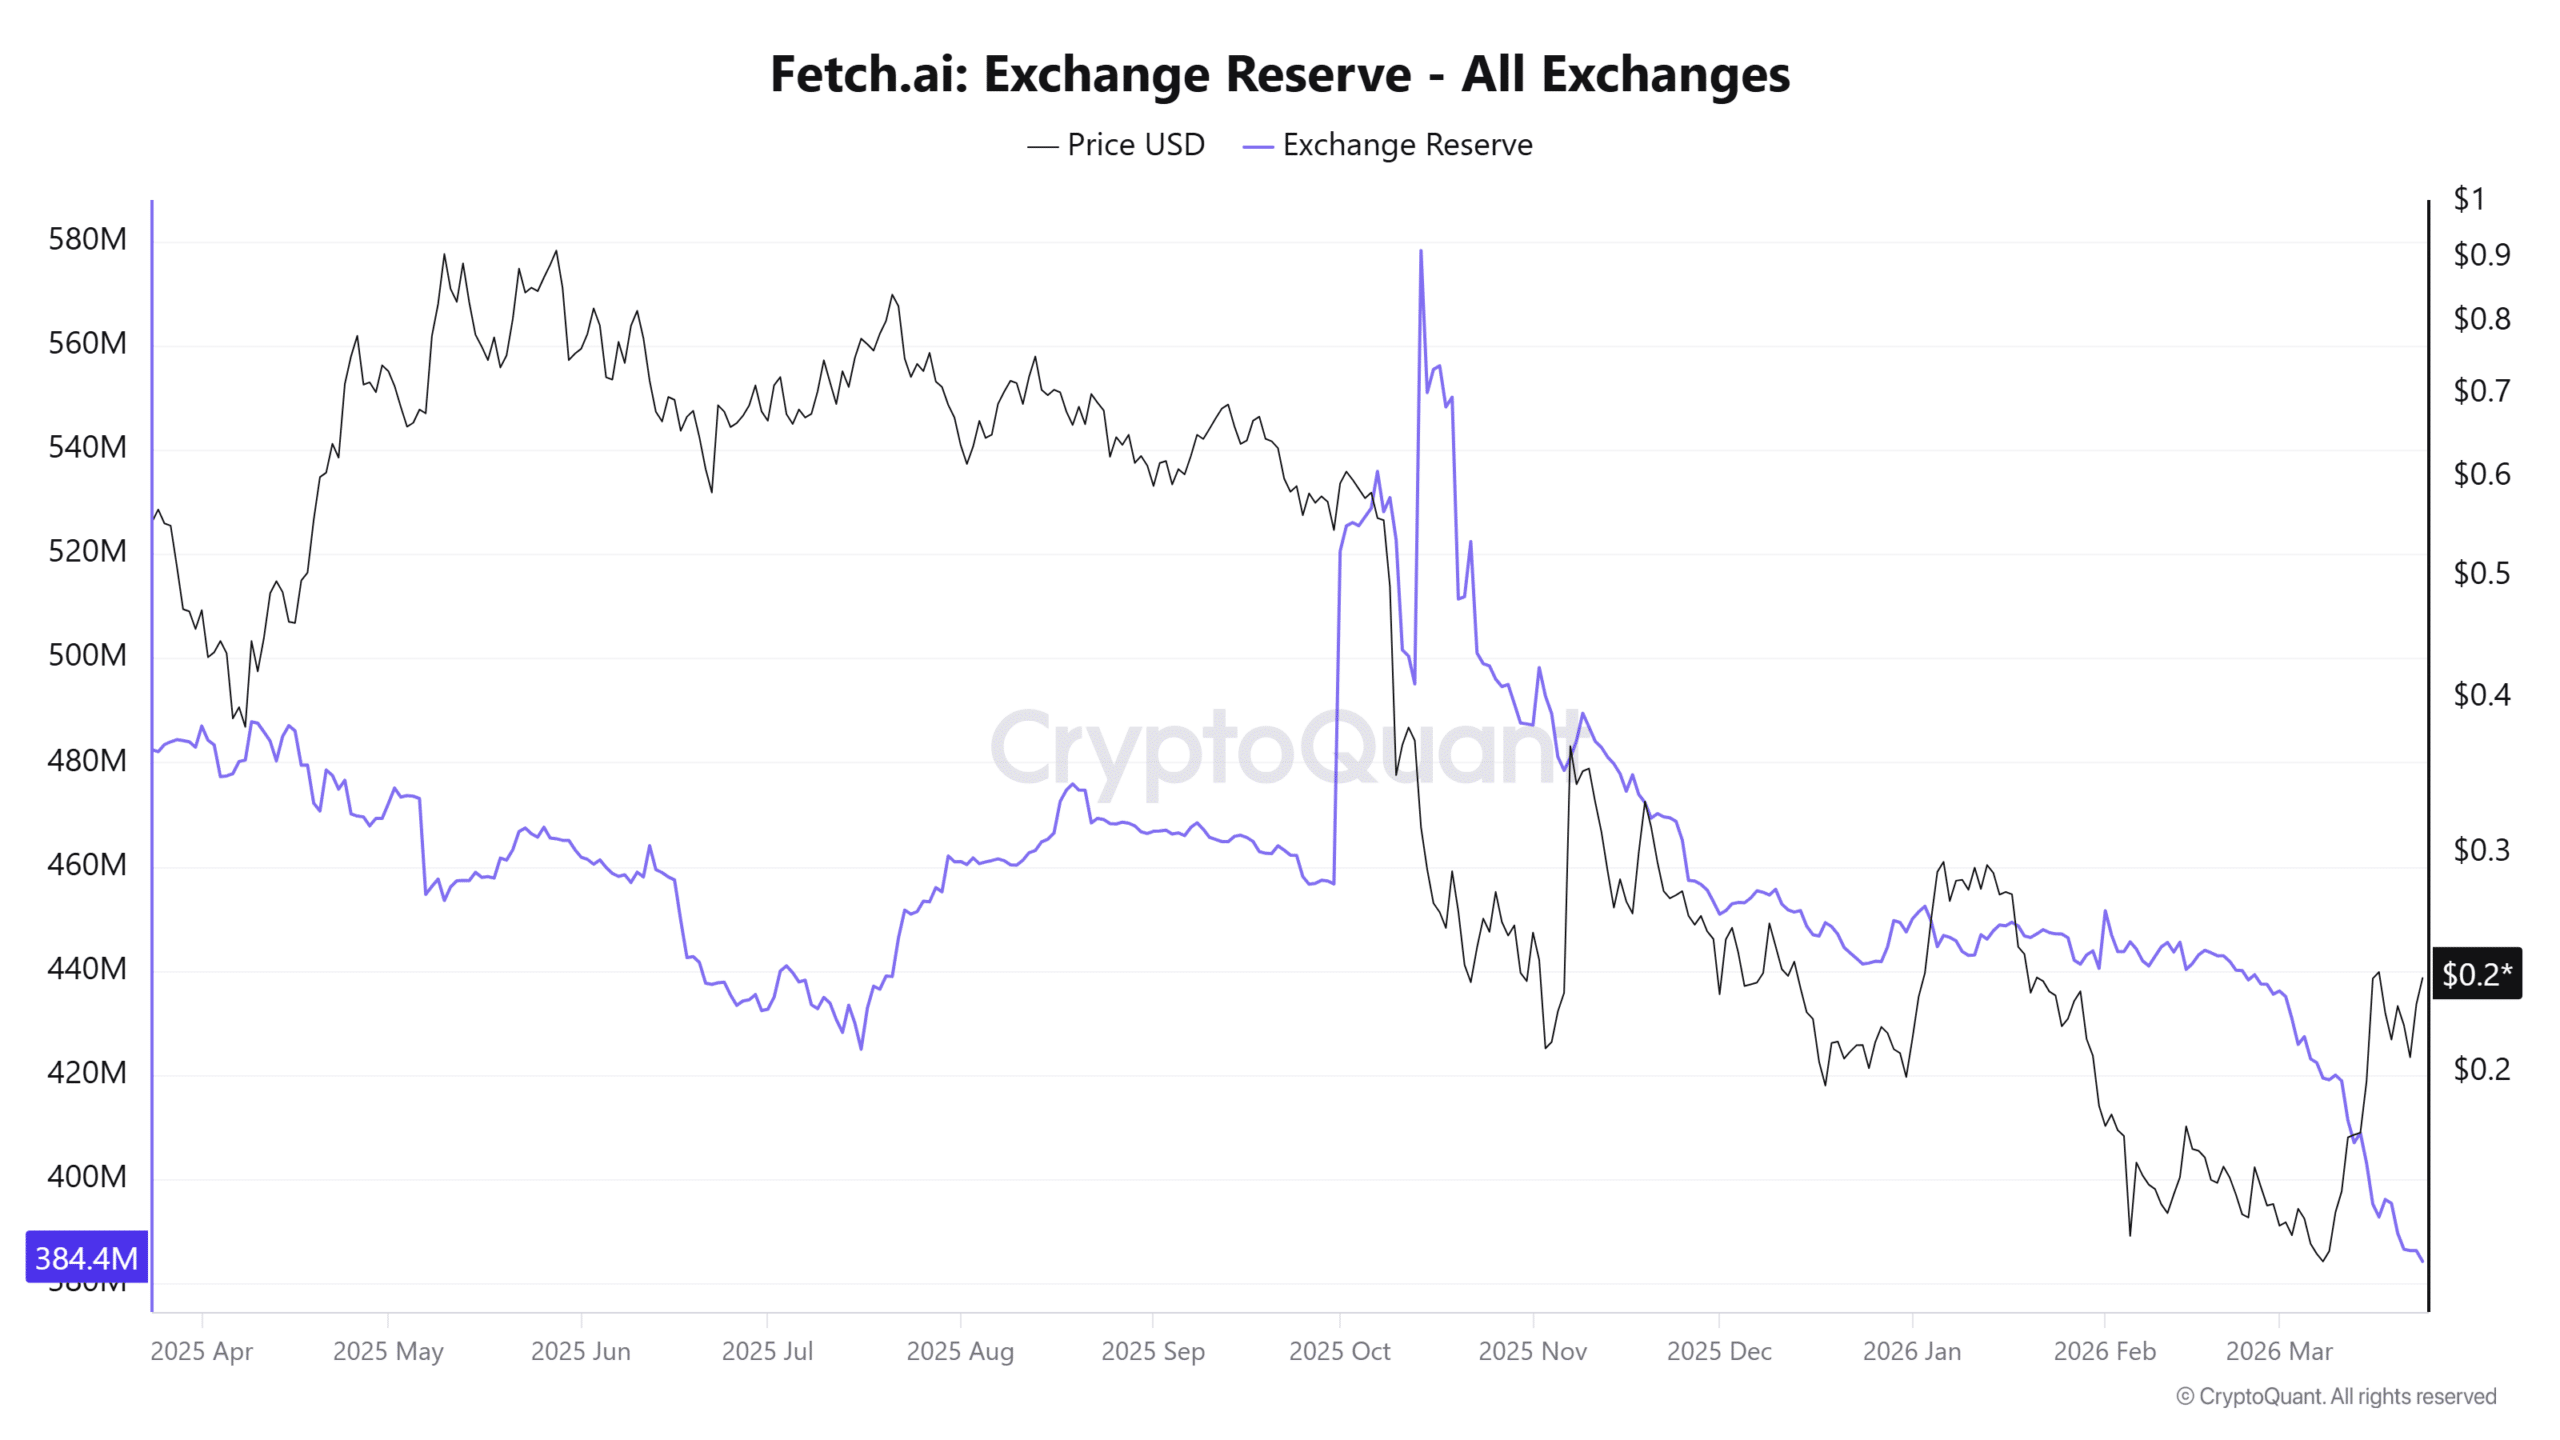
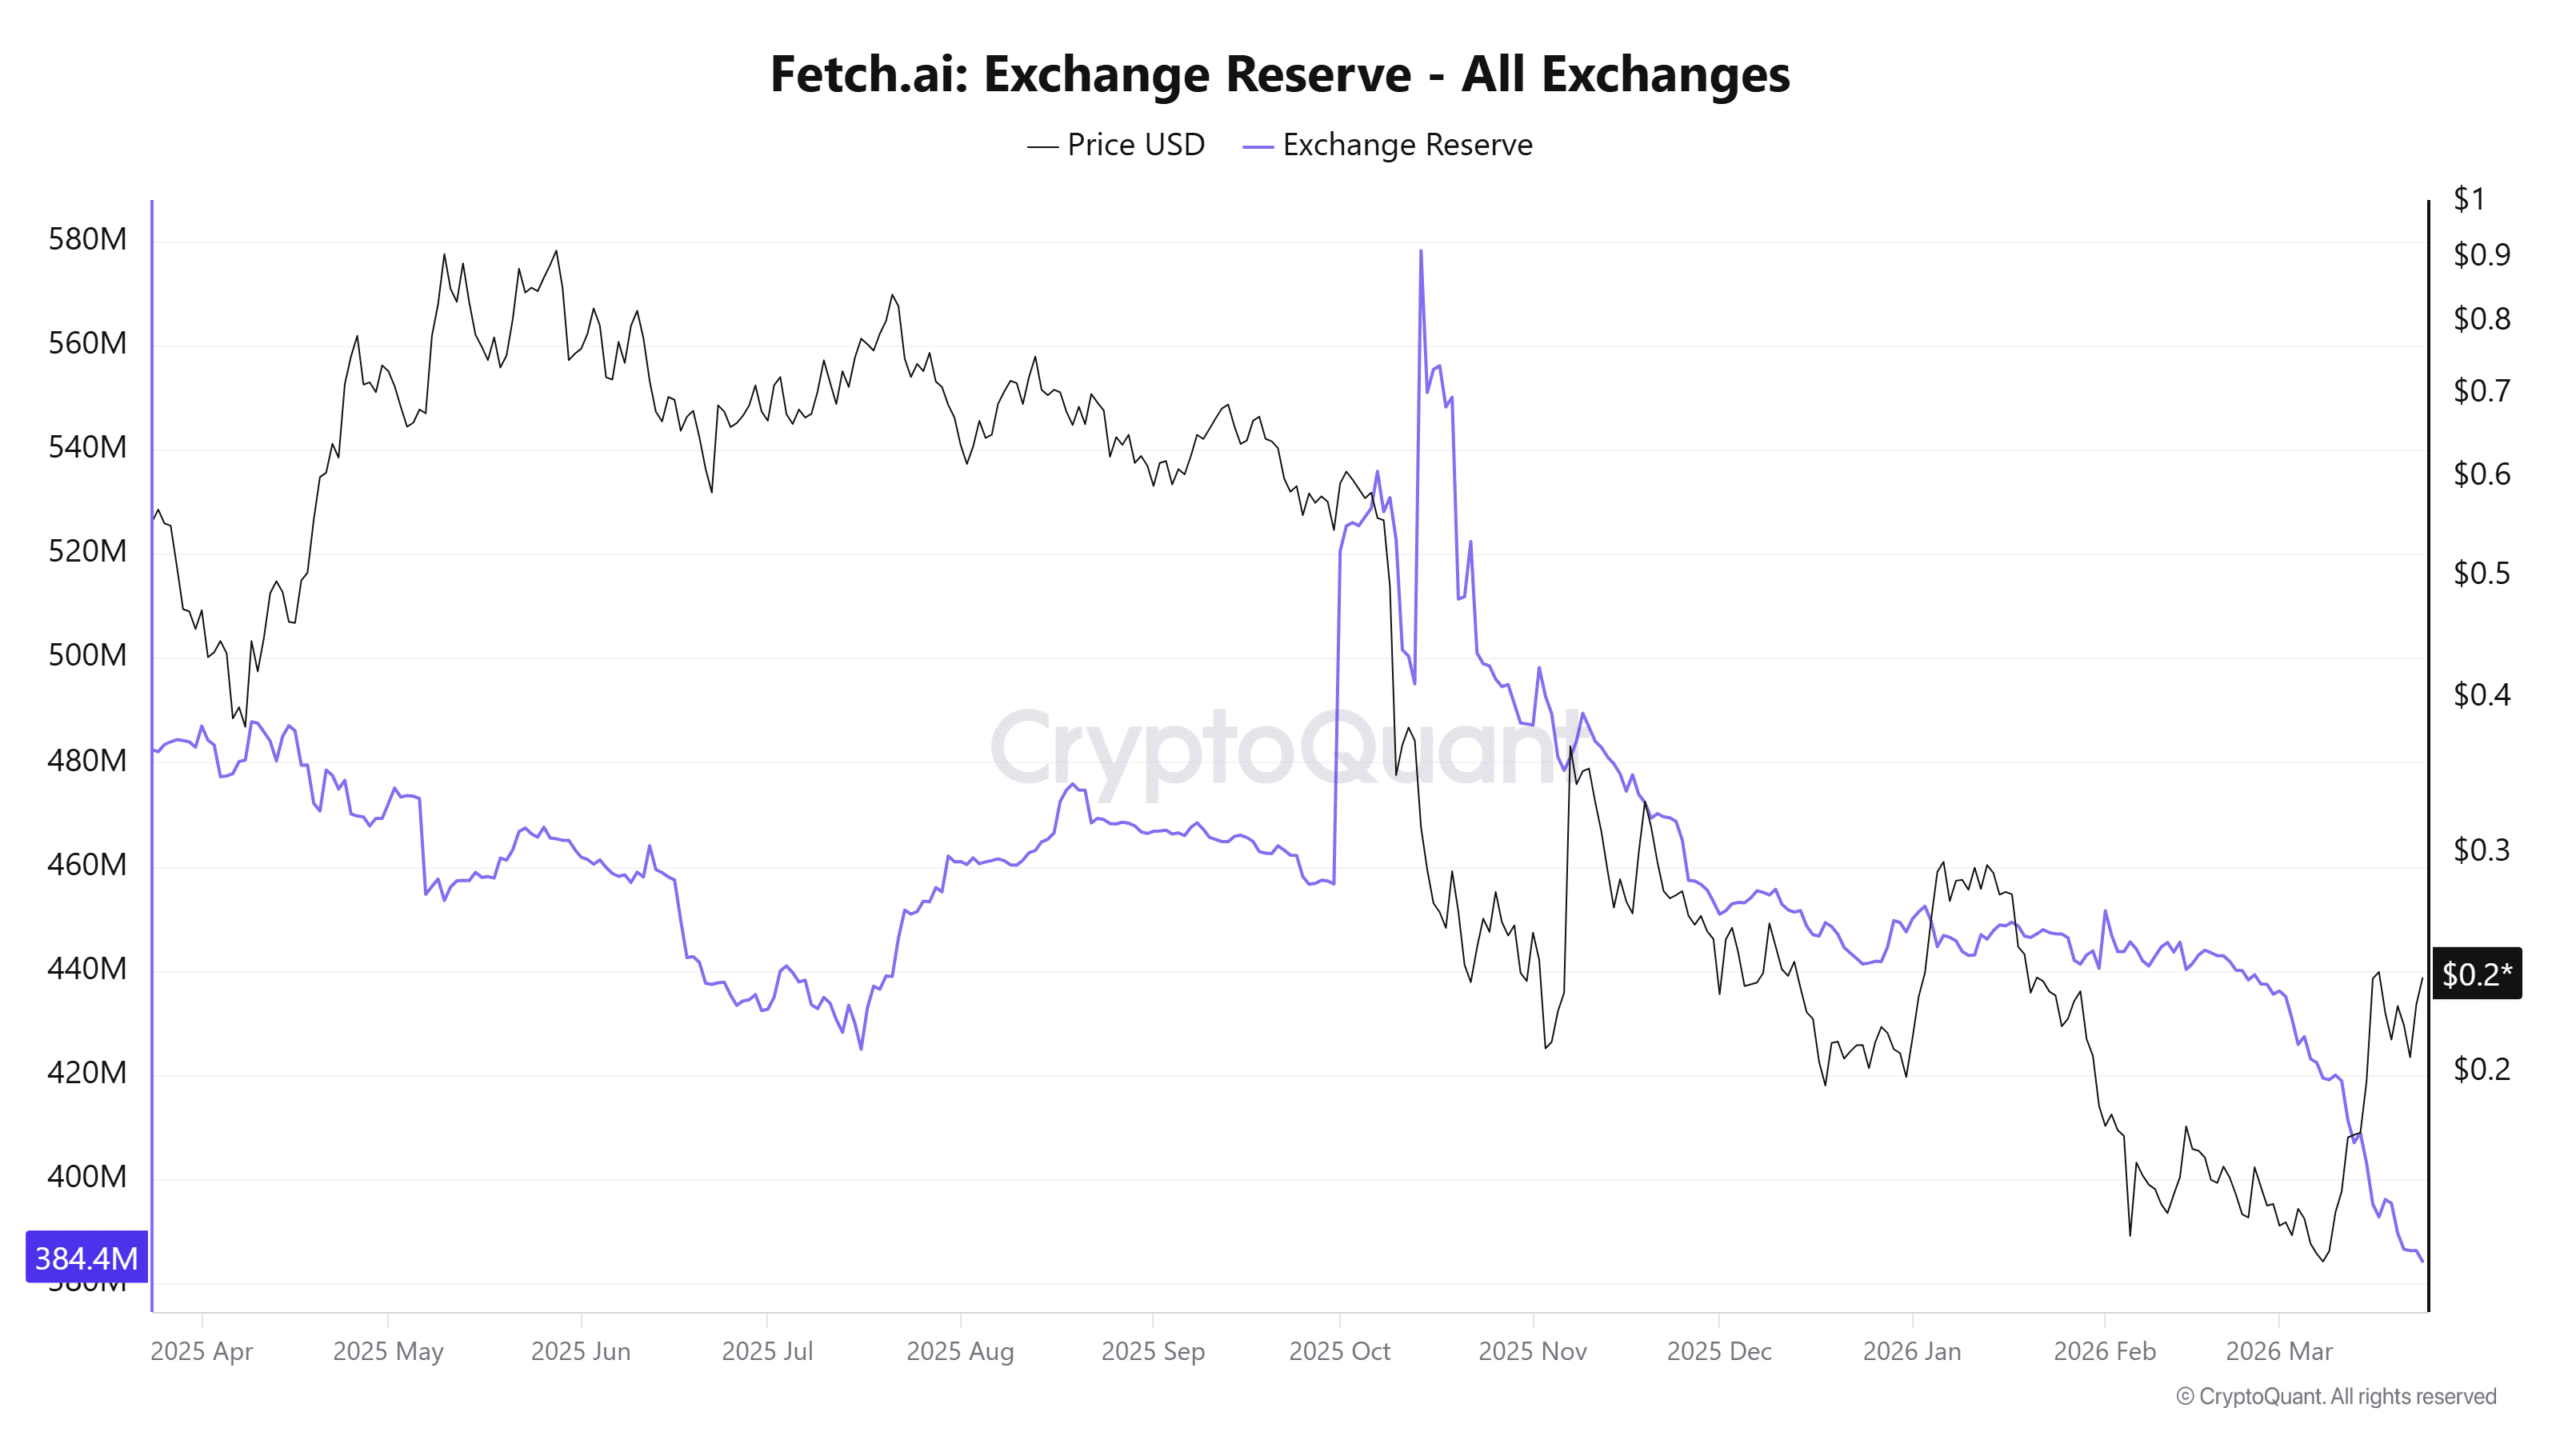
Además, la Reserva de Exchange de la altcoin se desplomó a 384 millones, marcando un mínimo de 2024. A menudo, una reserva de exchange más baja, especialmente para altcoins, ha indicado una presión de venta reducida y mayores salidas de compra.
Fuente: CryptoQuant

Por lo tanto, FET se ha vuelto cada vez más escaso, reduciendo efectivamente la oferta disponible para la venta inmediata. A menudo, una mayor escasez ha acelerado el impulso alcista de un activo, llevando a precios más altos.

Las ballenas se mantienen bajistas, sin embargo

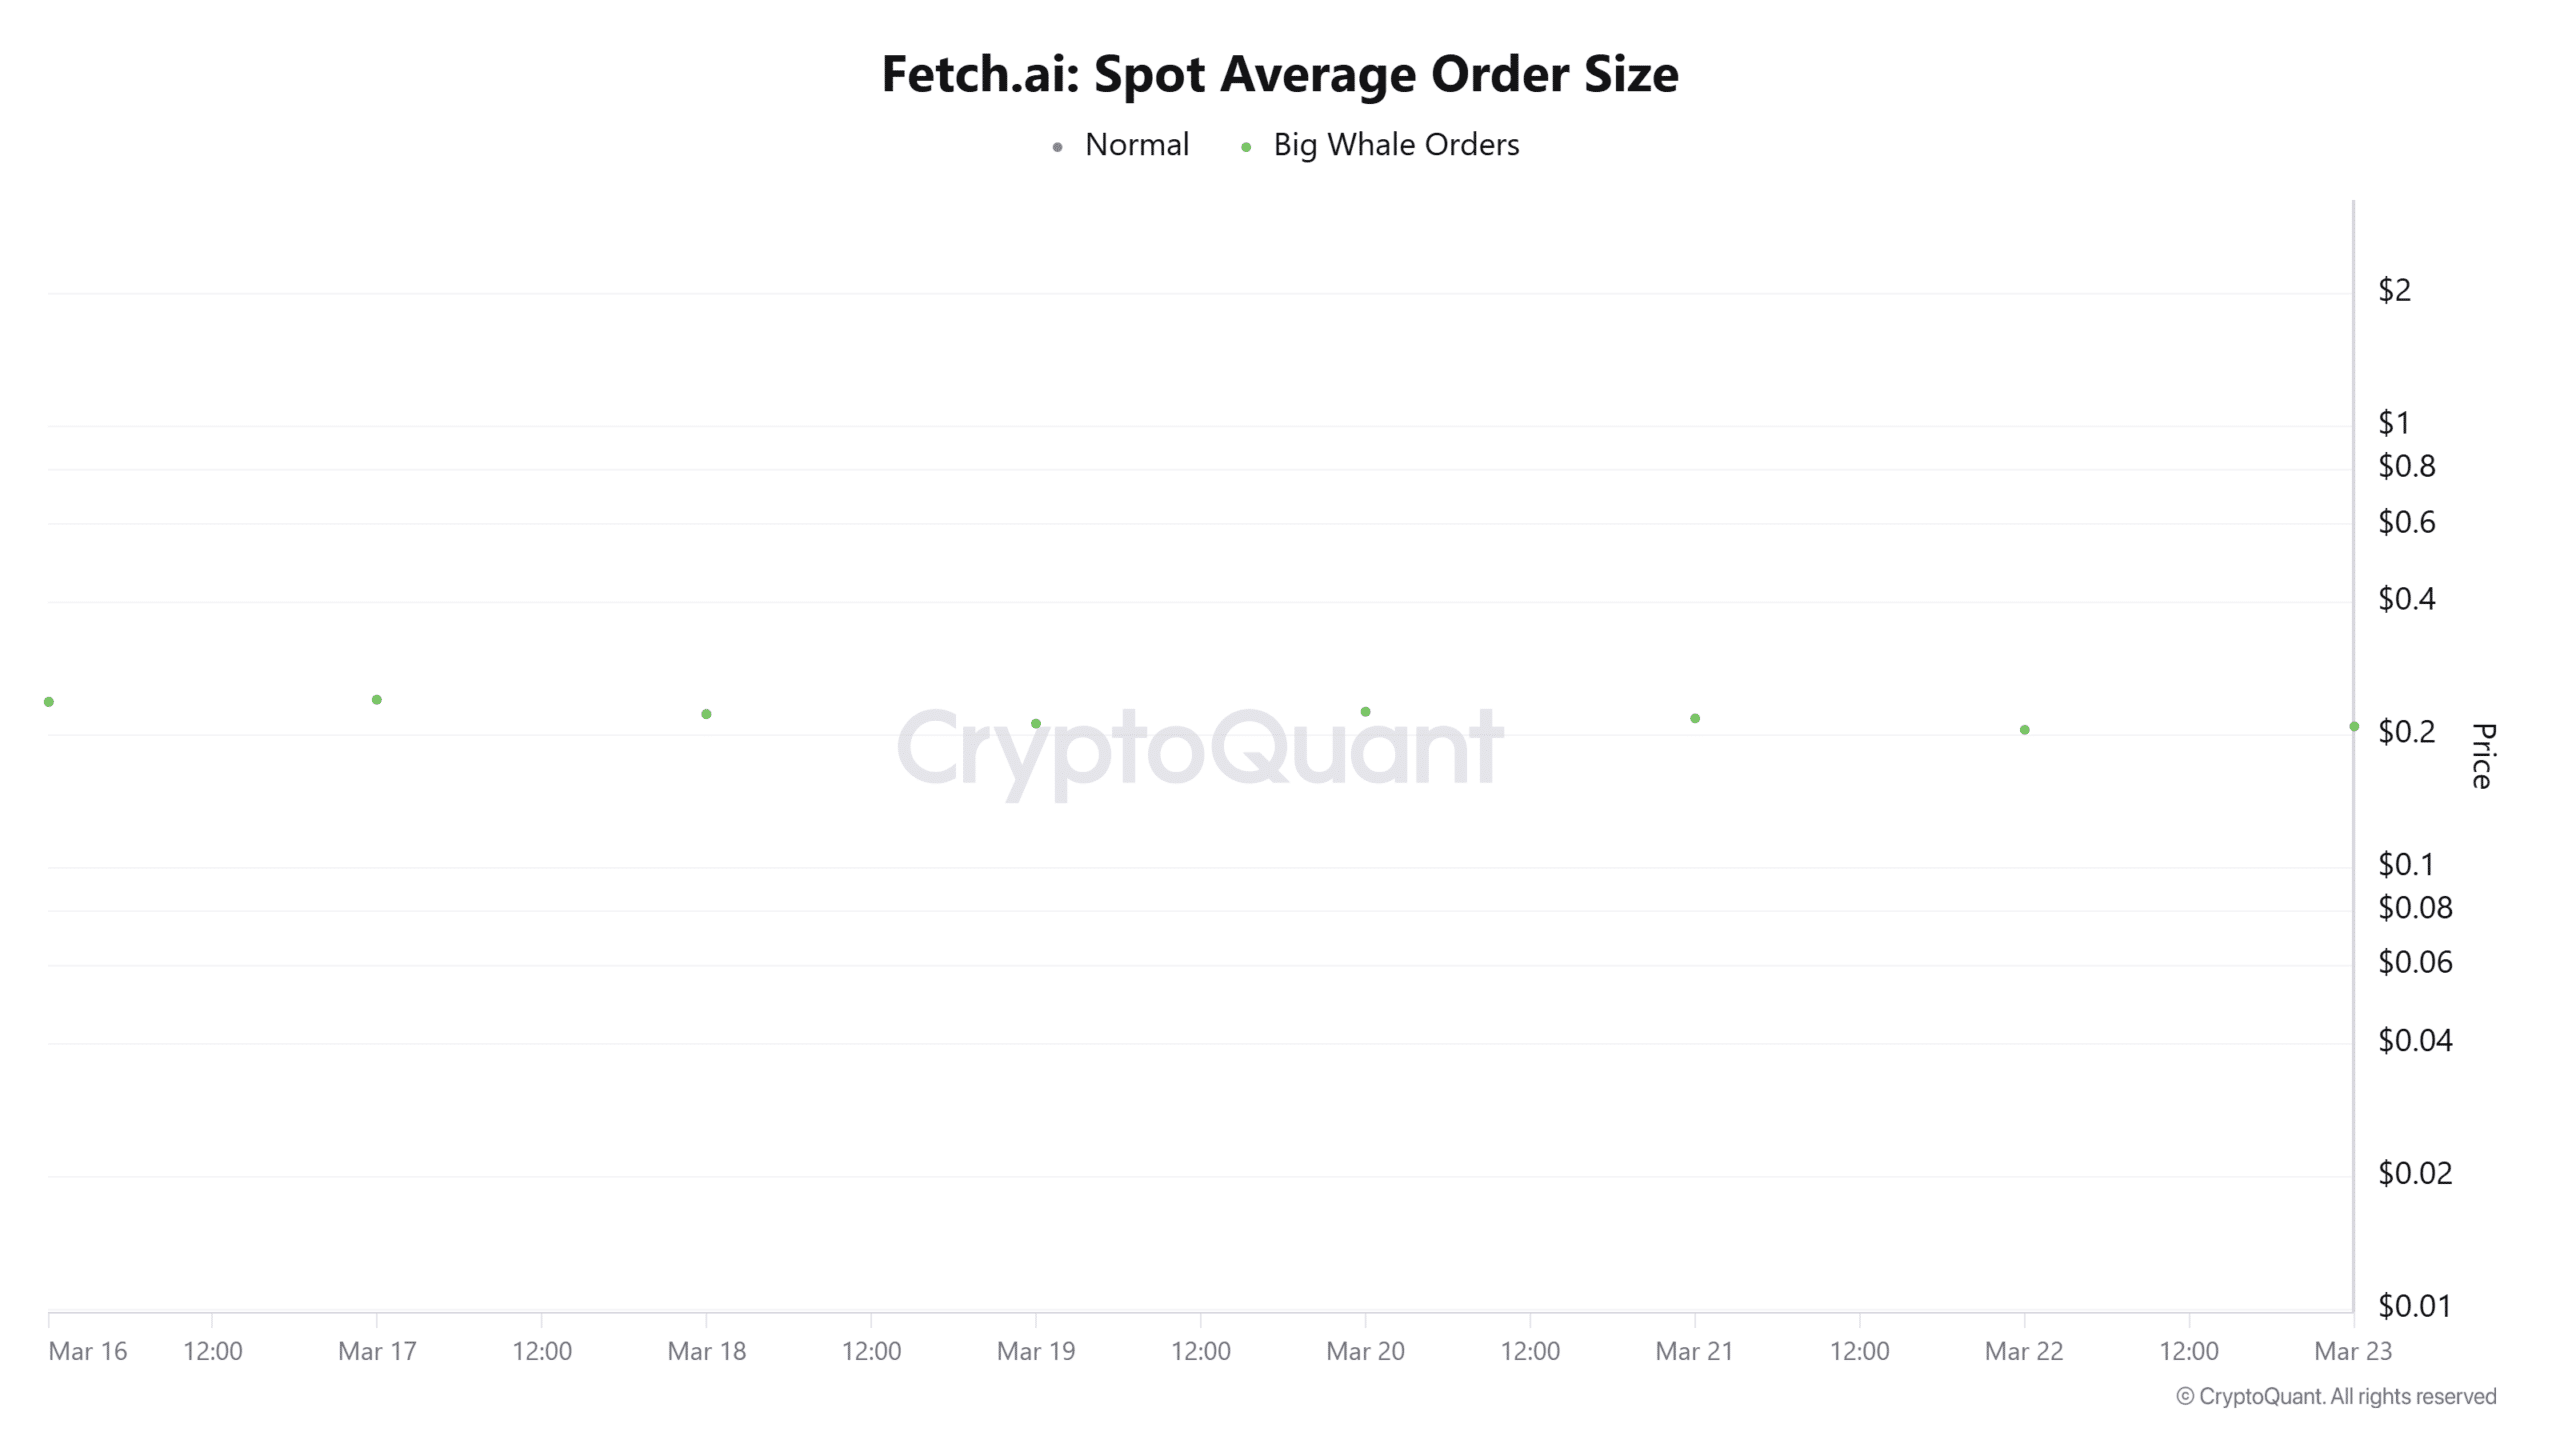
A pesar del reciente bombeo del mercado, las ballenas spot se han mantenido escépticas y están frenando el mercado. Los datos de Tamaño Promedio de Orden Spot de Cryptoquant mostraron una participación sostenida de ballenas en el mercado spot.
Fuente: CryptoQuant

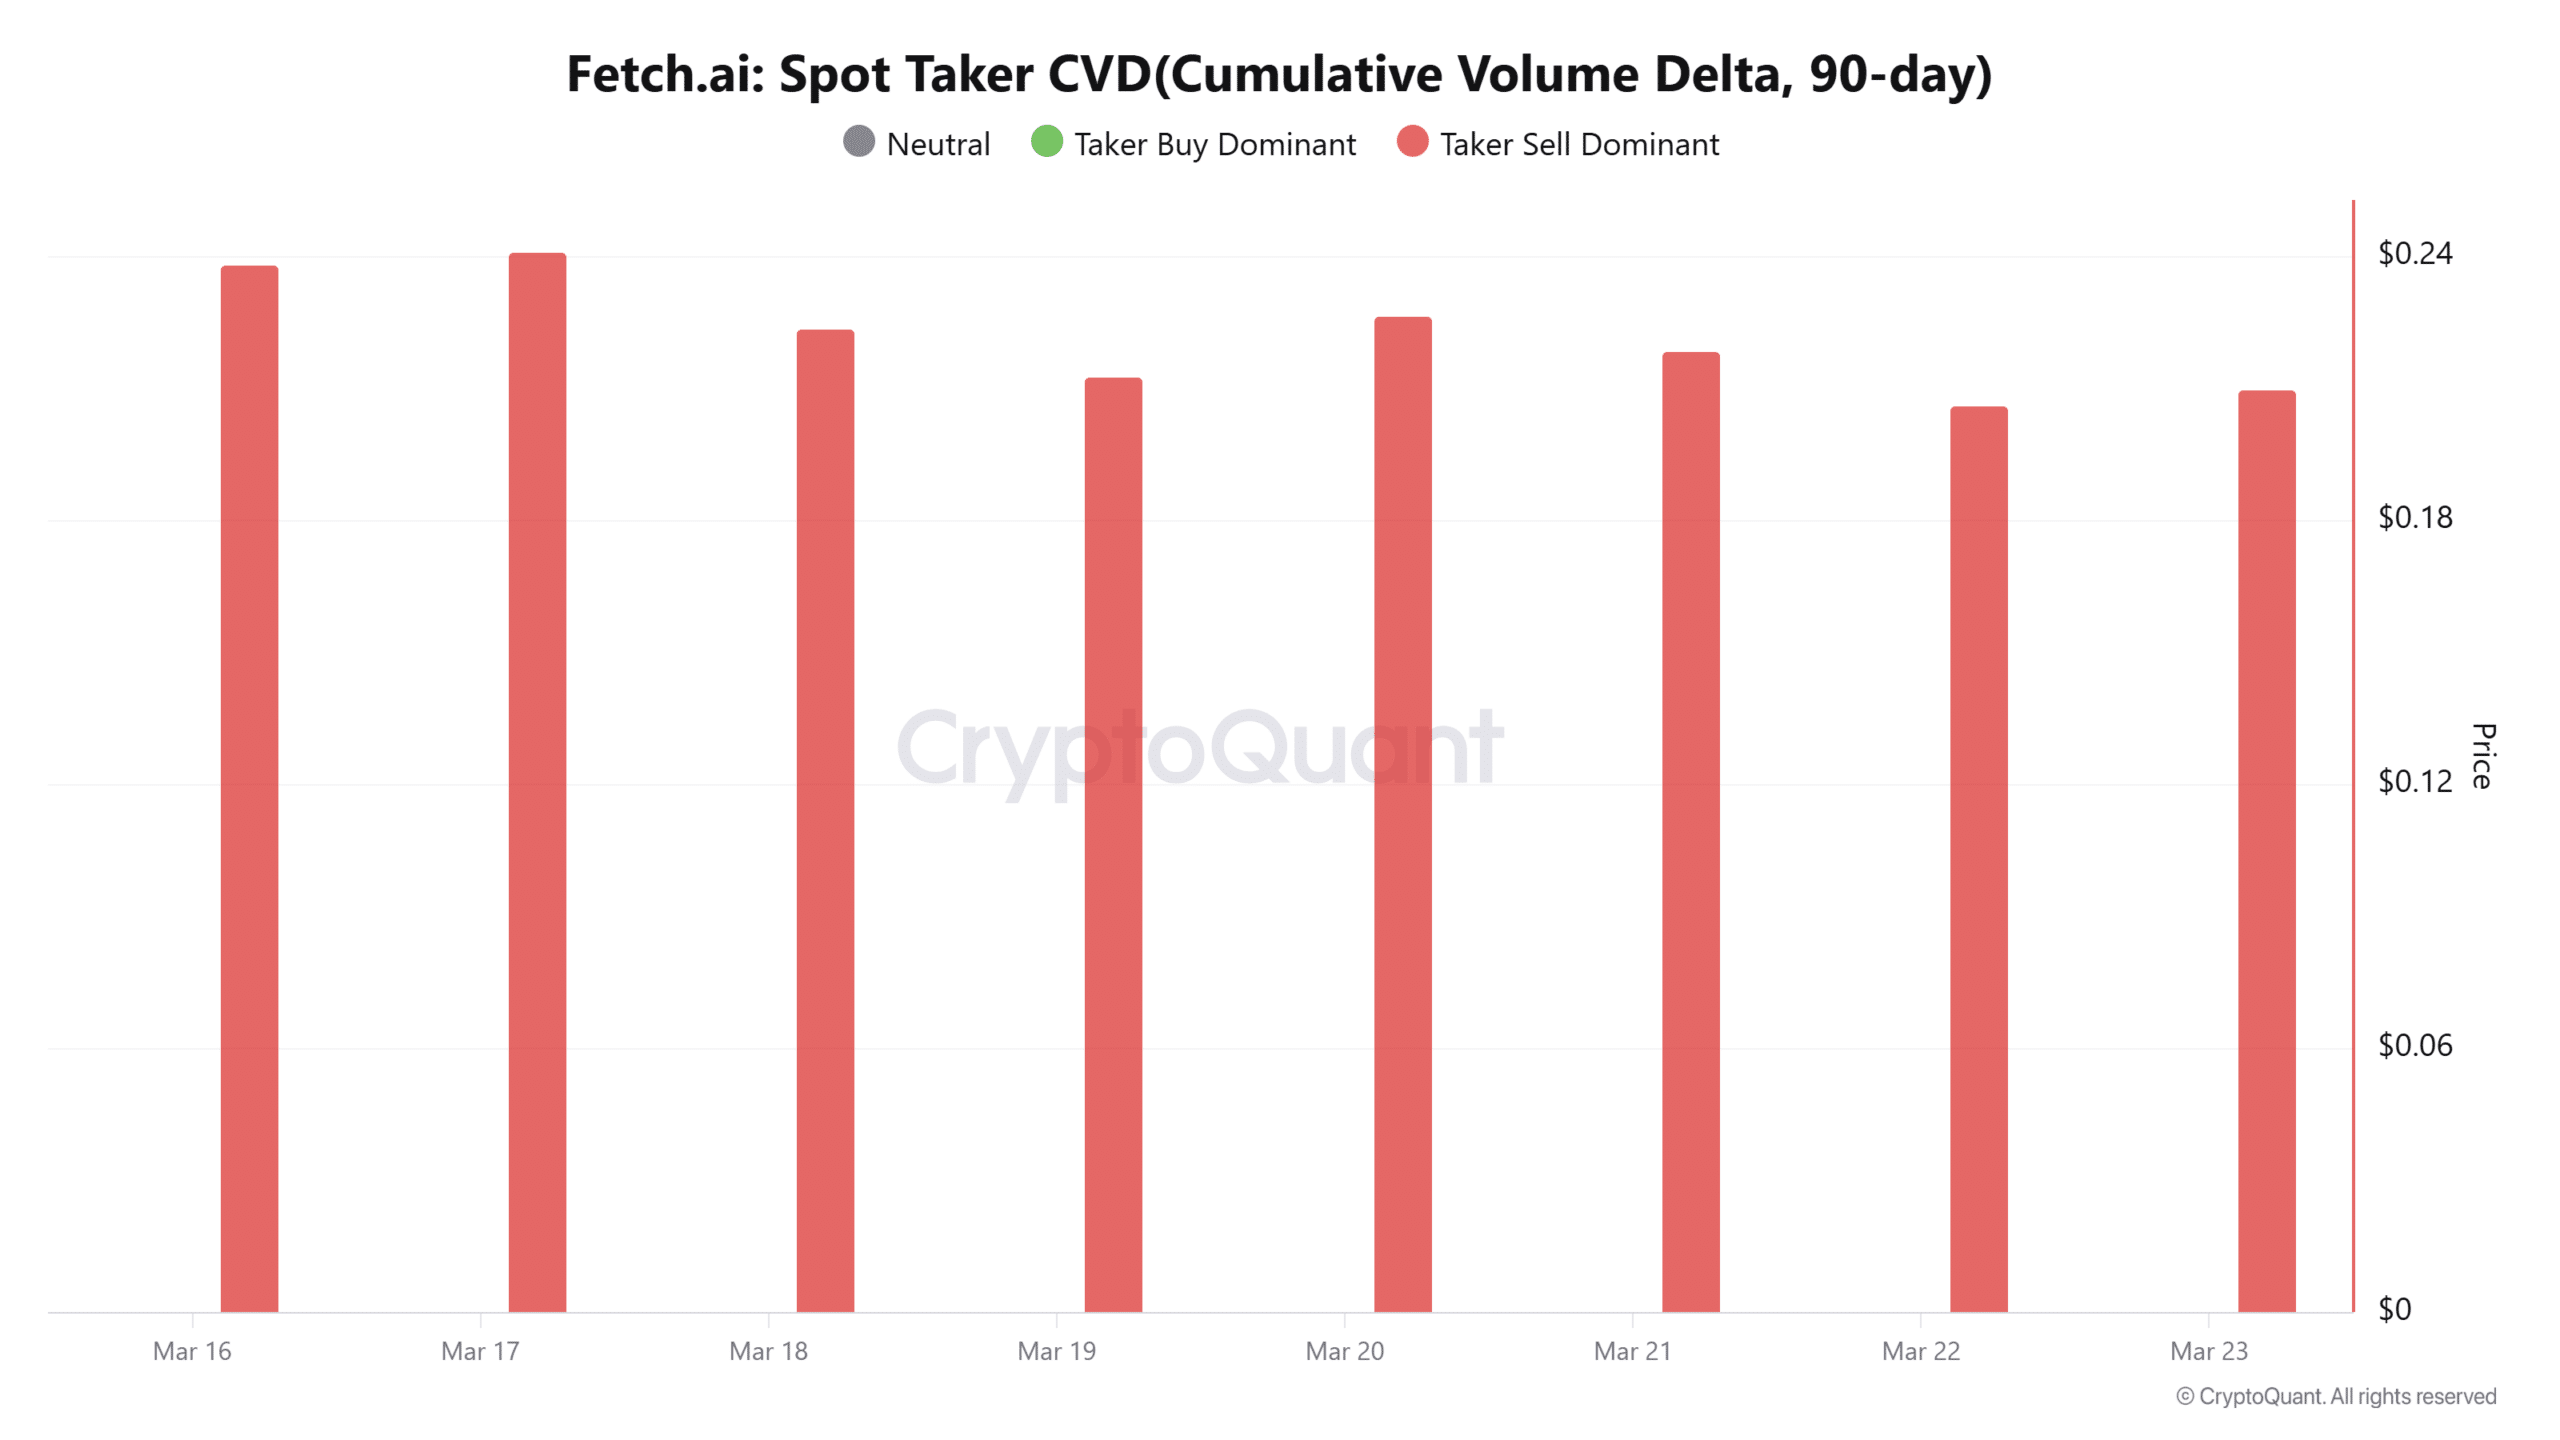
Estos grandes actores del mercado han entrado repetidamente en el mercado a precios entre $0.20 y $0.22. Estas órdenes podrían ser de compra o venta, y basado en Spot Order CVD, en su mayoría han sido órdenes de venta.

Por lo tanto, las ballenas han estado vendiendo agresivamente en $0.20-$0.22, lo que ha arrastrado significativamente el mercado hacia abajo. Históricamente, una mayor presión de venta de ballenas ha debilitado el mercado, acelerando así la baja y a menudo sirviendo como precursor de precios más bajos.
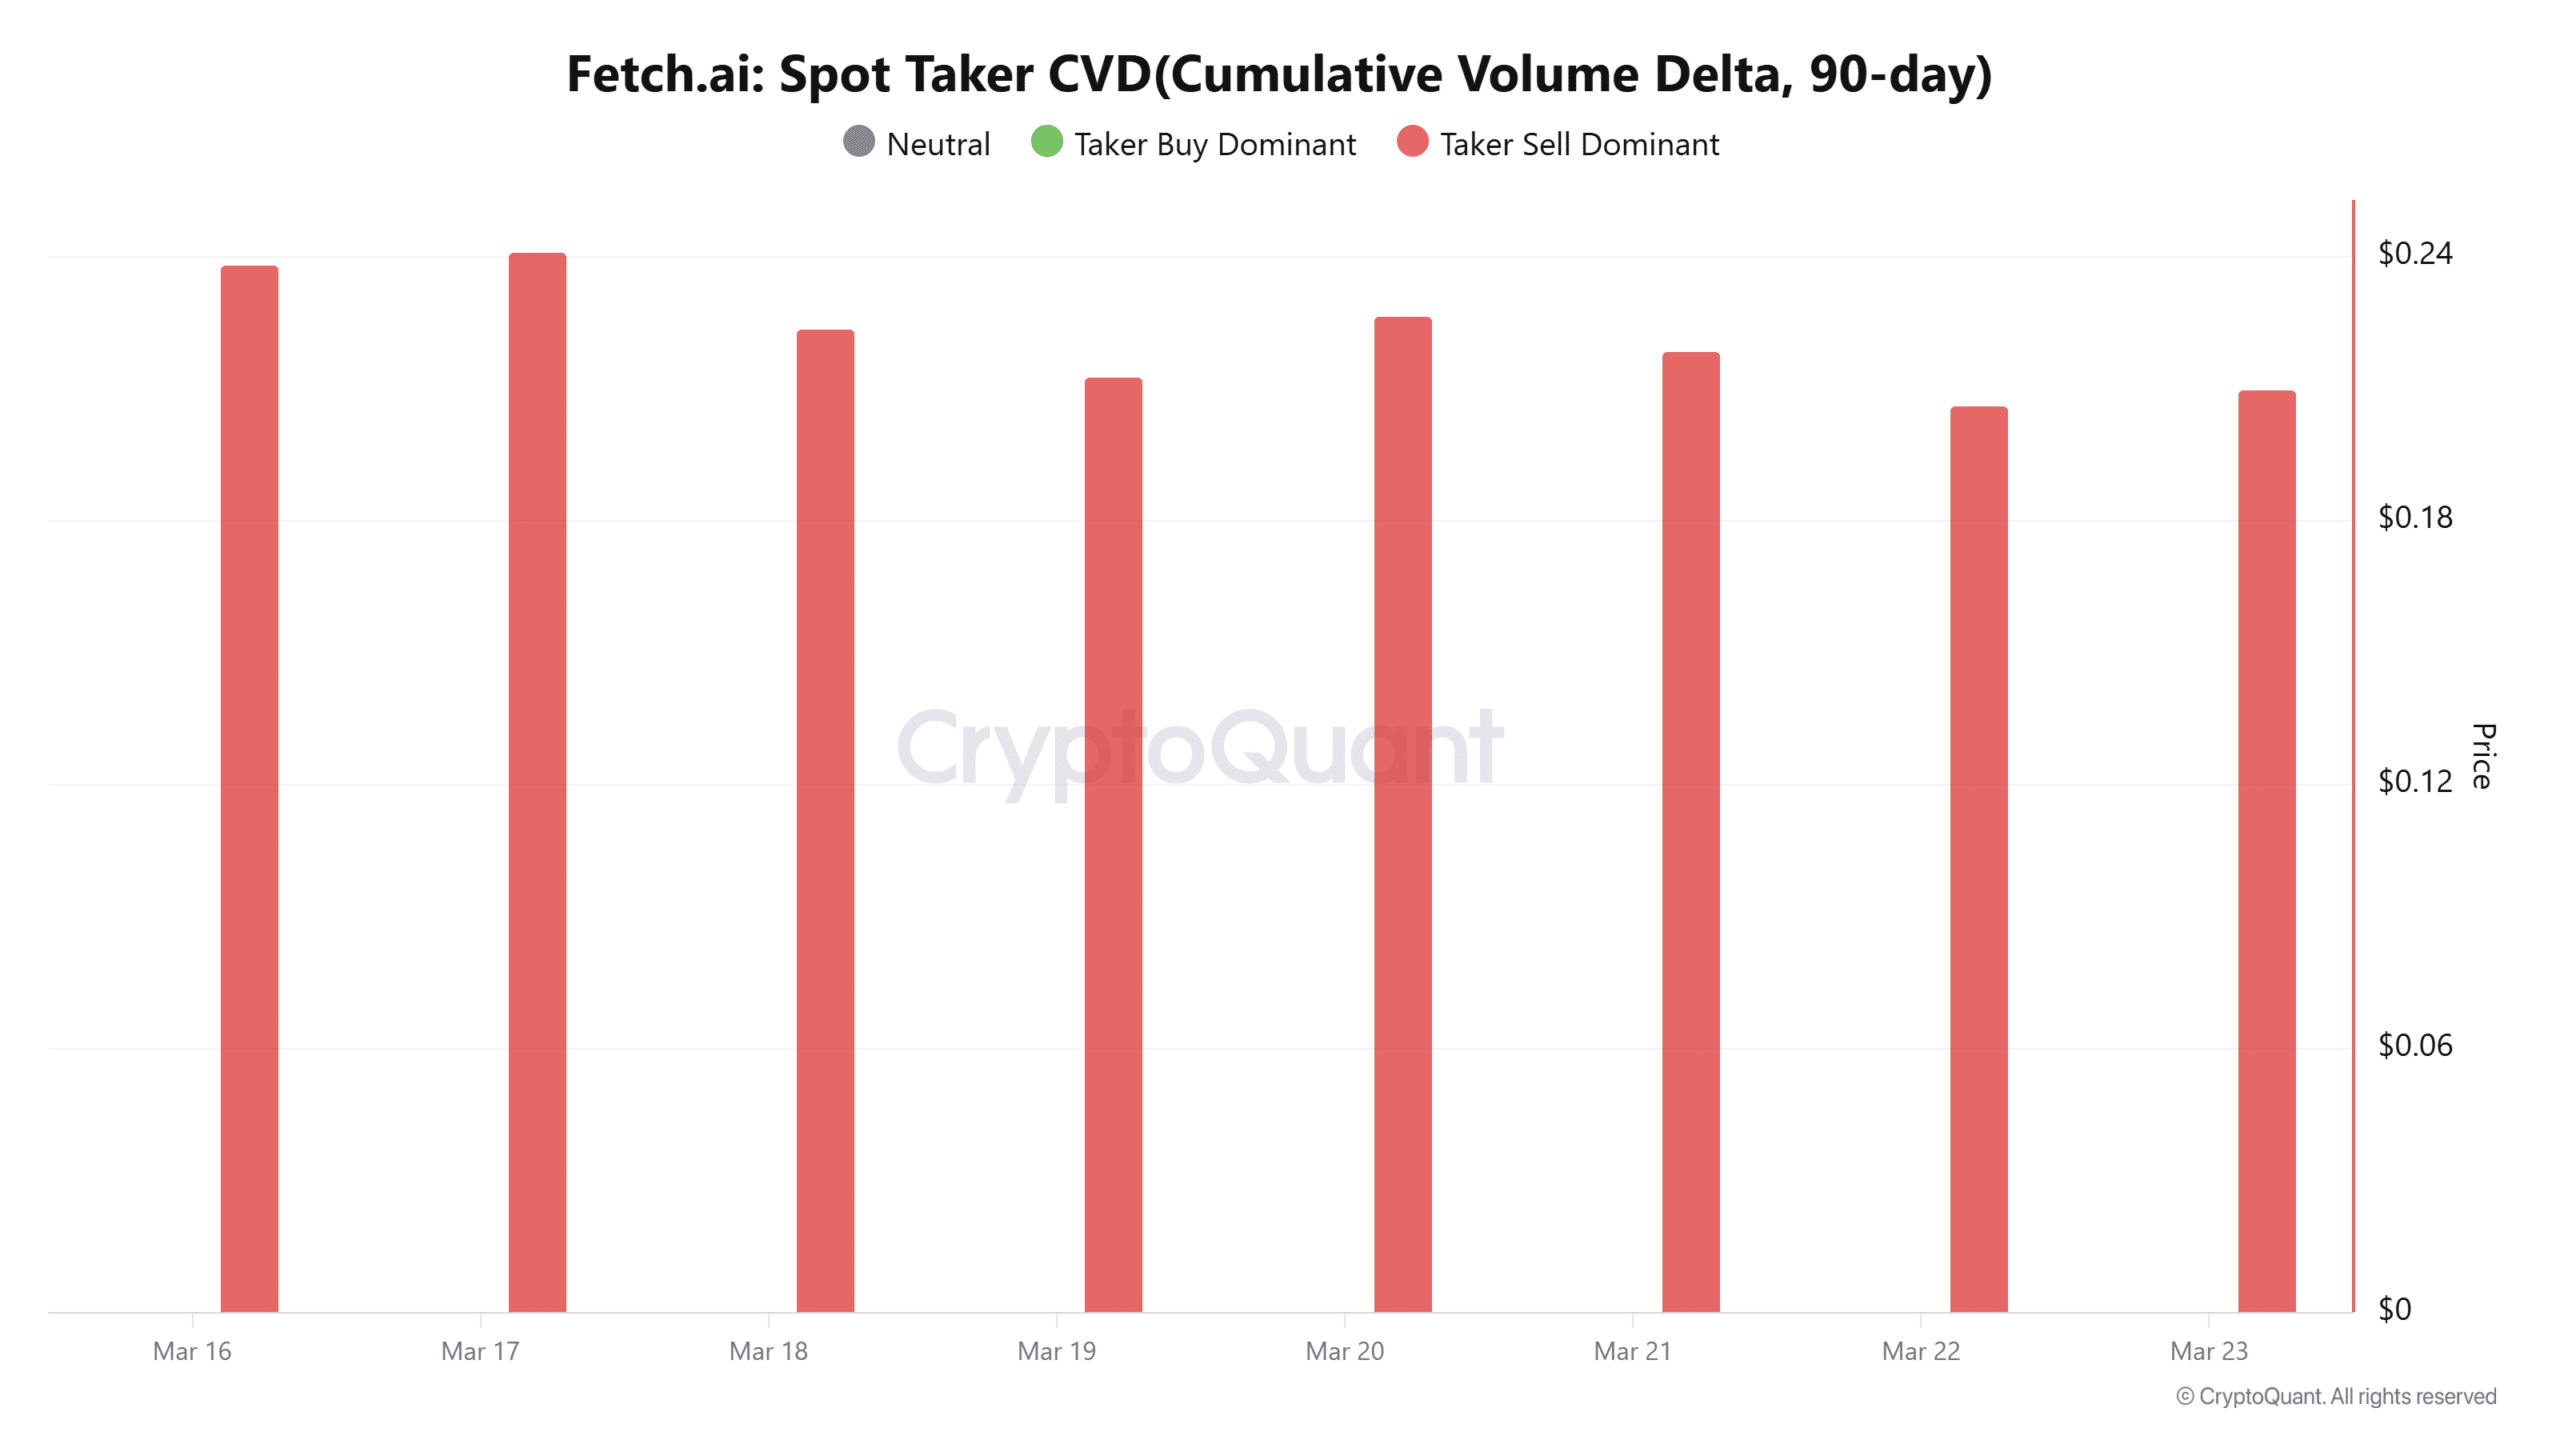
Fuente: CryptoQuant

¿Qué sigue para FET?

Artificial Superintelligence Alliance experimentó un salto significativo en medio de una mayor rotación de capital hacia el sector de IA.

Como resultado, la altcoin superó sus promedios móviles a corto plazo, MA9, indicando un fuerte impulso alcista. Al mismo tiempo, el MACD continuó subiendo, alcanzando 0.016, validando aún más la fuerza de la tendencia.
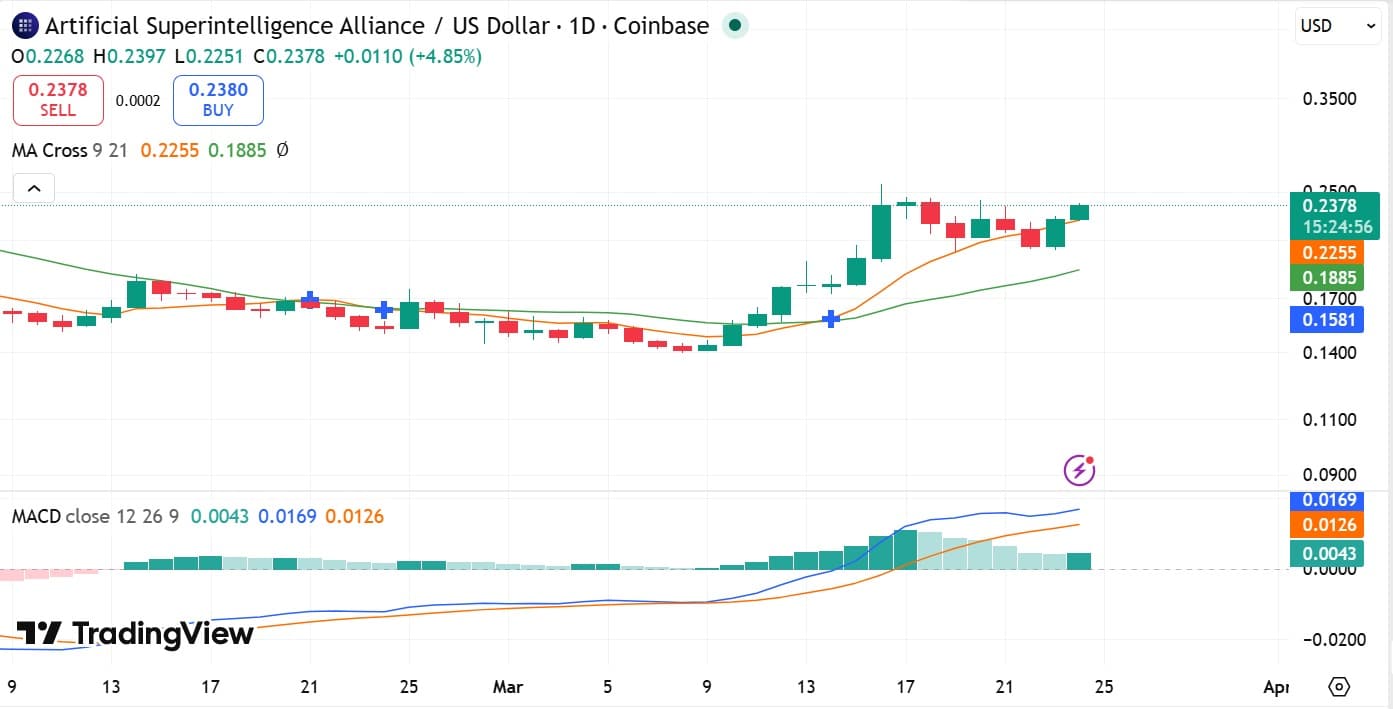
Fuente: TradingView

Cuando los indicadores de momentum se configuran de esta manera, señala una demanda de mercado establecida, con los compradores en control total. A menudo, tal configuración ha señalado históricamente la continuación de una tendencia.

Por lo tanto, si la demanda se mantiene estable, Artificial SuperIntelligence Alliance podría superar su resistencia inmediata en $0.25 y apuntar a $0.3. Sin embargo, con las ballenas aún vendiendo, la amenaza de un retroceso permanece, y FET podría romper $0.22 antes de buscar soporte alrededor de $0.20.


Resumen Final

  • Artificial Superintelligence Alliance [FET] mantuvo exitosamente $0.20, subiendo un 15.5% a un máximo local de $0.238.
  • FET experimentó una rotación de capital renovada en medio de una recuperación en la demanda especulativa y un resurgimiento en el sector de IA.


Crypto di tendenza

Domande pertinenti

Q¿Cuál fue el rendimiento de FET en las tablas diarias y a qué precio cotizaba al momento de escribir el artículo?

AFET cotizaba a $0.238, registrando un aumento del 15.5% en las tablas diarias.

Q¿Qué indicador mostró una tendencia de escasez para FET y qué implica esto para su precio?

AEl indicador de Reserva de Intercambio (Exchange Reserve) de FET cayó a 384 millones, marcando un mínimo de 2024. Una reserva de intercambio más baja generalmente indica una reducción de la presión de venta y mayores salidas de compra, lo que sugiere una mayor escasez del activo que puede acelerar su impulso alcista y llevar a precios más altos.

QA pesar del bombeo del mercado, ¿qué grupo de actores del mercado se mantuvo escéptico y qué acción estaban realizando?

ALas ballenas (grandes tenedores) se mantuvieron escépticas. Según los datos de Spot Average Order Size y Spot Order CVD, estuvieron realizando órdenes de venta de manera agresiva en el rango de precios de $0.20 a $0.22, lo que ejerció una presión significativa a la baja en el mercado.

QSegún el análisis técnico, ¿qué dos indicadores clave señalaron un fuerte impulso alcista y control total de los compradores?

AEl cruce alcista de su media móvil de 9 días (MA9) y el continuo aumento del MACD, que alcanzó 0.016, fueron los dos indicadores clave que validaron la fuerza de la tendencia alcista y señalaron que los compradores tenían el control total del mercado.

Q¿Cuáles son los dos posibles escenarios de precio objetivo para FET mencionados al final del análisis?

ASi la demanda se mantiene estable, FET podría superar su resistencia inmediata en $0.25 y apuntar a $0.30. Sin embargo, con las ballenas aún vendiendo, persiste la amenaza de un retroceso, y FET podría caer por debajo de $0.22 antes de buscar soporte alrededor de $0.20.

Letture associate

Weekly Editor's Picks (0725-0731)

Weekly Editor's Picks (0725-0731) provides a curated selection of deep analysis, filtering out market noise. Key themes from this week include: **Macro & Policy:** The Federal Reserve's upcoming meeting is marked by high uncertainty, balancing cooling inflation data against persistent price pressures. Meanwhile, the U.S. crypto regulatory Clarity Act faces critical political hurdles, with its 2026 passage probability seen as low. **Investing & Crypto:** Analysis suggests long-term crypto success depends on conviction through volatile cycles, focusing on assets like Bitcoin and core smart contract platforms. A trend noted is the increasing similarity between global equity markets (especially tech) and crypto, driven by narrative and leverage. Several major crypto protocols show strong revenue growth, but this isn't always translating to token price appreciation due to sell pressure and structural factors. **AI & Semiconductors:** Nvidia's rising credit default swap rates signal market concern over AI infrastructure financing risks. The storage sector experienced volatility as markets began pricing in potential 2027 oversupply. Despite a record profitable quarter, SK Hynix's results were deemed "below expectations," reflecting heightened investor demands for future growth visibility. **Markets & DeFi:** TradeXYZ demonstrated remarkable accuracy in pre-market pricing for a major A股 listing. The token ONDO saw gains, linked to its growing role in the on-chain tokenized stock ecosystem. **Ethereum:** Post-Pectra upgrade, a major structural shift is underway as Lido begins migrating millions of ETH to new validator architectures designed for capital efficiency. **Also Highlighted:** Butian's bullish stock market move; OpenAI's Altman promising major advances; Samsung and SK Hynix securing large AI chip deals; Apple reaching a $5T market cap; and ongoing discussions around exchange security following Poolin's bankruptcy case.

marsbit26 min fa

Weekly Editor's Picks (0725-0731)

marsbit26 min fa

Low Investment Isn't Apple's Immunity Pass

While Meta and Google face investor scrutiny over ballooning AI capital expenditures, Apple's minimal AI investment has paradoxically become a strength. Its market cap recently reclaimed the global top spot, surpassing $5 trillion. The irony is deep: Apple's own AI efforts have lagged, with "Apple Intelligence" delayed and core talent lost, forcing reliance on partners like Google Gemini and Alibaba's Qianwen. Its Q3 FY2026 (Q2 CY) earnings initially seemed stellar. Revenue hit $109.4B (up 16% YoY), with iPhone and Mac sales, growing 22% and 29% respectively, driving most of the growth. However, the stock fell over 8% post-earnings. The primary concern was a weaker Q4 revenue growth forecast of 9-11%, below expectations, due to looming supply chain constraints. Apple is feeling the indirect cost of the AI boom. Soaring memory and chip prices, fueled by massive data center investments from Microsoft, Amazon, and others, are forcing Apple to raise Mac and iPad prices significantly. The upcoming iPhone launch is also expected to see substantial price hikes. Despite avoiding heavy AI infrastructure spending—its capital expenditures are actually down 28%—Apple cannot escape the industry-wide supply and cost pressures. While Apple's operating cash flow remains robust, its substantial R&D spending (up 32% YoY) has yet to yield major AI breakthroughs. As Tim Cook prepares to step down as CEO, Apple faces a challenging transition: balancing its premium hardware success against the strategic and cost pressures of the AI era it has so far cautiously navigated.

marsbit1 h fa

Low Investment Isn't Apple's Immunity Pass

marsbit1 h fa

PA Graphics Explanation | One Chart to Understand the Major Web3 Events in August 2026

**PANews Crypto Calendar: Key Web3 Events in August 2026** PANews introduces its revamped crypto calendar, featuring comprehensive coverage, flexible filtering, and easy export options. The market in August will be shaped by multiple key events across macroeconomics, regulation, tokenomics, and project developments: * **Macro & Policy:** Key US economic data releases (July Non-Farm Payrolls, CPI), the Federal Reserve meeting minutes, and the Jackson Hole Economic Symposium will be in focus. On the regulatory front, the US Senate plans to release a new draft of the *CLARITY Act*, while the EU's expanded crypto ban against Belarus comes into effect. * **Token Unlocks:** Significant token unlocks are scheduled for assets including ENA, AVAX, CONX, ZRO, and KAITO, which may influence market volatility. * **Project Updates & Shutdowns:** Several services, including Exchange Art, Ctrl Wallet, Zapper, NFTfi, and Summer.fi, are set to cease operations or undergo major adjustments. Users are advised to manage their assets accordingly. * **Corporate Activity:** Q2 earnings reports from companies like SpaceX, Circle, and Nvidia are due. Unitree Robotics will initiate its IPO subscription on the STAR Market, and Moonshot AI plans to begin a Pre-IPO financing round. * **Industry Events:** Major conferences such as Bitcoin Asia 2026 and the 2026 Digital Expo will take place. The overarching market narrative for August will revolve around macroeconomic expectations, regulatory developments, token unlock schedules, and ongoing industry consolidation.

marsbit1 h fa

PA Graphics Explanation | One Chart to Understand the Major Web3 Events in August 2026

marsbit1 h fa

Wall Street's Most Famous 'Cassandra' Now Has His Sights Set on Nvidia

Michael Burry, the famed "Big Short" investor, has once again captured Wall Street's attention with a series of short positions against major tech and semiconductor stocks, most notably Nvidia. In late June and July, through his "Cassandra Unchained" newsletter, Burry disclosed short bets against Nvidia, Tesla, Applied Materials, Caterpillar, the SOXX semiconductor ETF, and later, Micron Technology. His core thesis revolves around potential distortions in the AI infrastructure boom, specifically questioning whether extended depreciation schedules (e.g., 6 years vs. a realistic 2-3 years for AI chips) by cloud giants like Microsoft and Google artificially inflate profits. He also raises concerns about possible "off-balance-sheet circular financing," where chip demand might be propped up by vendor-backed funding to clients. Nvidia's stock experienced volatility following these disclosures, briefly dipping but largely holding near Burry's reported entry points, leaving his positions roughly flat or slightly underwater as of late July. This move is part of a pattern for Burry, whose track record since his legendary 2008 bet is mixed. He has faced notable losses, such as on Tesla in 2021, while scoring on broader market turns like the 2020 pandemic crash. His methodology focuses intensely on free cash flow and scrutinizing original financial documents to spot overvaluation and structural risks, but it often struggles with timing the market. The article contrasts Burry's stance with other prominent investors. Steve Eisman, another "Big Short" figure, is not shorting Nvidia, citing strong fundamentals but expressing nervousness about sustainability. Jim Chanos agrees with the broad "accounting mismatch" concern—comparing it to the dot-com bubble—but targets financial leverage in private equity firms rather than the chip stocks themselves. While Nvidia's short interest remains relatively low at 1.3-1.4% of float, the massive stock size means absolute short losses have been significant, exceeding $5 billion earlier this year. The piece concludes that for ordinary investors, the key takeaway is not replicating specific short bets but learning from the critical frameworks these investors use: questioning rosy accounting, identifying structural vulnerabilities, and maintaining skepticism during market euphoria, even if pinpointing the exact catalyst for a downturn remains elusive.

marsbit1 h fa

Wall Street's Most Famous 'Cassandra' Now Has His Sights Set on Nvidia

marsbit1 h fa

Trading

Spot

Articoli Popolari

Come comprare FET

Benvenuto in HTX.com! Abbiamo reso l'acquisto di FETCH.ai (FET) semplice e conveniente. Segui la nostra guida passo passo per intraprendere il tuo viaggio nel mondo delle criptovalute.Step 1: Crea il tuo Account HTXUsa la tua email o numero di telefono per registrarti il tuo account gratuito su HTX. Vivi un'esperienza facile e sblocca tutte le funzionalità,Crea il mio accountStep 2: Vai in Acquista crypto e seleziona il tuo metodo di pagamentoCarta di credito/debito: utilizza la tua Visa o Mastercard per acquistare immediatamente FETCH.aiFET.Bilancio: Usa i fondi dal bilancio del tuo account HTX per fare trading senza problemi.Terze parti: abbiamo aggiunto metodi di pagamento molto utilizzati come Google Pay e Apple Pay per maggiore comodità.P2P: Fai trading direttamente con altri utenti HTX.Over-the-Counter (OTC): Offriamo servizi su misura e tassi di cambio competitivi per i trader.Step 3: Conserva FETCH.ai (FET)Dopo aver acquistato FETCH.ai (FET), conserva nel tuo account HTX. In alternativa, puoi inviare tramite trasferimento blockchain o scambiare per altre criptovalute.Step 4: Scambia FETCH.ai (FET)Scambia facilmente FETCH.ai (FET) nel mercato spot di HTX. Accedi al tuo account, seleziona la tua coppia di trading, esegui le tue operazioni e monitora in tempo reale. Offriamo un'esperienza user-friendly sia per chi ha appena iniziato che per i trader più esperti.

123 Totale visualizzazioniPubblicato il 2024.12.11Aggiornato il 2026.06.02

Come comprare FET

Discussioni

Benvenuto nella Community HTX. Qui puoi rimanere informato sugli ultimi sviluppi della piattaforma e accedere ad approfondimenti esperti sul mercato. Le opinioni degli utenti sul prezzo di FET FET sono presentate come di seguito.

活动图片