GRASS crypto rallies 28%: Can bulls target a liquidity sweep above $0.48?

ambcryptoPubblicato 2026-03-18Pubblicato ultima volta 2026-03-18

Introduzione

GRASS crypto surged 28% in 24 hours, pushing its price toward $0.47 as buyers regained strong control. The rally follows a steady climb from lower consolidation zones, signaling bullish intent. Price is testing key resistance at $0.475, with a break above potentially targeting $0.658. Technical indicators show overbought conditions (RSI at 78.69), suggesting possible short-term cooling, but the overall structure remains bullish. Binance traders increased long exposure (58.35%), supporting further upside. Liquidity clusters above $0.48 may attract price movement, potentially triggering cascading liquidations and accelerating gains. While overbought, the trend favors gradual continuation toward higher resistance.

At press time, GRASS has surged over 28% in the past 24 hours, pushing its price toward the $0.47 region as buyers regain firm control. This rally follows a steady climb from lower consolidation zones, signaling strong directional intent.

Trading activity has risen alongside price, reinforcing the bullish structure. However, the asset now trades near a key resistance zone, introducing immediate pressure. While strong demand has fueled the sharp advance, GRASS faces a critical test of whether buyers can sustain momentum without weakening.

GRASS tests resistance after reclaiming support

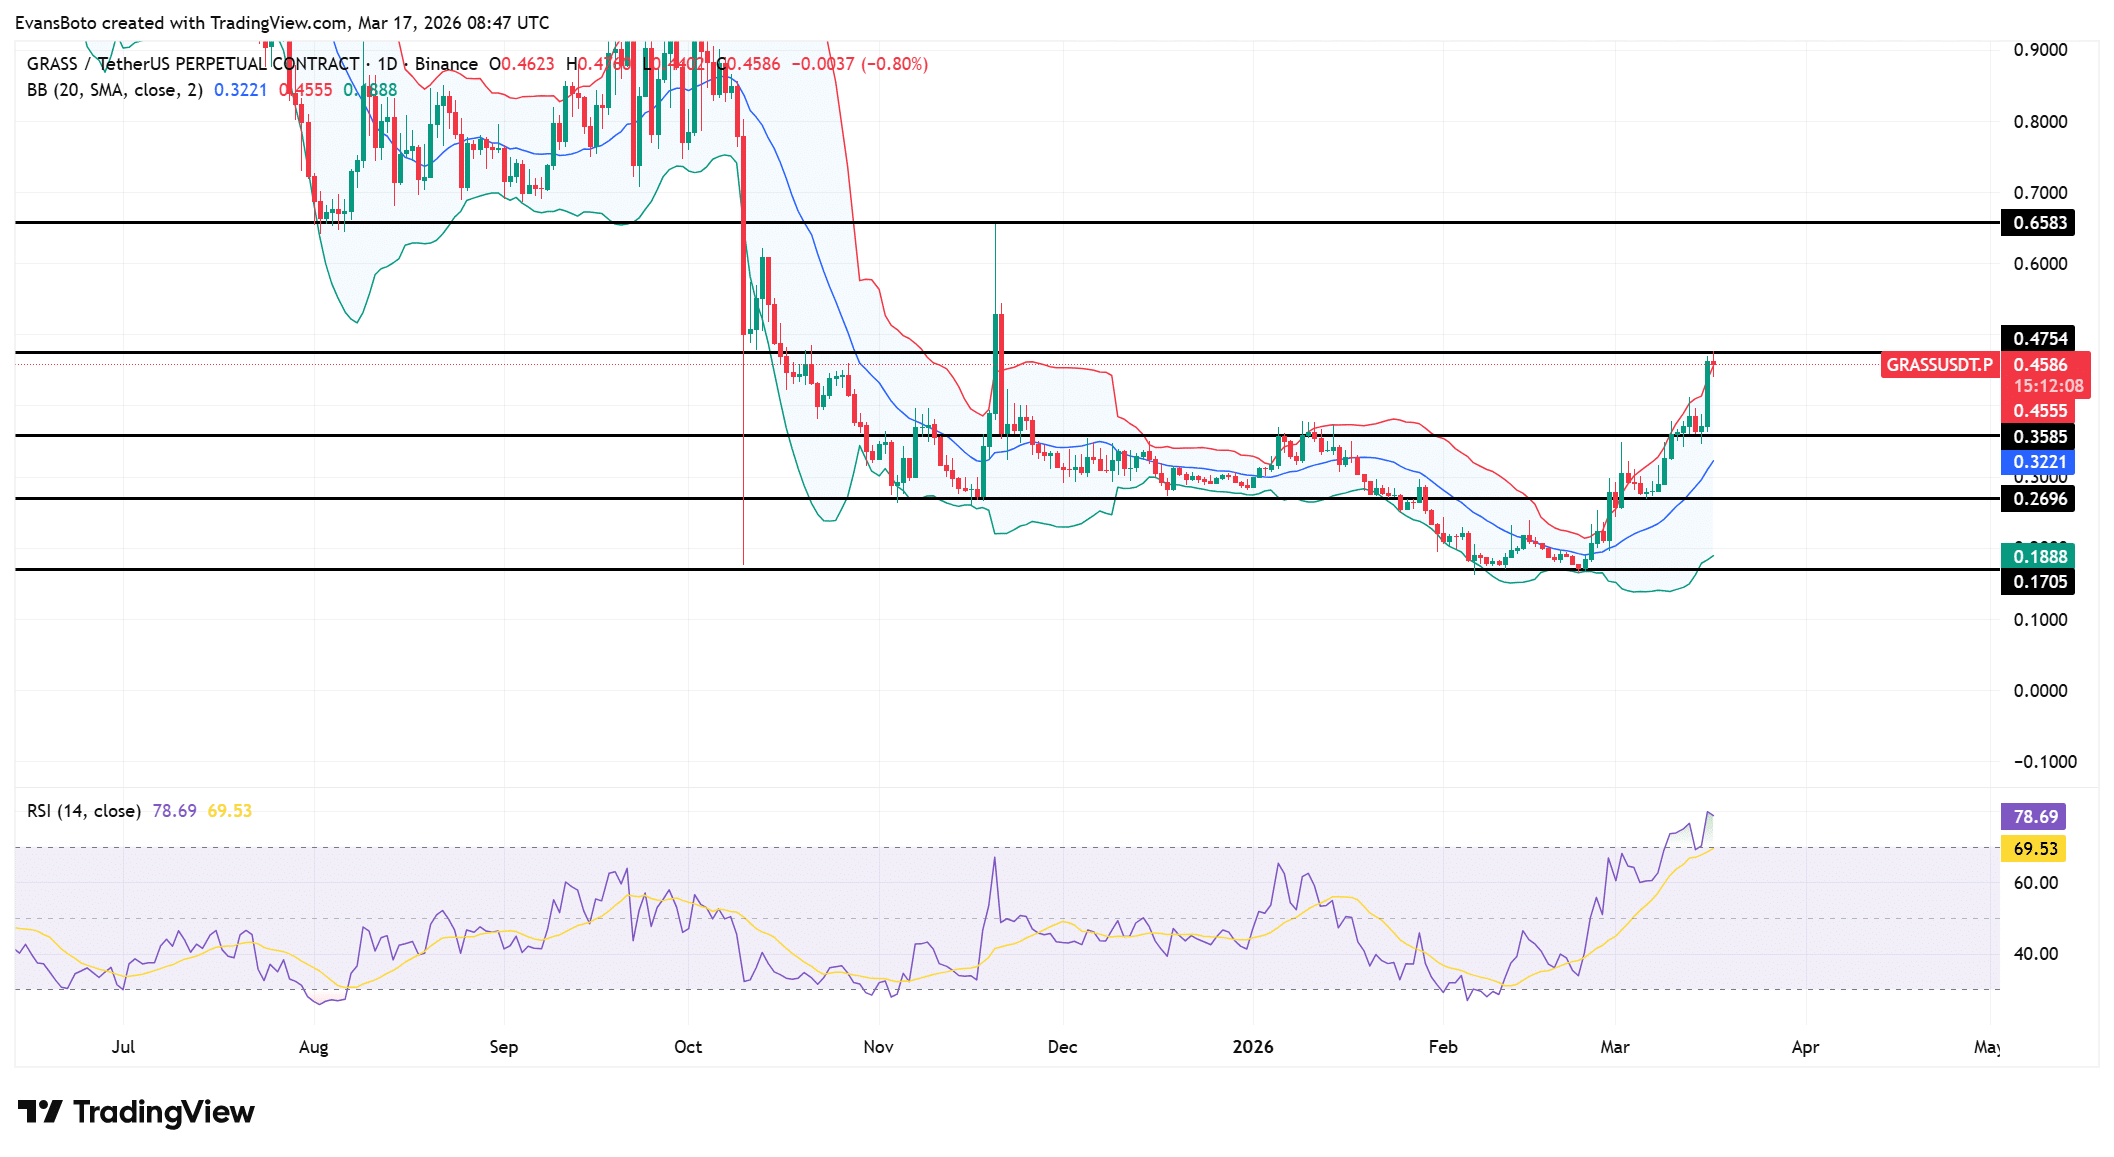
GRASS approaches the $0.475 resistance after reclaiming the $0.358 support zone, confirming a clear structural shift. Buyers have regained control following a prolonged corrective phase, which strengthens the current outlook.

Price has advanced through intermediate levels, supporting the continuation narrative. However, the $0.475 zone now stands as a key barrier that could limit further upside.

A clean move above this level could expose higher resistance near $0.658. Still, rejection at this point could trigger short-term consolidation. Even so, the strong reclaim of $0.358 continues reinforcing bullish control across the structure.

At press time, the Bollinger Bands have expanded sharply as volatility increases following a compression phase. Price continues riding the upper band, which reflects sustained buying pressure and trend strength. This positioning often signals continuation, especially when price holds near elevated levels.

At the same time, RSI has climbed to 78.69, while its signal line remained at 69.53, confirming strong demand. However, these readings place the asset deep in overbought territory.

This condition could introduce short-term cooling, although it does not invalidate the current trend. As long as the price holds near the upper band, buyers continue maintaining control.
Source: TradingView

Why are traders increasing long exposure?

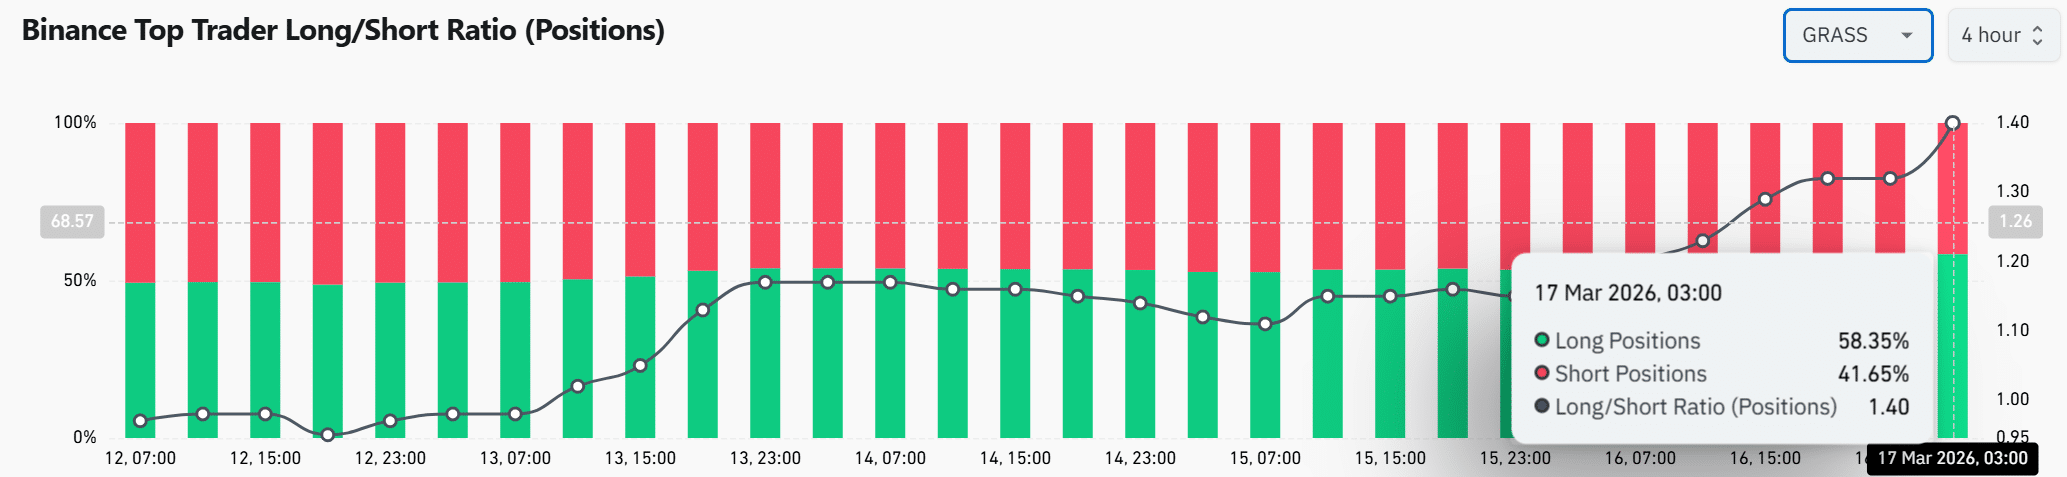
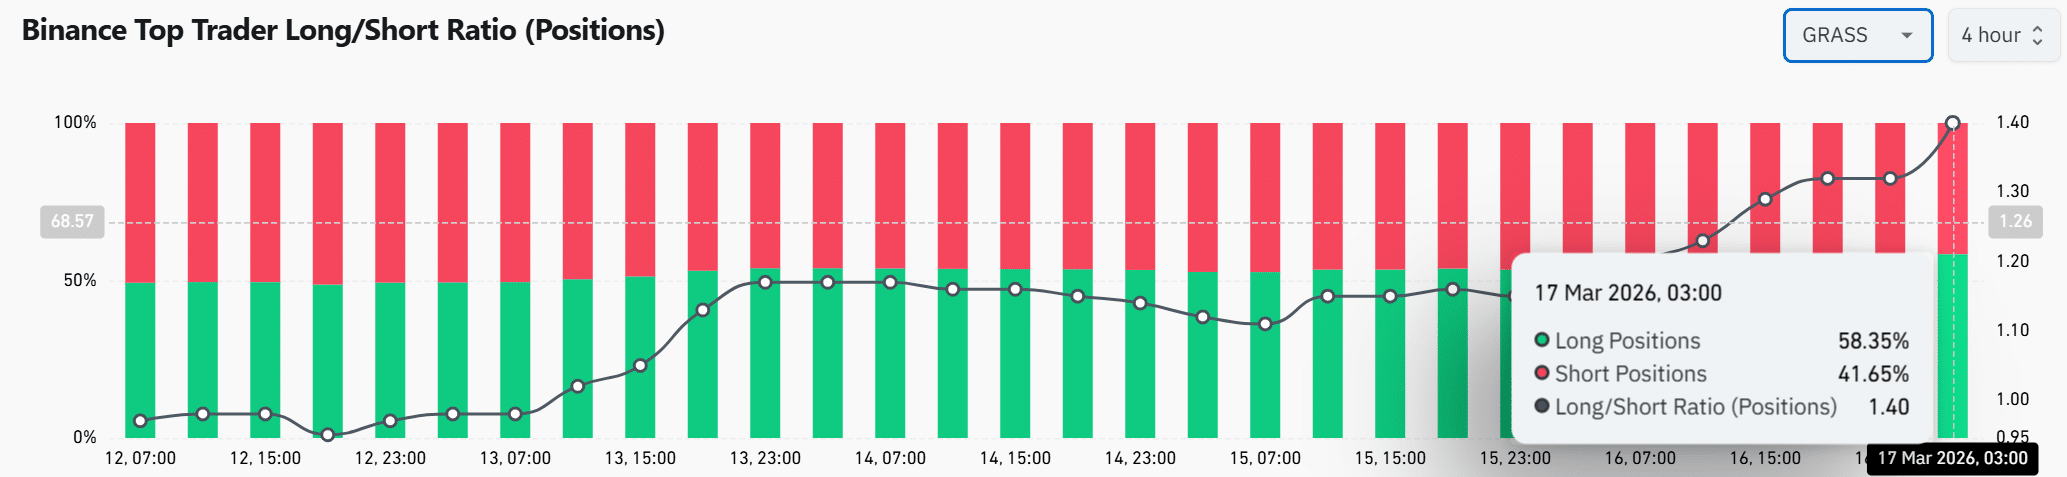
Binance top traders have increased long exposure, with long positions reaching 58.35% compared to 41.65% shorts.

This shift reflects growing confidence in continued upside movement. The Long/Short Ratio has climbed toward 1.40 as of writing, which further supports this directional bias.

As traders continue positioning aggressively, the derivatives market aligns with the current price structure. However, elevated long exposure can introduce risk if sentiment shifts quickly.

Even so, the data shows that traders are still backing the breakout rather than anticipating a reversal. This alignment between sentiment and price strengthens the continuation case.
Source: CoinGlass

Liquidity above $0.48 signals the next move

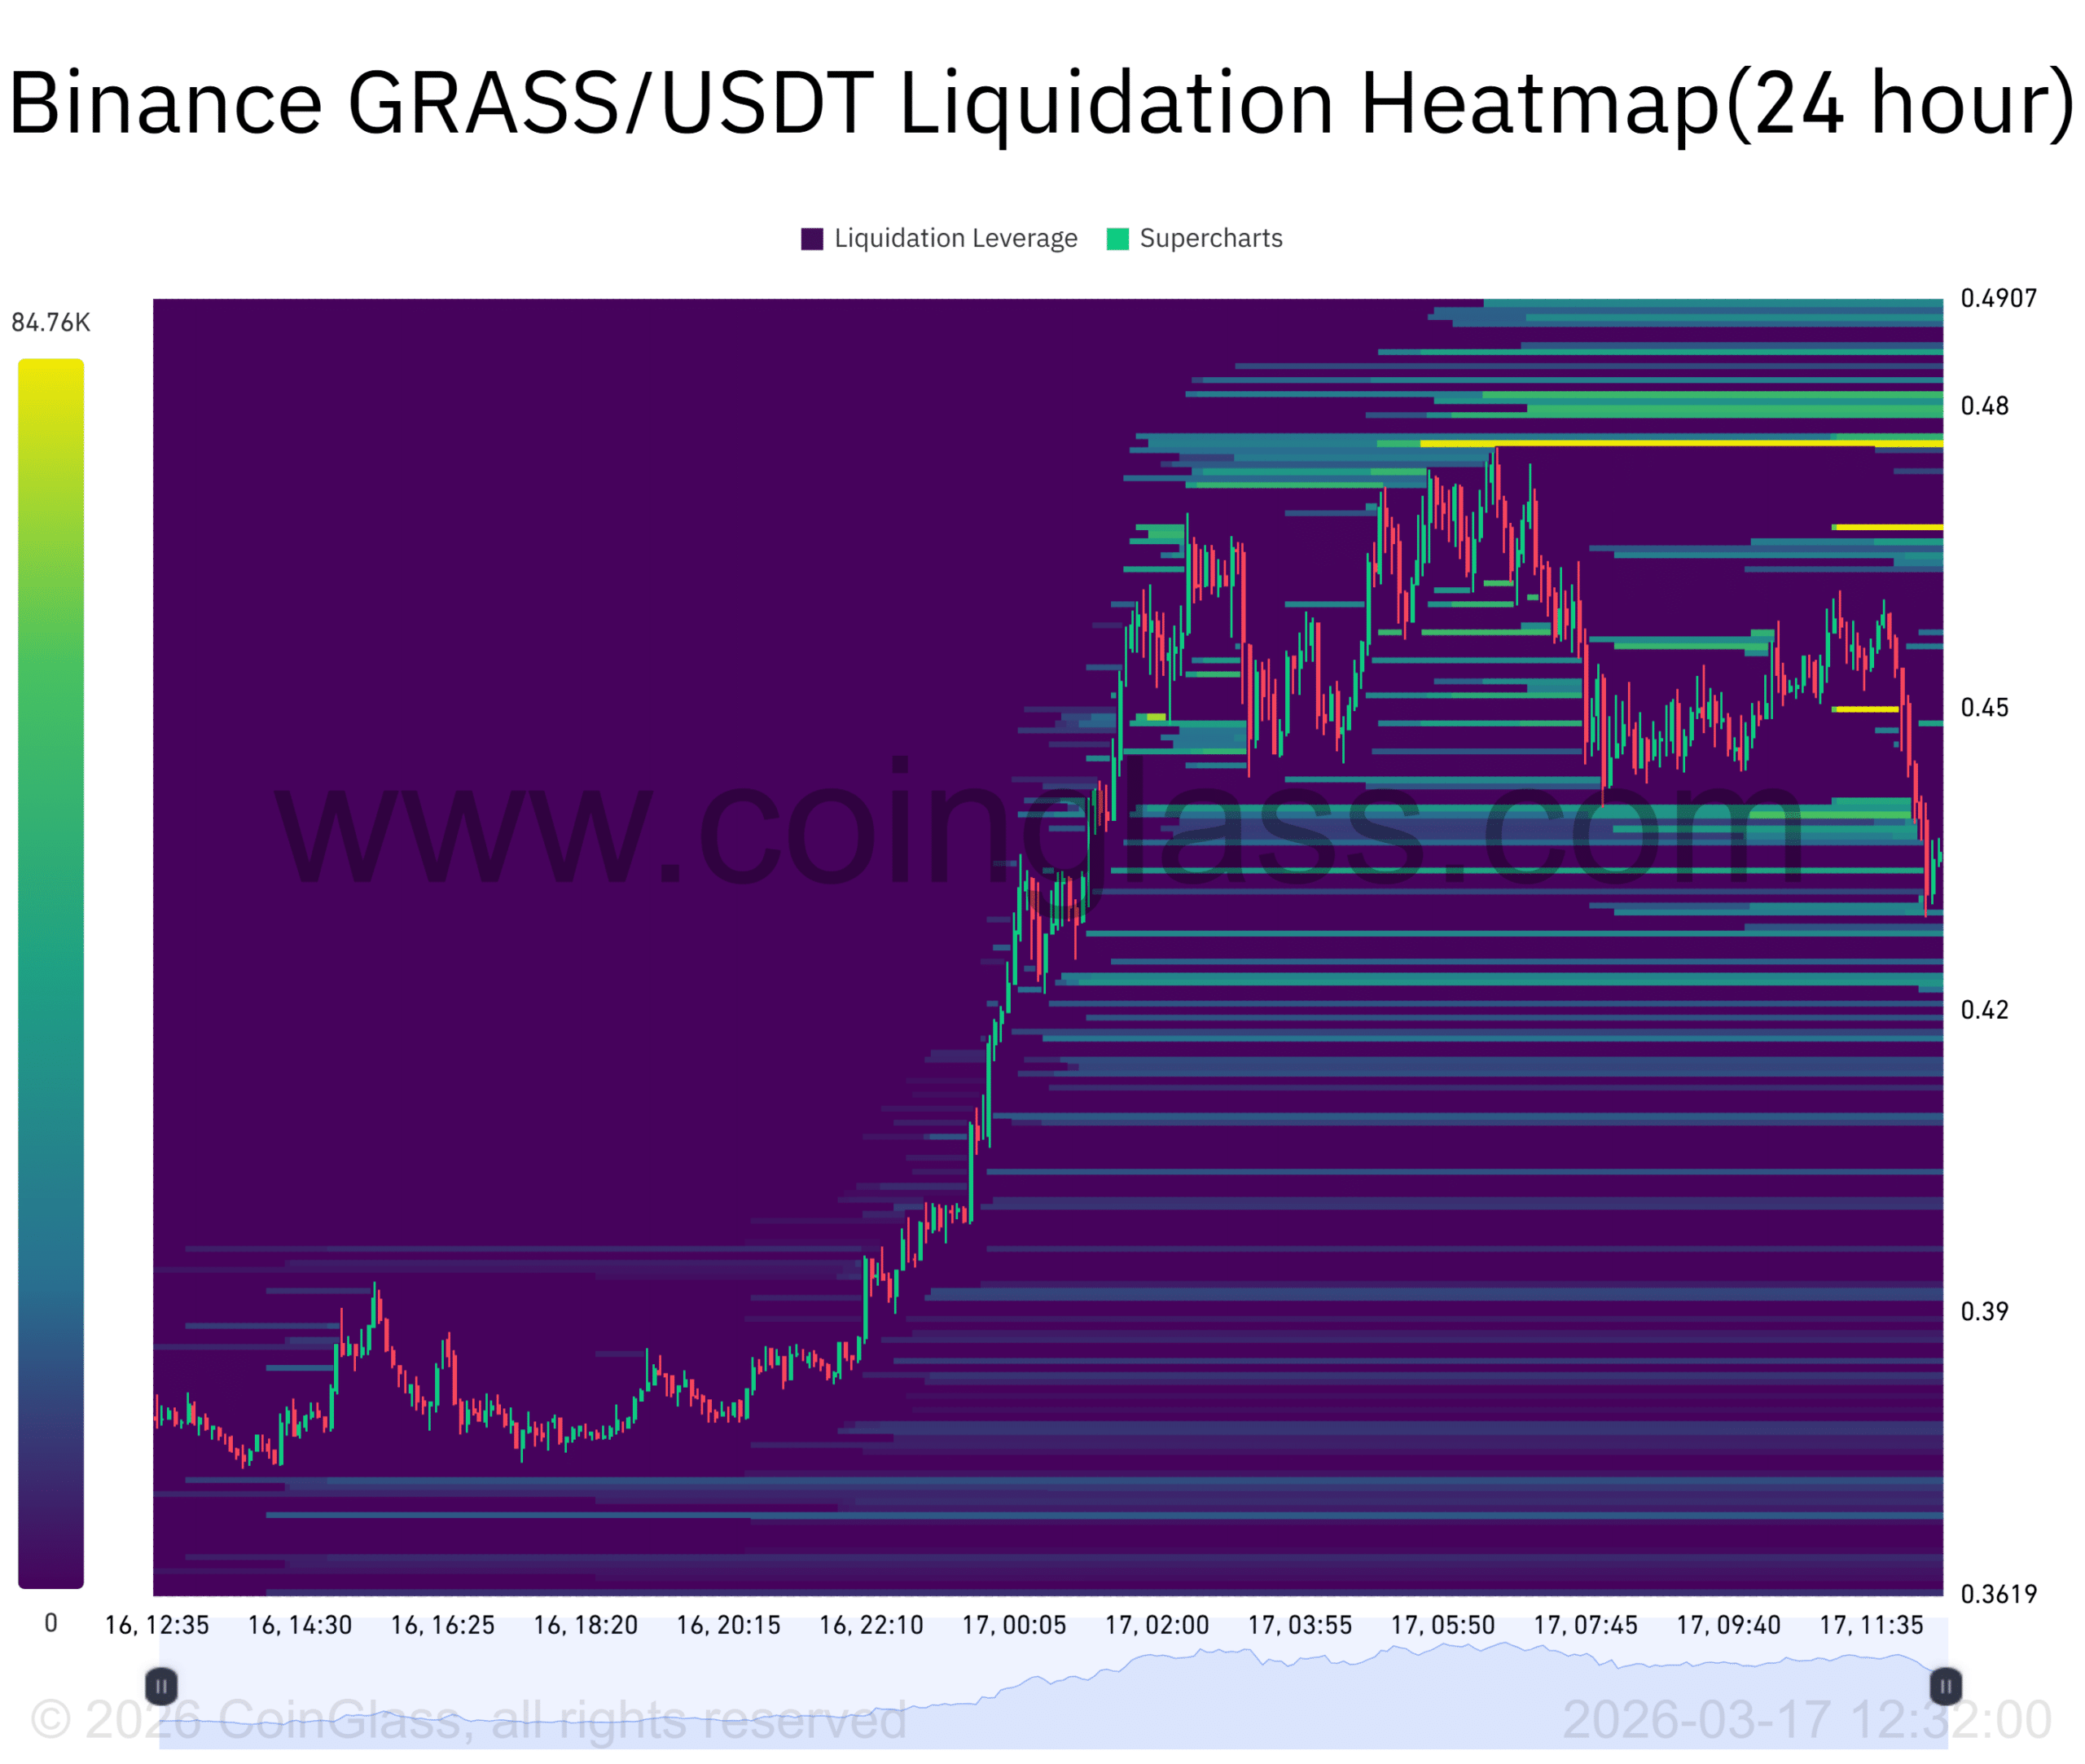
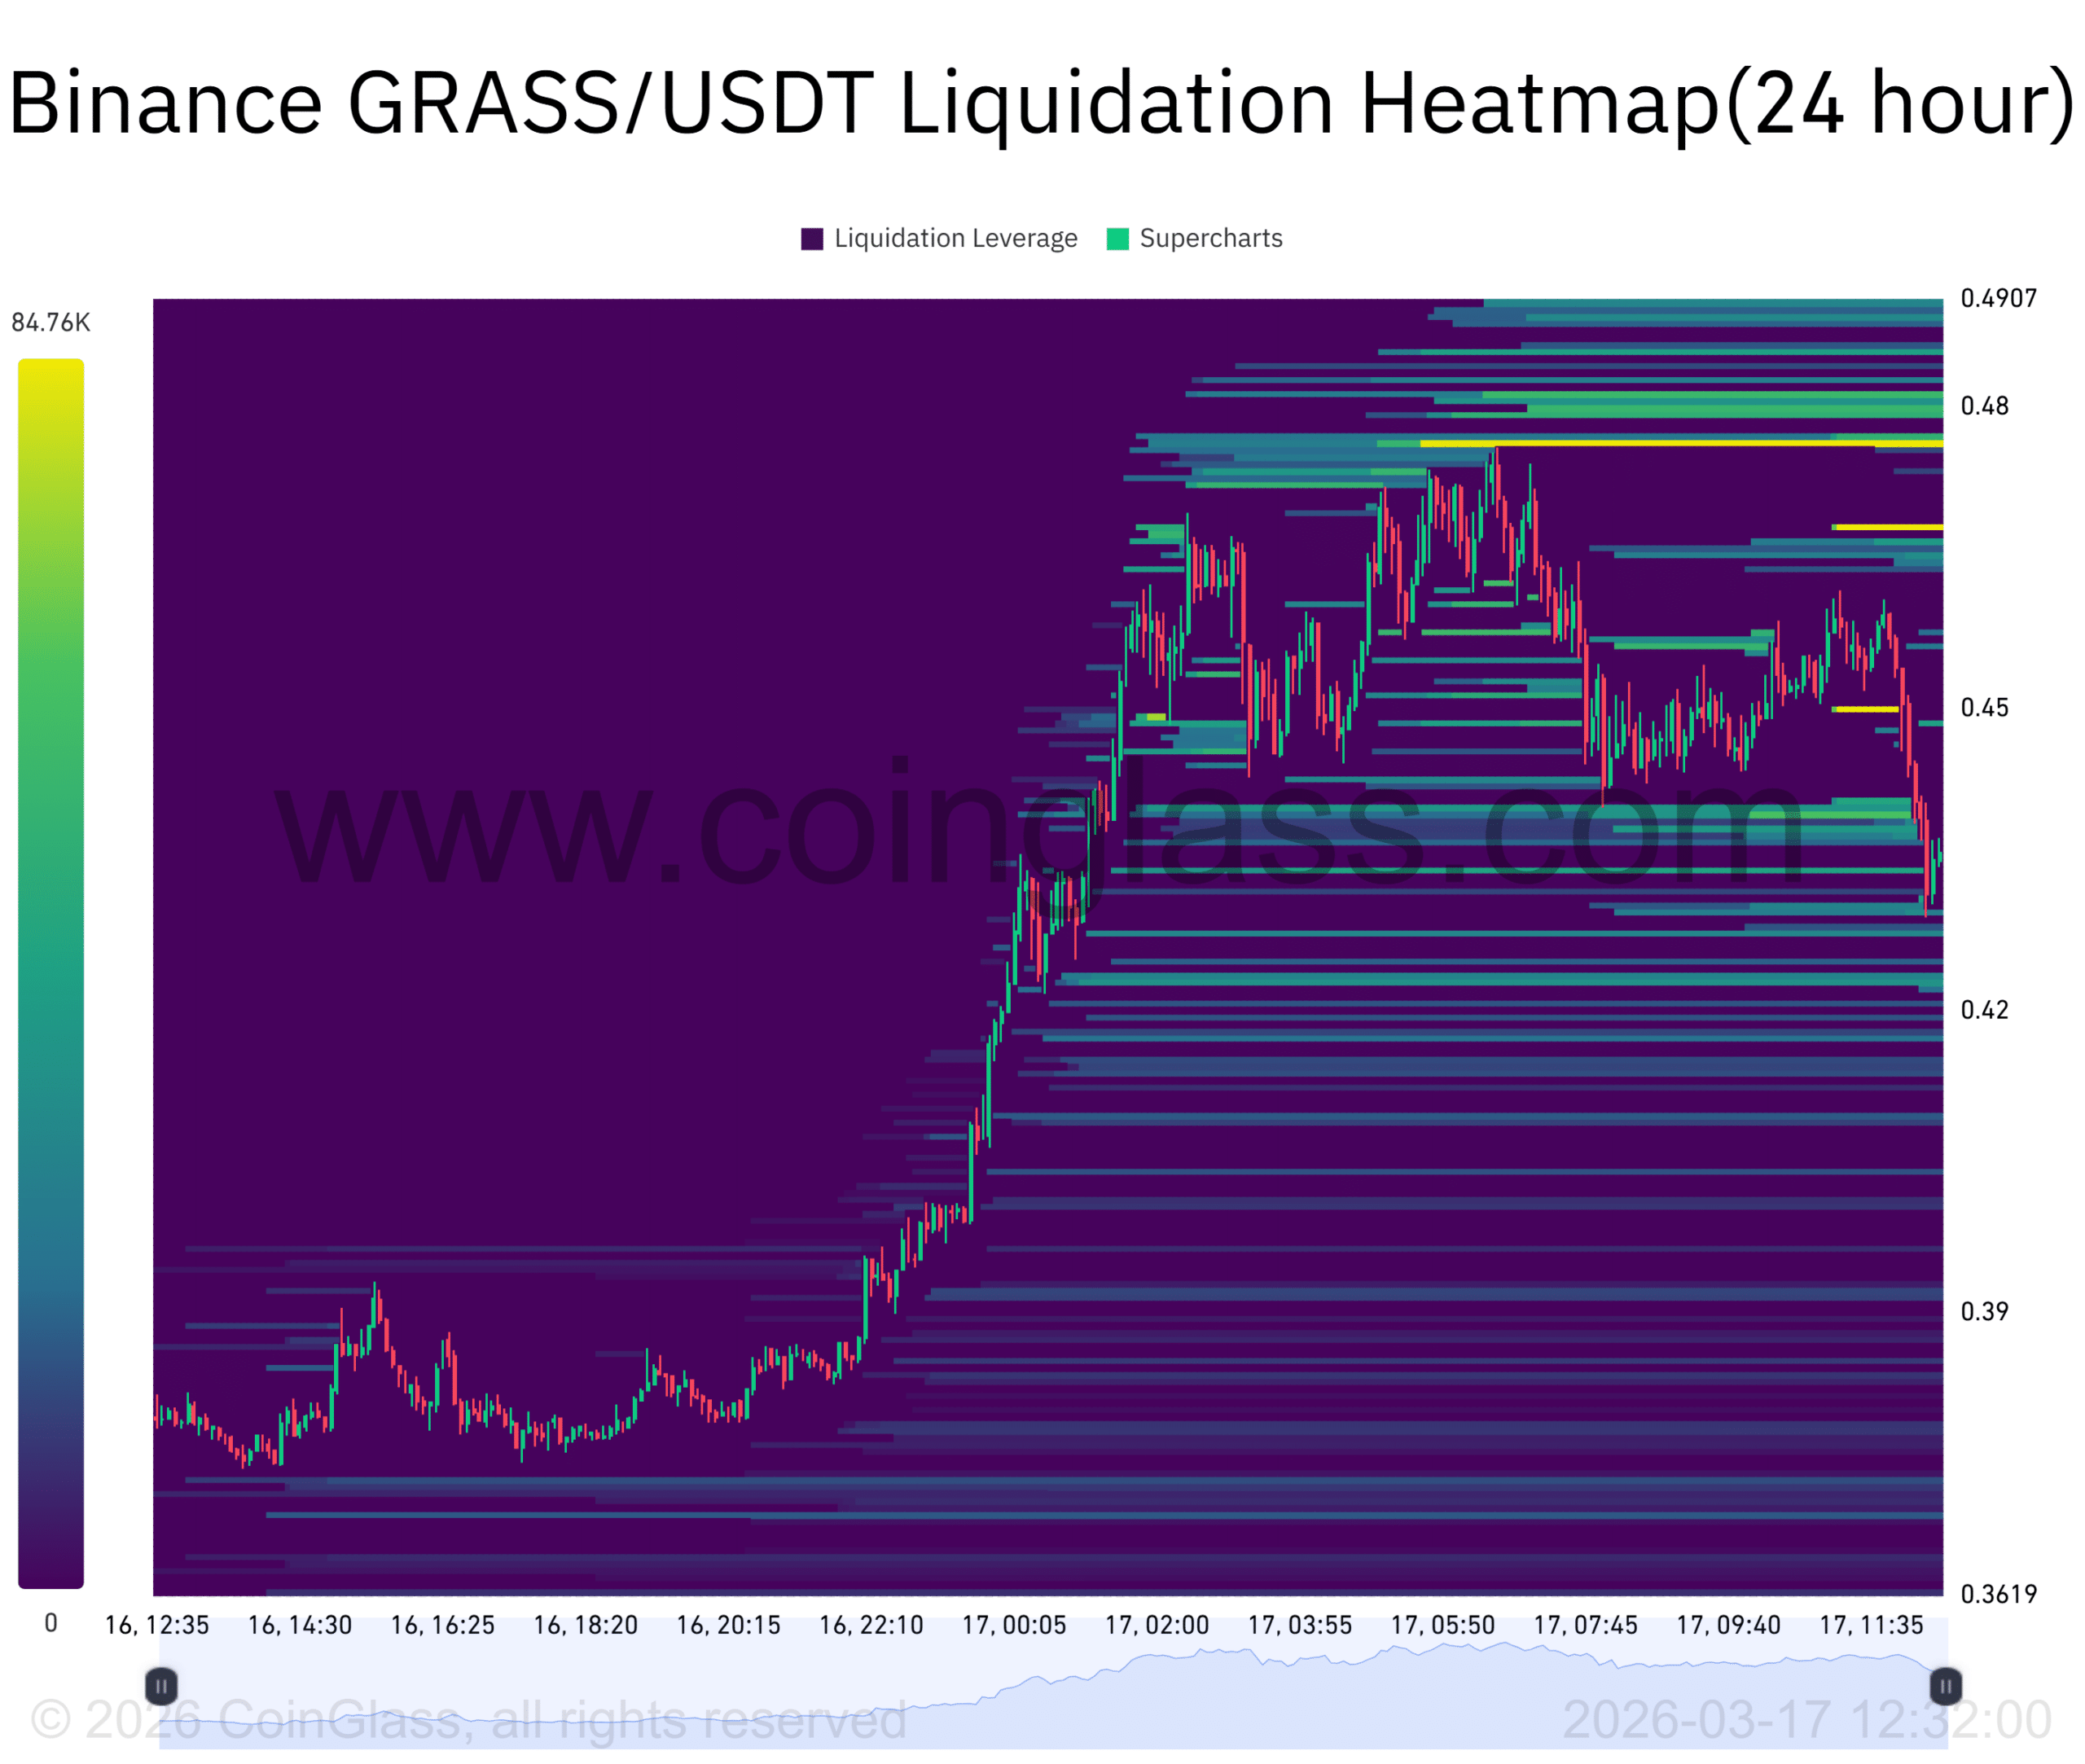
The liquidation heatmap shows dense liquidity clusters forming above the $0.48 region. These zones represent areas where leveraged positions could face forced liquidation. As the price moves closer to these levels, it often gets drawn toward them due to market dynamics.

A break above nearby resistance could trigger cascading liquidations that accelerate the move higher. However, failure to reach these zones could keep the price consolidating below resistance.

Still, the presence of stacked liquidity above current levels suggests that the market has a clear upside target forming in the short term.
Source: CoinGlass

Will GRASS extend beyond resistance?

GRASS continues showing strong upside intent as price presses against the $0.475 resistance while bullish positioning remains dominant. Liquidity stacked above $0.48 supports a potential continuation move if buyers sustain pressure.

However, overbought signals could slow the pace temporarily. If strength holds, price could extend toward $0.49 and gradually test higher resistance zones.


Final Summary

  • Sustained buyer control and rising leverage positioning suggest GRASS could continue climbing if resistance weakens ahead.
  • Overbought conditions may slow prices briefly, yet strong structure still favors gradual upside continuation toward higher liquidity zones.


Crypto di tendenza

Domande pertinenti

QWhat is the current price performance of GRASS crypto and what key resistance level is it approaching?

AGRASS has surged over 28% in the past 24 hours, pushing its price toward the $0.47 region. It is now approaching the key resistance zone at $0.475.

QWhat technical indicators suggest the asset is in overbought territory, and what does this imply for short-term movement?

AThe RSI has climbed to 78.69, which places the asset deep in overbought territory. This condition could introduce short-term cooling or consolidation, but it does not invalidate the current bullish trend.

QHow are Binance top traders positioned in terms of long and short exposure for GRASS?

ABinance top traders have increased long exposure, with long positions reaching 58.35% compared to 41.65% shorts. The Long/Short Ratio has climbed toward 1.40, reflecting growing confidence in continued upside movement.

QWhat does the liquidation heatmap reveal about potential price targets for GRASS?

AThe liquidation heatmap shows dense liquidity clusters forming above the $0.48 region. A break above nearby resistance could trigger cascading liquidations, accelerating the move higher toward these liquidity zones.

QWhat are the two key summary points regarding GRASS's future price outlook?

A1. Sustained buyer control and rising leverage positioning suggest GRASS could continue climbing if resistance weakens ahead. 2. Overbought conditions may slow prices briefly, yet strong structure still favors gradual upside continuation toward higher liquidity zones.

Letture associate

Interview with Robinhood Executive: Meme + Tokenized US Stocks as "Barbell" Customer Acquisition Strategy, All Business Lines Achieve Hundreds of Millions in Revenue

Interview with Robinhood executive Johann Kerbrat reveals the company's "barbell" customer acquisition strategy for its new Robinhood Chain, combining meme tokens with tokenized stocks. Three weeks after mainnet launch, the chain has seen over $3B in weekly DEX volume and 105M transactions. Kerbrat explains the logic behind the permissionless chain: meme tokens attract DeFi users, while tokenized real-world assets (RWA), currently over 90 US stocks and ETFs accessible in 120+ countries, serve global users. The goal is to bring Robinhood's 27 million funded accounts on-chain by simplifying DeFi with a user-friendly interface, exemplified by features like Robinhood Earn which offers yield without requiring wallet management. Built on Arbitrum's technology stack for its speed, low cost, and Ethereum's security, the chain focuses on financial products like Earn, spot trading, and perpetuals. Kerbrat downplays direct competition with platforms like Base, emphasizing the goal of expanding the overall market for on-chain assets. He details selective partnerships (e.g., Morpho, Lighter) based on compliance, unique UX, and differentiation. While regulatory clarity is pending for US perpetuals, the expansion continues via Bitstamp in Europe. Finally, Kerbrat positions Robinhood as a "super app" integrating stocks, options, crypto, banking, and AI trading, with all major business lines generating hundreds of millions in revenue. For the chain, current priority is driving adoption over maximizing gas fee revenue.

marsbit20 min fa

Interview with Robinhood Executive: Meme + Tokenized US Stocks as "Barbell" Customer Acquisition Strategy, All Business Lines Achieve Hundreds of Millions in Revenue

marsbit20 min fa

Fidelity Q3 Report: BTC, ETH, and SOL Continue to Build Bottoms; How Much Further Will This Crypto Bear Market Go?

Fidelity's Q3 Crypto Signal Report analyzes the current bear market, noting Bitcoin (BTC), Ethereum (ETH), and Solana (SOL) are in a prolonged bottoming phase. Key indicators like the weighted Net Unrealized Profit/Loss (NUPL) have turned negative (-0.01), signaling the market is slightly below its aggregate cost basis, with BTC acting as the primary stabilizing asset. BTC's dominance has risen to 68%, indicating a lack of capital rotation to other digital assets. Performance has been weak across the board, with BTC, ETH, and SOL down significantly year-to-date. Market sentiment is depressed, exacerbated by substantial outflows from spot ETPs and a challenging macro environment. The report compares the current ~203-day downtrend to historical ~300-day bottoming cycles, suggesting the process may be two-thirds complete, with late 2026 as a potential timeframe to monitor. For Bitcoin, NUPL at 0.09 indicates cautious sentiment, while momentum signals remain negative. The Yardstick metric points to potential undervaluation relative to network security (hashrate). Ethereum's NUPL is deep in the "capitulation" zone at -0.43, a historically positive signal for future returns, though its momentum and network fee revenue are negative. Solana shows the deepest NUPL at -0.72 but demonstrates relative resilience in on-chain activity and stablecoin transfer volume. The report concludes that while several metrics are near historical capitulation levels, a definitive market bottom has not yet been established. The path forward likely involves continued consolidation, with BTC's relative strength and fundamental on-chain usage for ETH and SOL providing key areas for investor observation.

marsbit35 min fa

Fidelity Q3 Report: BTC, ETH, and SOL Continue to Build Bottoms; How Much Further Will This Crypto Bear Market Go?

marsbit35 min fa

Trading

Spot

Articoli Popolari

Come comprare GRASS

Benvenuto in HTX.com! Abbiamo reso l'acquisto di Grass (GRASS) semplice e conveniente. Segui la nostra guida passo passo per intraprendere il tuo viaggio nel mondo delle criptovalute.Step 1: Crea il tuo Account HTXUsa la tua email o numero di telefono per registrarti il tuo account gratuito su HTX. Vivi un'esperienza facile e sblocca tutte le funzionalità,Crea il mio accountStep 2: Vai in Acquista crypto e seleziona il tuo metodo di pagamentoCarta di credito/debito: utilizza la tua Visa o Mastercard per acquistare immediatamente GrassGRASS.Bilancio: Usa i fondi dal bilancio del tuo account HTX per fare trading senza problemi.Terze parti: abbiamo aggiunto metodi di pagamento molto utilizzati come Google Pay e Apple Pay per maggiore comodità.P2P: Fai trading direttamente con altri utenti HTX.Over-the-Counter (OTC): Offriamo servizi su misura e tassi di cambio competitivi per i trader.Step 3: Conserva Grass (GRASS)Dopo aver acquistato Grass (GRASS), conserva nel tuo account HTX. In alternativa, puoi inviare tramite trasferimento blockchain o scambiare per altre criptovalute.Step 4: Scambia Grass (GRASS)Scambia facilmente Grass (GRASS) nel mercato spot di HTX. Accedi al tuo account, seleziona la tua coppia di trading, esegui le tue operazioni e monitora in tempo reale. Offriamo un'esperienza user-friendly sia per chi ha appena iniziato che per i trader più esperti.

281 Totale visualizzazioniPubblicato il 2024.12.11Aggiornato il 2026.06.02

Come comprare GRASS

Discussioni

Benvenuto nella Community HTX. Qui puoi rimanere informato sugli ultimi sviluppi della piattaforma e accedere ad approfondimenti esperti sul mercato. Le opinioni degli utenti sul prezzo di GRASS GRASS sono presentate come di seguito.

活动图片