The Reality of Payments in Latin America Is Not What You Think
The payment landscape in Latin America is undergoing a fundamental shift, driven by on-the-ground realities that challenge common perceptions. Based on over 500 hours of field research across the region, key insights emerge.
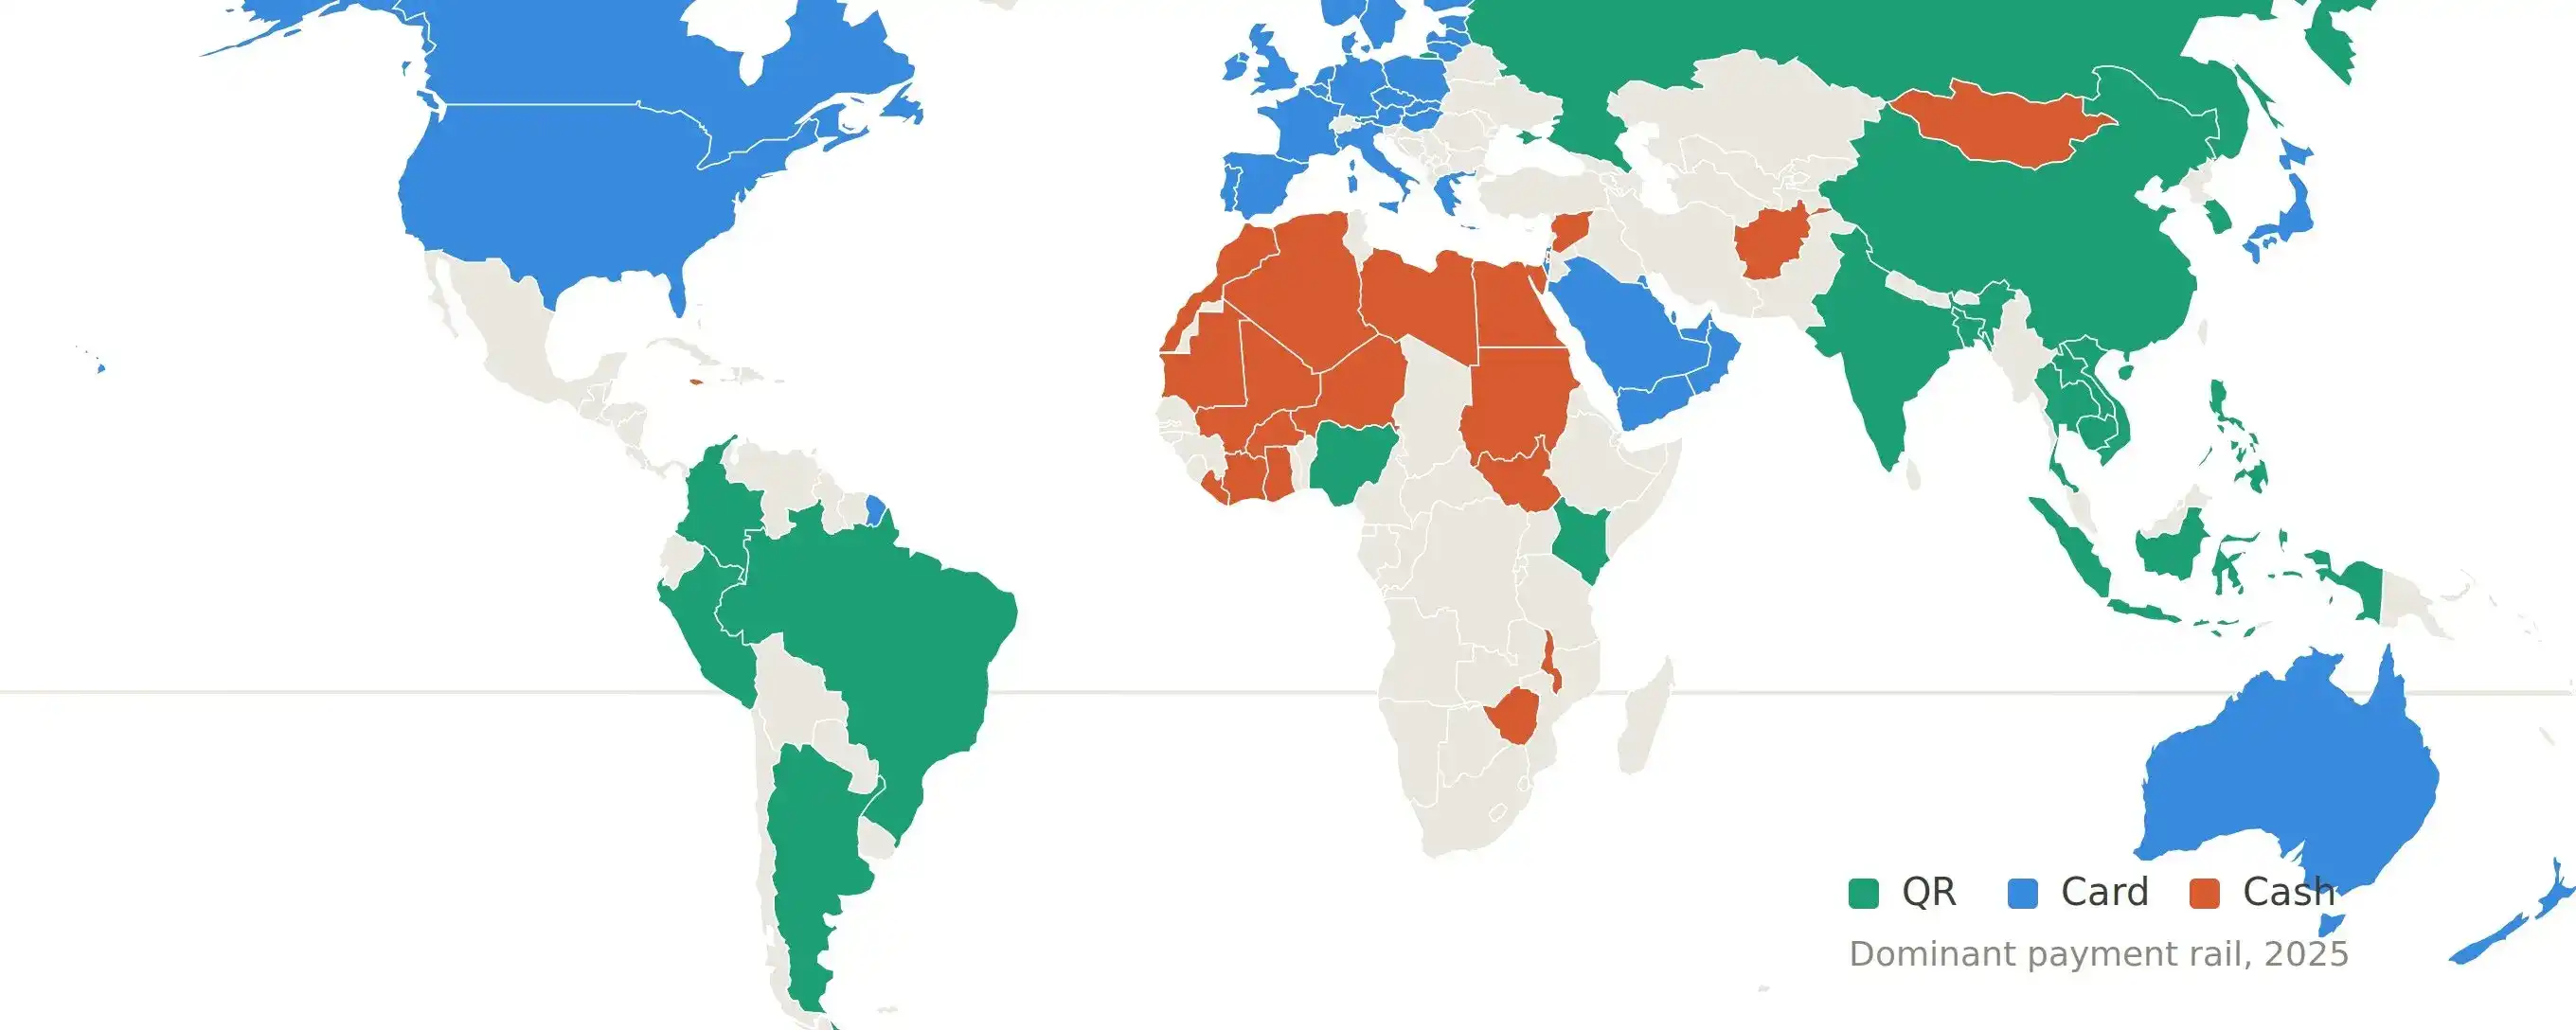
Firstly, QR code payments, like Brazil's Pix, are becoming the dominant payment method in most emerging markets, overtaking cards. However, these domestic instant payment systems lack international interoperability, creating a significant gap for cross-border users.
Secondly, the narrative around crypto cards is often misunderstood; their primary volume comes from high-net-worth professionals using them for salary conversions (e.g., USDT to local currency via Pix), not retail micro-payments. Competition in payments is shifting from customer acquisition to controlling the settlement layer, leading fintechs to acquire banking licenses for efficiency.
Thirdly, treating "Latin America" as a single market is a mistake. Countries like Argentina, Brazil, and Mexico have distinct economic realities, user segments, and regulatory approaches. Brazil alone has at least five distinct user segments with different financial flows. Overlooked markets like Guatemala, Honduras, and El Salvador (the "forgotten five") offer high remittance volumes with lower competitive density.
Finally, regulation in Latin America is often ahead of the US, with clearer frameworks for digital assets and a pragmatic approach from regulators focused on safety rather than obstruction. The margin on stablecoin forex is rapidly compressing toward zero, meaning future winners will be those building value-added services on top of the infrastructure, not just the cheapest exchange.
marsbit1 h fa