经济衰退恐慌引发血洗:加密市场为何暴跌?

币界网Pubblicato 2024-08-05Pubblicato ultima volta 2024-08-05

币界网报道:

作者:Stacy Muur 来源:substack 翻译:善欧巴,

上一次我们看到加密货币市值出现类似的下跌是在 7 月初,当时德国开始抛售 BTC。这一次,催化剂来自 Web2,特别是股票市场。

股市、利率和失业率

首先,让我们解释一些对全球经济至关重要的基本因素,这些因素直接影响股市和加密货币市场。

利率下调: 当利率下降时,公司可以以更低的成本借入资金,并更有效地再投资其收入。这被视为股市的积极信号,因为经济环境变得更加有利。

现在,让我们深入了解目前的戏剧性事件。

7月31日:杰罗姆·鲍威尔宣布,如果美国经济按照预期发展,利率可能会在9月降息。这一潜在的降息已经被纳入股价,成为推动过去几个月股市增长的明显利好催化剂。

h41ZTUfw67fFcmefKad1FWFEjNOi4AKXksj7AGuh.png

8月2日:劳工部发布就业报告,显示美国7月失业率跃升至4.3%,接近三年来最高水平。 这一增长增加了立即降息的可能性——越早越好——但也对美国经济投下了不同的阴影:失业率的增长高于预期。

Szk61TPHi8oHB2c3nuShh2POjcFebGt0DiwJsbIa.png

6 月份,美国央行决策者预计今年仅会降息一次,并预计年底失业率将达到 4%。然而,鉴于目前的情况,降息多次是有可能的。

你可能会争辩说:“降息是好事——这正是你所说的。

是的,但失业率是更关键的潜在利空催化剂。7 月份失业率的上升引发了所谓的萨姆规则,这是历史上准确的经济衰退早期指标。

OulyUT1MgLdggknnILEjI2e2KOkFa4hjPSZw7AZ9.png

接下来发生了什么?一连串的恐慌性抛售。

细节决定成败

正如媒体头条通常所表现的那样,报道的焦点(往往是夸张的)首先出现,更多的背景信息在接近结尾处才揭晓,但结尾处的阅读率最低。

首先,请注意飓风贝丽尔。家庭调查显示,上个月有 436,000 人报告称他们因恶劣天气而无法工作,这是 7 月份的最高纪录。此外,还有 249,000 人暂时被解雇。

YgJXQOF7WERLKekdAsPm7zpARDy6H1bDiLdxu7es.png

其次,考虑移民问题。上个月,约有 42 万人进入劳动力市场,而家庭就业岗位仅增加了 6.7 万个。出于经济原因从事兼职工作的人数增加了 34.6 万人,达到 460 万人。然而,永久性失业和长期失业人数几乎没有变化。

曾在美联储工作的经济学家、萨姆规则的创始人克劳迪娅·萨姆 (Claudia Sahm) 警告称,不要从她的规则中获取过于强烈的信号。

长话短说,对经济衰退的担忧可能被夸大了——但弱点确实存在,需要加以解决。

日本加息

全球重新定价的第二个催化剂是日本央行将利率目标上调至0.25%——这是自2008年以来的最高水平。

Nyjc4WJFdNMO8eUYC9e2eWzox6xSsaV11o0C9u2o.png

在负利率时期,许多日本投资者以低利率借入日元购买高收益的美国国债,这种做法通常被称为“套利交易”。然而,随着日本央行提高利率,这种交易变得不那么有效,一些投资者可能会把这些钱带回国内。

恐慌是毒药

无论原因如何,下一份就业报告和联邦公开市场委员会关于降息的进一步行动将在市场定价中发挥根本性作用。

  • 该消息一经发布,股市立即做出反应。

  • 美元兑一篮子货币汇率跌至四个月来的最低点。

  • 美国国债价格上涨,基准10年期国债收益率跌至12月以来的最低水平。

  • 芝加哥期权交易所波动率指数升至4月份以来的最高水平。

  • 日本日经指数也下跌近5%,创下2022年以来的最大单日跌幅。

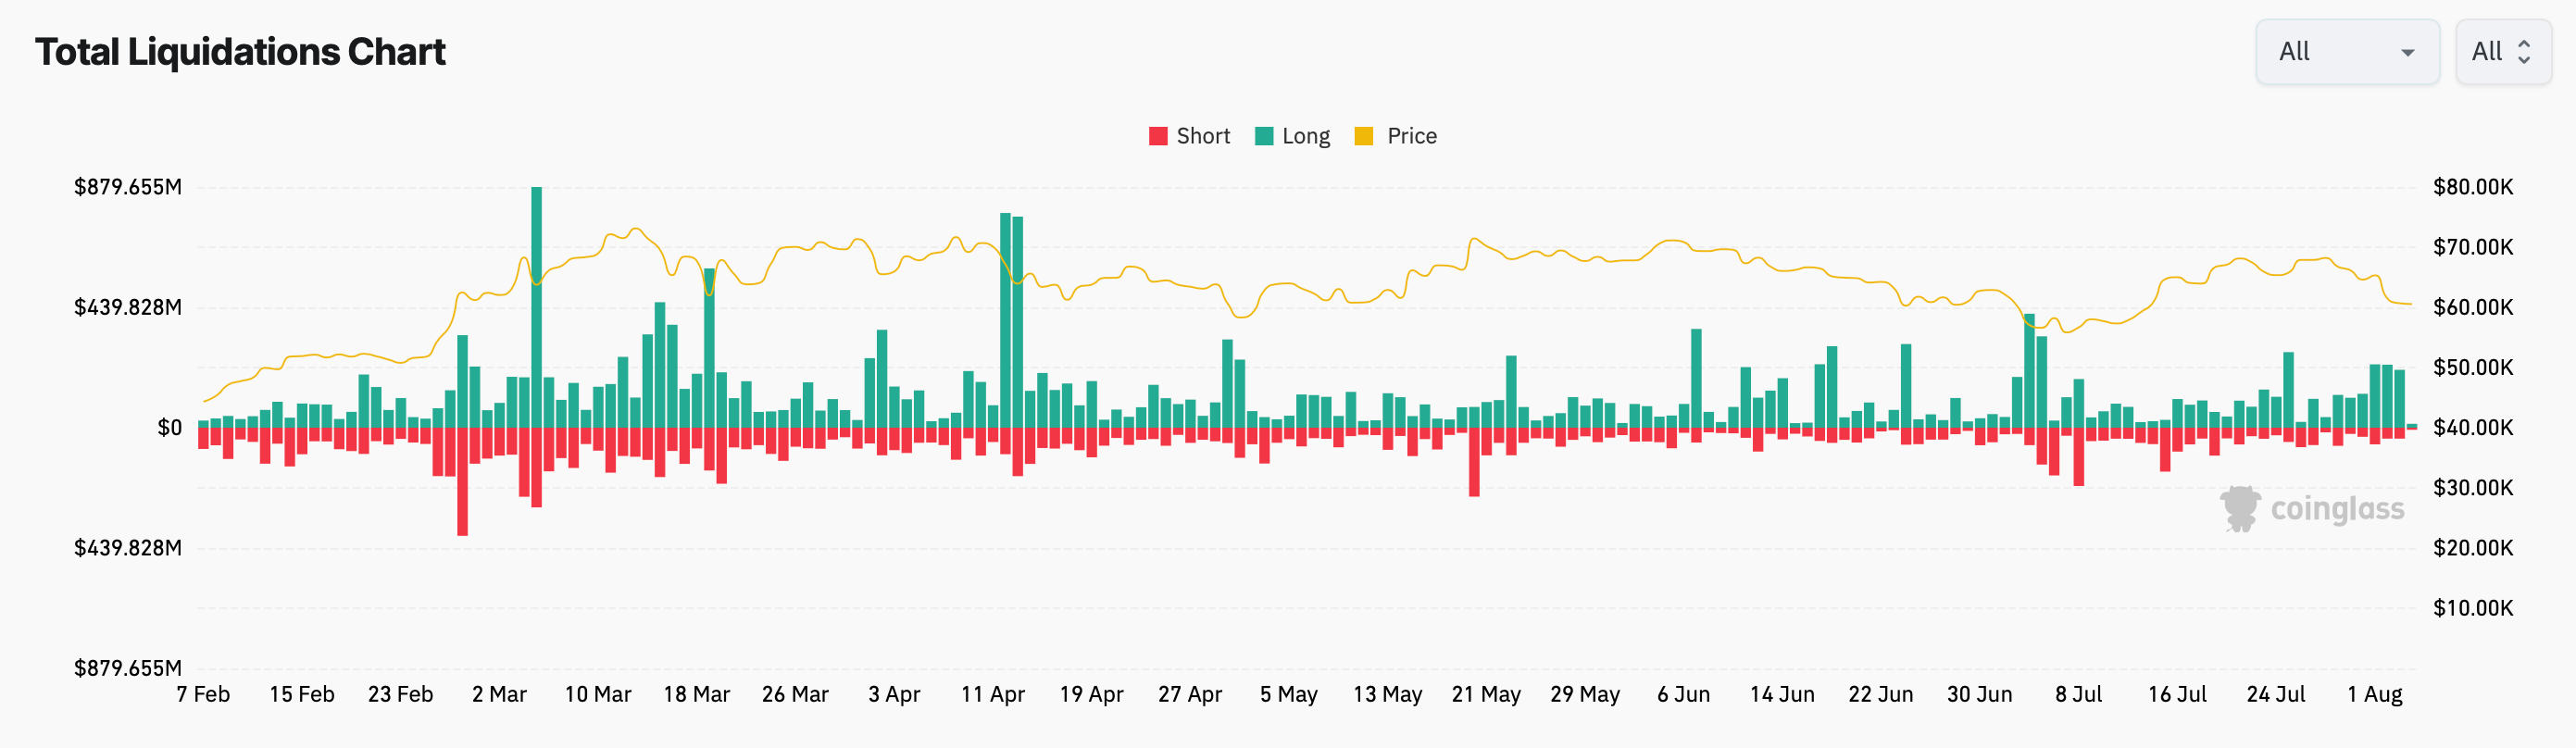
自然,这场动荡影响了加密货币市场,导致了一系列的长期清算。

来源:CoinGlass 总清算图表

下一步是什么?

周一波动预期

与股票不同,加密货币是 24/7 全天候交易的。在我看来,股市很可能会在周一继续下跌,这将拖累加密货币市场走低。下周的公告将在抑制恐慌方面发挥根本作用,但不会产生立竿见影的效果。

进一步的行动

另一个不容忽视的催化剂是美国大选。美国将努力保持经济的吸引力,因此中期股市波动可能会受到抑制。

加密货币市场

当谈到加密货币的进一步走势时,我倾向于同意Revelo Intel 的预期,而不是对 ? 如此普遍的看涨论点。希望并不是最好的投资策略。

  • 新的高 FDV 代币(例如 Monad、Berachain、Scroll 以及可能的 Linea)将进入市场,稀释投资组合中其他代币的流动性和交易量。

  • 考虑到对经济衰退的担忧以及美国大选后预计将出现的现实情况,减半后的牵引力预期可能过于乐观。

  • 围绕加密货币的社会情绪也不乐观(我将在下周晚些时候发布深入分析)。普通人没有理由在未来几个月内急于购买比特币。

换句话说,我个人预计8 月和 9 月市场将持平。比特币可能会保持在 60,000 美元至 65,000 美元区间,而以太坊则接近 3,000 美元。然而,这种情况随时可能发生变化,我是根据目前掌握的事实得出结论的。

Letture associate

Rented Faith: How Much of the Bitcoin ETF Inflows Is Real Money?

"Rented Conviction: How Much of Bitcoin ETF Flows Is Real Money" The weekly inflows into Bitcoin ETFs are often interpreted as a gauge of institutional belief. However, a significant portion of this activity is driven by a hidden arbitrage trade, not directional conviction. The core mechanism is a cash-and-carry arbitrage: traders buy spot Bitcoin (often via ETFs) while simultaneously shorting CME futures to lock in the price difference, or "basis." This delta-neutral trade is essentially an interest rate play. In weekly data, about half the fluctuation in ETF flows can be explained by new short positions added by leveraged funds (hedge funds), with a correlation of 0.70. Bitcoin's price movement in a given week shows no statistical power in predicting these flows. While this arbitrage trade drives weekly *volatility*, it is not the main component of the cumulative *stock*. Of the total ~$55 billion in net ETF inflows, the current net arbitrage position is only about $1 billion. The remainder is steady, directional buying averaging ~$400 million per week, which constitutes the vast majority of the accumulated "mountain" over two years. Thus, ETF flow data overstates the *volatility* of conviction, not its *level*. This arbitrage trade has been unwinding for nearly two years. Leveraged fund short positions peaked at ~$14 billion in late 2024 and have since declined to ~$4.5 billion. When the basis compresses to unprofitable levels, ETF inflows and short positions retreat together. Recent outflows should not be mistaken for a loss of faith but rather the routine unwinding of this rate trade. For Ethereum ETFs, the pattern is weaker. Accounting for staking yield makes the basis often negative, so neither strong conviction buying nor robust arbitrage supports its flows. To interpret ETF flows correctly, monitor the CME basis versus T-bill rates and leveraged fund net shorts. They reveal how much of the next "demand" headline is real. The real, patient buy-and-hold demand is what constitutes the enduring bulk of ETF assets.

marsbit23 min fa

Rented Faith: How Much of the Bitcoin ETF Inflows Is Real Money?

marsbit23 min fa

Soaring Over Tenfold Within the Year: The Frenzy Over SK Hynix Leveraged Products

South China Morning Post The leveraged ETF tracking SK Hynix has surged over tenfold year-to-date, fueled by intense market speculation on the memory chip sector. By June 22, the value of the 'South Korea 2x Long SK Hynix ETF' listed in Hong Kong had skyrocketed by more than 1,061% since the start of the year, while its asset size exploded over twenty times from the end of last year. The rally is driven by AI-driven demand for high-bandwidth memory (HBM), with SK Hynix recently sampling its next-generation HBM4E product. However, industry professionals warn of significant risks. Leveraged ETFs magnify both gains and losses. During a recent market correction, while the underlying SK Hynix stock fell 19.1%, its double-leveraged ETF dropped nearly 38%. Korean regulators noted that such products could theoretically lose 60% in a single day. Additionally, these ETFs face risks like time decay in volatile markets, liquidity spirals during mass redemptions, and extreme price dislocations from market-making failures, as seen in early June when an ETF moved opposite to its underlying stock. The trading is predominantly driven by retail investors, with institutional capital largely absent due to the products' high volatility. Analysts caution that with the semiconductor sector at elevated valuations and facing geopolitical and supply chain uncertainties, leveraged ETFs pose a substantial threat of amplified losses for uninformed investors.

marsbit1 h fa

Soaring Over Tenfold Within the Year: The Frenzy Over SK Hynix Leveraged Products

marsbit1 h fa

18 Months, Over 50x Surge: KIOXIA's Epic Comeback

KIOXIA, a NAND flash memory giant, staged a dramatic comeback driven by AI demand. After a period of significant losses, a failed merger, and missed HBM opportunities, its 2024 IPO began modestly. However, fueled by explosive demand for AI data storage, its stock price skyrocketed over 50 times within 18 months, making it Japan's most valuable company, surpassing Toyota. Its Q1 FY2026 profit guidance soared 30-fold year-over-year, with 2026 NAND capacity already sold out. Key to its success is its 3D NAND technology, BiCS FLASH. As the inventor of NAND, KIOXIA advanced its technology through generations, reaching over 200 layers by 2023. Key innovations include CBA (CMOS directly Bonded to Array), which separately manufactures control circuits and memory arrays for better performance, and OPS (On Pitch Select Gate) to increase density. The company is now developing high-capacity packages like an 8TB solution stacking 32 dies. Looking beyond NAND, KIOXIA is exploring 3D DRAM with its OCTRAM technology, using oxide semiconductor transistors for ultra-low leakage to reduce power consumption. This fundamental research differs from HBM and represents a long-term bet to extend its 3D expertise from NAND into future DRAM architectures. KIOXIA's story highlights how technological assets and shifting market cycles can rapidly transform a company's fortunes. While questions remain about sustaining growth beyond the current AI boom, its resurgence demonstrates that in semiconductors, being down does not necessarily mean being out.

marsbit1 h fa

18 Months, Over 50x Surge: KIOXIA's Epic Comeback

marsbit1 h fa

Market Trends in U.S. Stocks (June 23): Peak at Listing? SpaceX Loses Over $800 Billion in Three Days, Tech Stocks Experience Severe Internal Divergence

Stock Market Trends (June 23): Did SpaceX Peak at IPO? The company loses over $800 billion in market value in three days as a sharp divergence unfolds within the tech sector. SpaceX's post-IPO decline of over 20%, falling below its first-day close, reflects a swift market repricing. The catalyst is a clear shift in narrative from "AI platform potential" to concerns over rising capital costs, as its $8.57 billion IPO and subsequent $20 billion debt offering are earmarked for acquisitions and refinancing existing bridge loans rather than de-leveraging. While high-valuation tech stocks like Google, Meta, Amazon, and Microsoft faced pressure, Micron surged nearly 7% to a record high following a strategic supply deal with Anthropic for HBM and memory, highlighting robust, tangible demand in AI infrastructure. The broader market saw funds rotate into more defensive industrial and financial names. Macro factors included a dip in oil prices to a three-month low on news of a US-Iran framework deal, though logistical hurdles for resuming full Strait of Hormuz shipments remain. Key events ahead include Nvidia's shareholder meeting, Micron's earnings, and the May PCE inflation data. The latter will be crucial in determining whether the sell-off in high-valuation growth stocks, which appears to have just begun, will persist.

marsbit1 h fa

Market Trends in U.S. Stocks (June 23): Peak at Listing? SpaceX Loses Over $800 Billion in Three Days, Tech Stocks Experience Severe Internal Divergence

marsbit1 h fa

Trading

Spot
Futures
活动图片