Glassnode & Coinbase :2024 年 Q3 加密货币市场指南

深潮Pubblicato 2024-08-05Pubblicato ultima volta 2024-08-05

探讨链上活动的迅速增长、ETF 的变革性影响以及当前市场周期所处的阶段。

撰文:Glassnode

翻译:白话区块链

我们很高兴发布我们季度系列的第三版《加密市场指南》,这是与 Coinbase Institutional 合作制作的。这份报告对每个季度加密市场的关键发展进行了深入分析,包括价格表现、链上分析、行业事件和衍生品数据。

与之前的版本一样,我们的目标是通过基于链上数据的可操作洞察,为机构交易者和投资者提供对数字资产市场的更好理解。本版侧重于三个主要洞察:链上活动的迅速增加、ETF 的变革性影响以及对当前市场周期的分析。

关键亮点:

市场周期的评估:加密市场以其独特的涨跌周期著称。最新数据显示,尽管第二季度有所回落,我们可能处于自 2022 年底开始的当前牛市周期的中期。历史模式表明,这种调整是典型的,与以往的市场行为一致。

ETF 改变了格局:现货比特币 ETF 在六个月内积累了近 500 亿美元的资产管理规模(AUM),吸引了新投资者并加深了市场流动性。ETF 引入了一种受监管且熟悉的投资工具,补充了现有的选择,对整个加密生态系统产生了积极影响。

链上活动快速增加:在过去六个月中,各种指标如总锁仓价值(TVL)、活跃地址和用户基础规模显示出链上活动的显著增长。这种激增由各种用例推动,包括借代、质押和交易。随着现有用例的成熟和新创新的出现,预计链上采用将进一步增长。

1、第三季度的关键趋势

以下是过去一个季度中值得从投资者角度关注的一些趋势:

1)投资者盈利趋势与 MVRV

MVRV 动量是一个有助于分析师监测市场趋势的工具。它通过追踪投资者持有的未实现利润倍数(MVRV)相对于其 365 天移动平均线的变化来进行分析。

当 MVRV 交易高于其 365 天均值时,通常表明强劲的上升趋势和投资者盈利能力改善,往往导致在市场调整期间增加头寸。相反,当 MVRV 跌破 365 天均值时,往往预示着显著的未实现损失,增加了不确定性和避险决策。

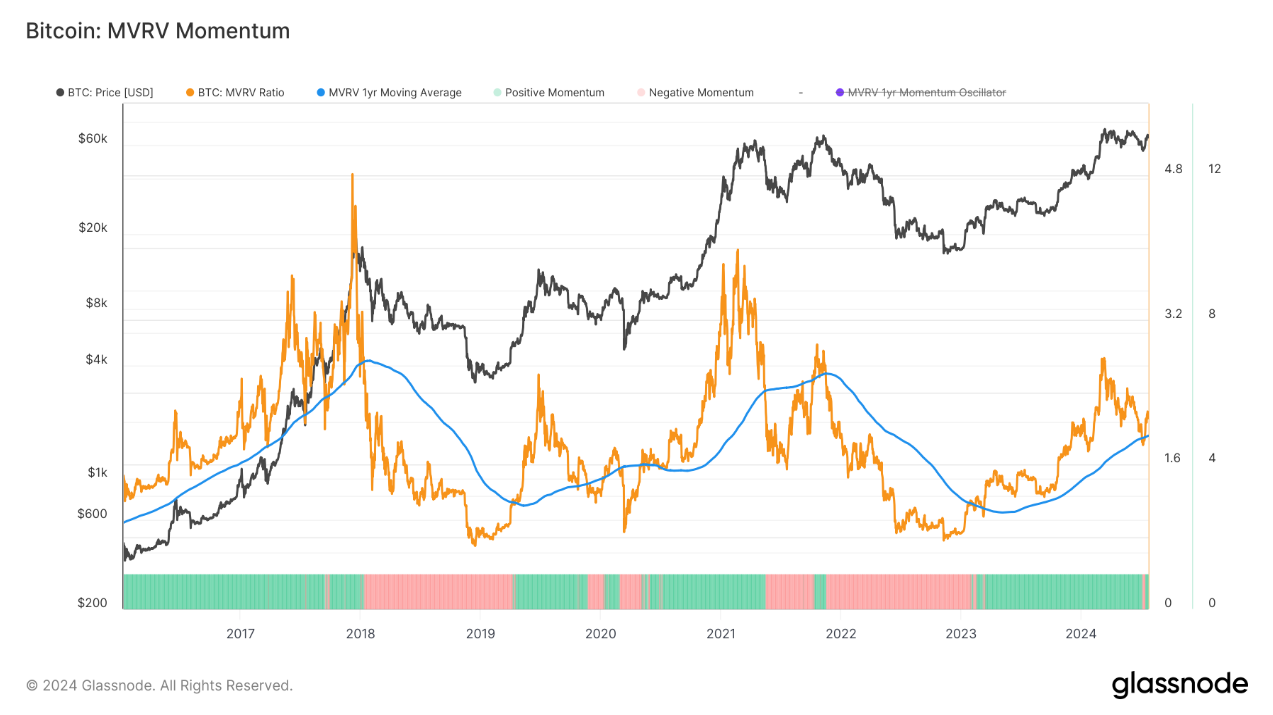
在七月初,MVRV 比率在其 365 天移动平均线附近找到支撑,表明 2024 年的上升趋势仍然保持完整,并带来积极的投资者盈利能力。

2、BTC 周期表现和回撤

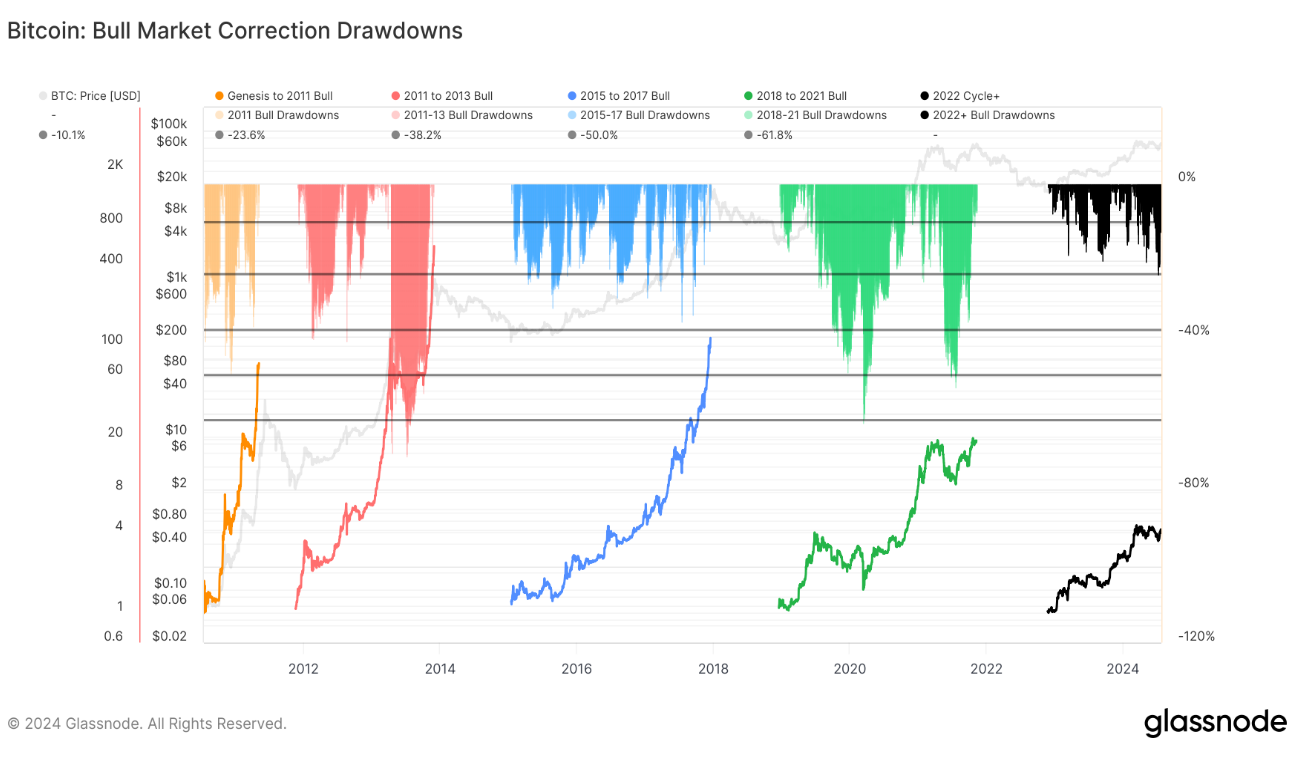
自 2022 年末开始的当前牛市中,比特币价格上涨了 400%。在 FTX 崩盘之后,比特币经历了持续 18 个月的稳定价格上涨,达到了 73000 美元的历史最高价。随后,市场进入了一个持续三个月的区间震荡阶段,随后出现了 -26% 的回撤。

这次下跌趋势较之前的周期更为平缓,表明市场结构强劲,波动性降低。2023-24 周期与 2018-21 和 2015-17 周期相似,为周期结构和持续时间提供了宝贵的见解。

1)比特币现货 ETF 余额

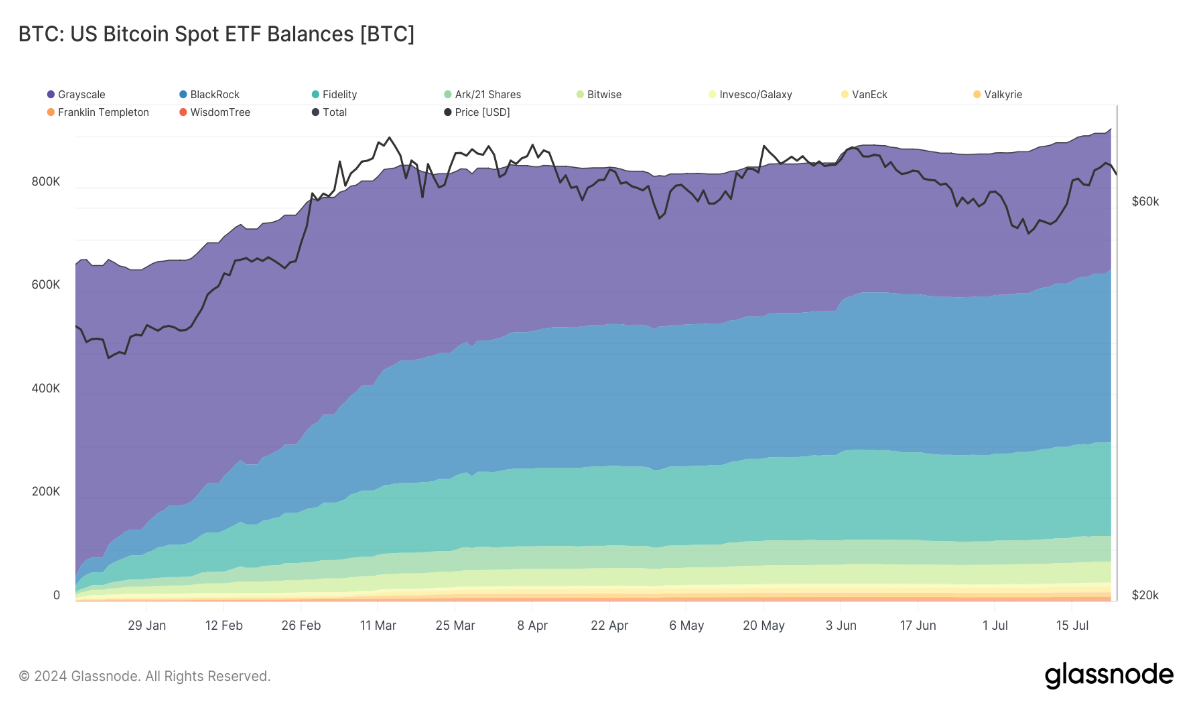
跟踪美国前十大交易的比特币 ETF 的余额可以了解资金流入这些产品的情况。现货比特币 ETF 取得了空前的成功,资产管理规模超过 500 亿美元,使其成为历史上最成功的 ETF 发行。

自它们推出以来,ETF 的资金流入也显著超过了比特币的新发行量,创造了巨大的需求。这种增加的需求推动了现货和衍生品市场的交易量上升。

2)比特币期货交易量和持仓量

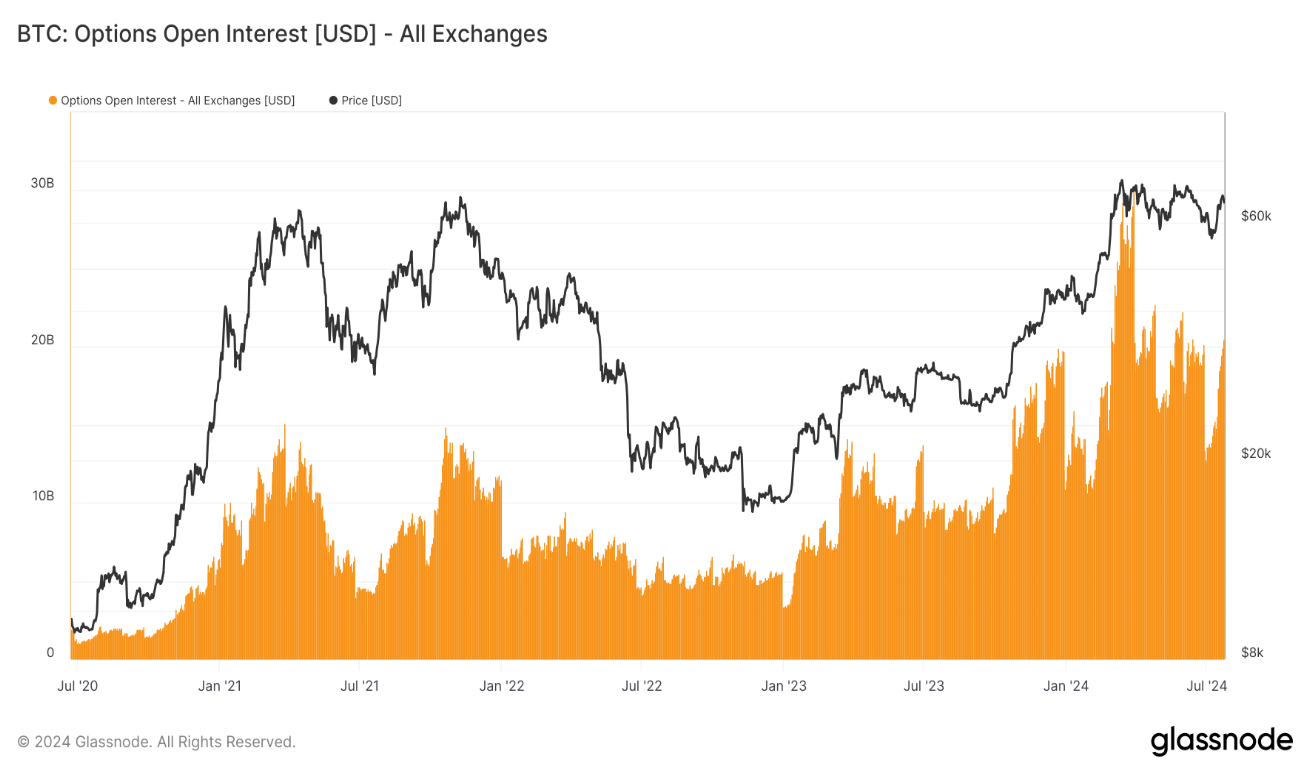
比特币期货的交易量和持仓量大幅上升。传统期货和永续期货都显示出参与度和流动性的增加,反映了对比特币衍生品日益增长的兴趣。

要深入探讨这些和其他主题,增强您的数字资产投资策略,请查看 2024 年第三季度《加密市场指南》的完整版本。

此下载完整报告。

Letture associate

Rented Faith: How Much of the Bitcoin ETF Inflows Is Real Money?

"Rented Conviction: How Much of Bitcoin ETF Flows Is Real Money" The weekly inflows into Bitcoin ETFs are often interpreted as a gauge of institutional belief. However, a significant portion of this activity is driven by a hidden arbitrage trade, not directional conviction. The core mechanism is a cash-and-carry arbitrage: traders buy spot Bitcoin (often via ETFs) while simultaneously shorting CME futures to lock in the price difference, or "basis." This delta-neutral trade is essentially an interest rate play. In weekly data, about half the fluctuation in ETF flows can be explained by new short positions added by leveraged funds (hedge funds), with a correlation of 0.70. Bitcoin's price movement in a given week shows no statistical power in predicting these flows. While this arbitrage trade drives weekly *volatility*, it is not the main component of the cumulative *stock*. Of the total ~$55 billion in net ETF inflows, the current net arbitrage position is only about $1 billion. The remainder is steady, directional buying averaging ~$400 million per week, which constitutes the vast majority of the accumulated "mountain" over two years. Thus, ETF flow data overstates the *volatility* of conviction, not its *level*. This arbitrage trade has been unwinding for nearly two years. Leveraged fund short positions peaked at ~$14 billion in late 2024 and have since declined to ~$4.5 billion. When the basis compresses to unprofitable levels, ETF inflows and short positions retreat together. Recent outflows should not be mistaken for a loss of faith but rather the routine unwinding of this rate trade. For Ethereum ETFs, the pattern is weaker. Accounting for staking yield makes the basis often negative, so neither strong conviction buying nor robust arbitrage supports its flows. To interpret ETF flows correctly, monitor the CME basis versus T-bill rates and leveraged fund net shorts. They reveal how much of the next "demand" headline is real. The real, patient buy-and-hold demand is what constitutes the enduring bulk of ETF assets.

marsbit35 min fa

Rented Faith: How Much of the Bitcoin ETF Inflows Is Real Money?

marsbit35 min fa

Soaring Over Tenfold Within the Year: The Frenzy Over SK Hynix Leveraged Products

South China Morning Post The leveraged ETF tracking SK Hynix has surged over tenfold year-to-date, fueled by intense market speculation on the memory chip sector. By June 22, the value of the 'South Korea 2x Long SK Hynix ETF' listed in Hong Kong had skyrocketed by more than 1,061% since the start of the year, while its asset size exploded over twenty times from the end of last year. The rally is driven by AI-driven demand for high-bandwidth memory (HBM), with SK Hynix recently sampling its next-generation HBM4E product. However, industry professionals warn of significant risks. Leveraged ETFs magnify both gains and losses. During a recent market correction, while the underlying SK Hynix stock fell 19.1%, its double-leveraged ETF dropped nearly 38%. Korean regulators noted that such products could theoretically lose 60% in a single day. Additionally, these ETFs face risks like time decay in volatile markets, liquidity spirals during mass redemptions, and extreme price dislocations from market-making failures, as seen in early June when an ETF moved opposite to its underlying stock. The trading is predominantly driven by retail investors, with institutional capital largely absent due to the products' high volatility. Analysts caution that with the semiconductor sector at elevated valuations and facing geopolitical and supply chain uncertainties, leveraged ETFs pose a substantial threat of amplified losses for uninformed investors.

marsbit1 h fa

Soaring Over Tenfold Within the Year: The Frenzy Over SK Hynix Leveraged Products

marsbit1 h fa

18 Months, Over 50x Surge: KIOXIA's Epic Comeback

KIOXIA, a NAND flash memory giant, staged a dramatic comeback driven by AI demand. After a period of significant losses, a failed merger, and missed HBM opportunities, its 2024 IPO began modestly. However, fueled by explosive demand for AI data storage, its stock price skyrocketed over 50 times within 18 months, making it Japan's most valuable company, surpassing Toyota. Its Q1 FY2026 profit guidance soared 30-fold year-over-year, with 2026 NAND capacity already sold out. Key to its success is its 3D NAND technology, BiCS FLASH. As the inventor of NAND, KIOXIA advanced its technology through generations, reaching over 200 layers by 2023. Key innovations include CBA (CMOS directly Bonded to Array), which separately manufactures control circuits and memory arrays for better performance, and OPS (On Pitch Select Gate) to increase density. The company is now developing high-capacity packages like an 8TB solution stacking 32 dies. Looking beyond NAND, KIOXIA is exploring 3D DRAM with its OCTRAM technology, using oxide semiconductor transistors for ultra-low leakage to reduce power consumption. This fundamental research differs from HBM and represents a long-term bet to extend its 3D expertise from NAND into future DRAM architectures. KIOXIA's story highlights how technological assets and shifting market cycles can rapidly transform a company's fortunes. While questions remain about sustaining growth beyond the current AI boom, its resurgence demonstrates that in semiconductors, being down does not necessarily mean being out.

marsbit1 h fa

18 Months, Over 50x Surge: KIOXIA's Epic Comeback

marsbit1 h fa

Market Trends in U.S. Stocks (June 23): Peak at Listing? SpaceX Loses Over $800 Billion in Three Days, Tech Stocks Experience Severe Internal Divergence

Stock Market Trends (June 23): Did SpaceX Peak at IPO? The company loses over $800 billion in market value in three days as a sharp divergence unfolds within the tech sector. SpaceX's post-IPO decline of over 20%, falling below its first-day close, reflects a swift market repricing. The catalyst is a clear shift in narrative from "AI platform potential" to concerns over rising capital costs, as its $8.57 billion IPO and subsequent $20 billion debt offering are earmarked for acquisitions and refinancing existing bridge loans rather than de-leveraging. While high-valuation tech stocks like Google, Meta, Amazon, and Microsoft faced pressure, Micron surged nearly 7% to a record high following a strategic supply deal with Anthropic for HBM and memory, highlighting robust, tangible demand in AI infrastructure. The broader market saw funds rotate into more defensive industrial and financial names. Macro factors included a dip in oil prices to a three-month low on news of a US-Iran framework deal, though logistical hurdles for resuming full Strait of Hormuz shipments remain. Key events ahead include Nvidia's shareholder meeting, Micron's earnings, and the May PCE inflation data. The latter will be crucial in determining whether the sell-off in high-valuation growth stocks, which appears to have just begun, will persist.

marsbit1 h fa

Market Trends in U.S. Stocks (June 23): Peak at Listing? SpaceX Loses Over $800 Billion in Three Days, Tech Stocks Experience Severe Internal Divergence

marsbit1 h fa

Trading

Spot
Futures
活动图片