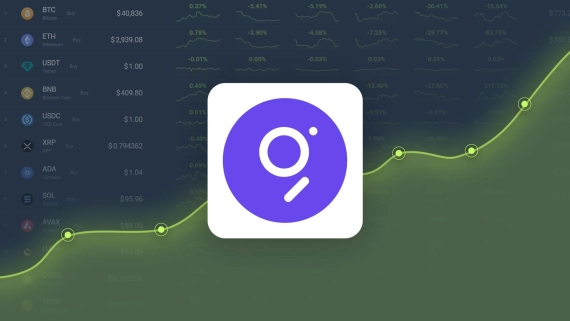
The Graph is Trading -24.02% Below Our Price Prediction for Apr 26, 2024 | CoinCodex

cryptodailyPubblicato 2024-04-16Pubblicato ultima volta 2024-04-21

Table of Contents

Disclaimer: This is not investment advice. The information provided is for general purposes only. No information, materials, services and other content provided on this page constitute a solicitation, recommendation, endorsement, or any financial, investment, or other advice. Seek independent professional consultation in the form of legal, financial, and fiscal advice before making any investment decision.

  • The Graph is up 6.80% today against the US Dollar
  • GRT/BTC increased by 4.74% today
  • GRT/ETH increased by 2.70% today
  • The Graph is currently trading 24.02% below our prediction on Apr 26, 2024
  • The Graph dropped -25.51% in the last month and is up 109.67% since 1 year ago
The Graph price$ 0.287445
The Graph prediction $ 0.378317 (29.94%)
Sentiment Bullish
Fear & Greed index 72 (Greed)
Key support levels$ 0.263564, $ 0.235580, $ 0.217772
Key resistance levels$ 0.309355, $ 0.327164, $ 0.355147

GRT price is expected to rise by 29.94% in the next 5 days according to our The Graph price prediction

The Graph price today is trading at $ 0.287445 after gaining 6.80% in the last 24 hours. The coin outperformed the cryptocurrency market, as the total crypto market cap increased by 4.47% in the same time period. GRT performed well against BTC today and recorded a 4.74% gain against the world’s largest cryptocurrency.

According to our The Graph price prediction, GRT is expected to reach a price of $ 0.378317 by Apr 26, 2024. This would represent a 29.94% price increase for GRT in the next 5 days.

GRT Price Prediction Chart

Buy/Sell The Graph

What has been going on with The Graph in the last 30 days

The Graph has been displaying a negative trend recently, as the coin lost -25.51% in the last 30-days. The medium-term trend for The Graph has been bullish, with GRT increasing by 81.70% in the last 3 months. The long-term picture for The Graph has been positive, as GRT is currently displaying a 109.67% 1-year price change. On this day last year, GRT was trading at $ 0.137096.

The Graph reached its all-time high price on Feb 12, 2021, when the price of GRT peaked at $ 2.87. The current GRT cycle high is $ 0.491682, while the cycle low is at $ 0.051894. GRT has been displaying high volatility recently – the 1-month volatility of the coin is at 16.27. The Graph recorded 15 green days in the last 30 days.

The Graph technical analysis for today - Apr 21, 2024

The sentiment in the The Graph markets is currently Bullish, and the Fear & Greed index is reading Greed. The most important support levels to watch are $ 0.263564, $ 0.235580 and $ 0.217772, while $ 0.309355, $ 0.327164 and $ 0.355147 are the key resistance levels.

Bullish sentiment for The Graph

22 indicators are currently signaling a bullish prediction for The Graph, while 5 indicators are showing a bearish forecast. With 81% of indicators favoring a positive prediction. This results in an overall Bullish sentiment for The Graph.

Crypto market is currently experiencing Greed

Currently, the Fear & Greed index is at 72 (Greed), which signals that investors have a positive outlook on the market. The Fear & Greed index is a measure of sentiment among cryptocurrency investors. A “Greed” reading suggests that investors are currently optimistic about the cryptocurrency market, but can also be an indication that the market is overvalued. A “Fear” reading, on the other hand, signals that investors are currently hesitant about the cryptocurrency market, which potentially represents a buying opportunity.

The Graph moving averages & oscillators

Let’s take a look at what some of the most important technical indicators are signaling. We’ll be going through key moving averages and oscillators that will allow us to get a better idea of how The Graph is positioned in the market right now.

PeriodDaily SimpleDaily ExponentialWeekly SimpleWeekly Exponential
MA3$ 0.257991 (BUY)$ 0.254065 (BUY)--
MA5$ 0.251126 (BUY)$ 0.261145 (BUY)--
MA10$ 0.282191 (BUY)$ 0.281527 (BUY)--
MA21$ 0.321572 (SELL)$ 0.311505 (SELL)-$ 1.04 (BUY)$ 0.252584 (BUY)
MA50$ 0.352277 (SELL)$ 0.319434 (SELL)-$ 0.84 (BUY)$ 0.192094 (BUY)
MA100$ 0.269561 (BUY)$ 0.284239 (BUY)-$ 0.51 (BUY)$ 0.129416 (BUY)
MA200$ 0.202140 (BUY)$ 0.231356 (BUY)--

PeriodValueAction
RSI (14)38.39NEUTRAL
Stoch RSI (14)64.95NEUTRAL
Stochastic Fast (14)36.22NEUTRAL
Commodity Channel Index (20)-66.67NEUTRAL
Average Directional Index (14)36.74BUY
Awesome Oscillator (5, 34)-0.09NEUTRAL
Momentum (10)-0.08NEUTRAL
MACD (12, 26)-0.01NEUTRAL
Williams Percent Range (14)-63.78NEUTRAL
Ultimate Oscillator (7, 14, 28)54.70NEUTRAL
VWMA (10)0.26SELL
Hull Moving Average (9)0.24BUY
Ichimoku Cloud B/L (9, 26, 52, 26)0.31NEUTRAL

The Relative Strength Index (RSI 14) is a widely used indicator that helps inform investors whether an asset is currently overbought or oversold. The RSI 14 for The Graph is at 38.39, suggesting that GRT is currently neutral.

The 50-day Simple Moving Average (SMA 50) takes into account the closing price of The Graph over the last 50 days. Currently, The Graph is trading above the SMA 50 trendline, which is a bullish signal.

Meanwhile, the 200-day Simple Moving Average (SMA 200) is a long-term trendline that’s calculated by taking an average of the GRT closing price for the last 200 days. GRT is now trading below the SMA 200, signaling that the market is currently bearish.

The bottom line about this The Graph prediction

After considering the above factors, we can conclude that the current forecast for The Graph price prediction is Bullish. GRT would have to increase by 29.94% to hit our $ 0.378317 target within the next five days. Moving forward, it will be important to monitor the GRT market sentiment, the key support and resistance levels, and other metrics. However, we have to keep in mind that the cryptocurrency markets are unpredictable, and even the largest crypto assets display a lot of price volatility. For long-term The Graph price predictions click here.

Disclaimer: This is not investment advice. The information provided is for general purposes only. No information, materials, services and other content provided on this page constitute a solicitation, recommendation, endorsement, or any financial, investment, or other advice. Seek independent professional consultation in the form of legal, financial, and fiscal advice before making any investment decision.

Disclaimer: This article is provided for informational purposes only. It is not offered or intended to be used as legal, tax, investment, financial, or other advice.

Read on CoinCodex Investment Disclaimer
Crypto di tendenza

Letture associate

Beyond Private Keys: From Wallets and L2 to Supply Chains, How to Guard the Security Perimeter of Web3?

Beyond Private Keys: Securing Web3's Expanding Attack Surface from Wallets to L2s and Supply Chains The crypto space faced a wave of security incidents in June, with over $75 million lost across 40 major attacks. These breaches highlighted risks beyond private key theft, exposing vulnerabilities across the entire user interaction chain. Wallet security was compromised not through stolen seed phrases, but via a critical flaw in the Cardano wallet SecondFi's signing implementation. This bug allowed attackers to potentially derive private keys from publicly visible signature data, emphasizing that wallet security depends on correct cryptographic implementation, ideally in open-source, auditable code. Layer-2 networks also revealed complex trust chain risks. Attacks on legacy Aztec deployments exploited inconsistencies in proof systems, showing that a valid zero-knowledge proof is only as secure as its underlying rules. Another attack on Taiko's SGX-based prover stemmed from a leaked signing key and inadequate verification checks. Furthermore, a technical glitch halted Base's block production, underscoring that L2 security encompasses network availability and reliable user exit paths as much as asset safety. Finally, the Polymarket incident demonstrated that even audited smart contracts are not immune. A compromised third-party supplier led to a malicious script being injected into the platform's frontend, resulting in user fund losses. This "supply chain attack" shows that the security of the entire interaction path—from the webpage to the wallet signature—is critical. The conclusion is clear: Web3 security now involves safeguarding the entire journey from transaction intent to on-chain settlement. Users must adopt layered security habits: isolating long-term holdings, using dedicated wallets for daily interactions, scrutinizing transaction details before signing, and managing authorizations cautiously. Defense must evolve from protecting a single point (the private key) to securing a complete chain of interactions.

marsbit36 min fa

Beyond Private Keys: From Wallets and L2 to Supply Chains, How to Guard the Security Perimeter of Web3?

marsbit36 min fa

Robinhood Chain Goes Viral in One Week: Memes Drive Traffic, Stablecoins Support TVL

Robinhood Chain, an Arbitrum-based Layer 2 network launched on July 1st, experienced explosive growth in its first week. While meme coin hype drove user activity, stablecoin deposits fueled its surge in Total Value Locked (TVL). The chain's rapid adoption was driven by multiple factors. CEO Vlad Tenev reversed his initial stance, endorsing the chain for meme coins despite its original focus on Real-World Assets (RWA). The integration of the popular Solana-based launchpad Pump.fun significantly lowered the barrier for meme trading. Furthermore, the prediction market application World announced a migration from Solana to Robinhood Chain. Meme coin mania, led by tokens like CASHCAT, generated massive trading volume, with daily active addresses skyrocketing from near zero to hundreds of thousands. However, the primary driver of the chain's TVL, which soared past $234 million, was a major institutional deposit. Ethena injected approximately $50 million in stablecoins into the Morpho lending protocol, which underpins Robinhood's Earn product, accounting for the bulk of locked value. This highlights two concurrent narratives: retail-driven meme speculation boosting transactions, and institutional stablecoin deposits building foundational liquidity. In contrast, the chain's flagship RWA offerings, like tokenized stocks, remain a minor part of the ecosystem at around $12.8 million. The first week demonstrates a path where speculative trading and yield-seeking capital provide initial momentum, while the core RWA vision is still in early development.

Foresight News1 h fa

Robinhood Chain Goes Viral in One Week: Memes Drive Traffic, Stablecoins Support TVL

Foresight News1 h fa

The Illusion of a Prodigy

The Illusion of the "Genius Youth" The article discusses the recent interview incident involving Li Bojie, a former "Huawei Genius Youth," and AI company DeepSeek. It highlights the core conflict not as a simple case of suspected cheating during a coding test, but as a profound mismatch in expectations. Li, with an impressive background including entrepreneurship, a role at Huawei, and a position as a chief scientist, was deeply affected by a standard remote interview where the interviewer questioned his actions. The key point is his stated view of DeepSeek as the "pinnacle of the Chinese tech world." For him, the interview was a quest for identity validation—proof he belonged at the center of the new AI era. For DeepSeek, it was a routine skills assessment. The article argues that Li, while publicly rejecting the "genius" label, subconsciously expected to be treated as a peer for discussion, a courtesy extended by other companies like MiniMax and Xiaomi. DeepSeek, however, adhered strictly to its standardized process, prioritizing consistent, merit-based evaluation over individual prestige. This clash symbolizes a larger shift in the tech industry. The core thesis is that the AI era is dismantling the old system where past titles, companies, and accumulated experience guaranteed status. Now, with rapid knowledge obsolescence, "excellence is calculated in real-time." Li's anxiety—waiting weeks for the DeepSeek interview despite other offers—stems from the fear that rejection means being left behind by technological progress. The article concludes that this incident is a harbinger; soon, everyone will face a constant, implicit "interview" with the AI age itself, asking: "You were excellent yesterday. What about today?"

marsbit1 h fa

The Illusion of a Prodigy

marsbit1 h fa

Vanguard Group Enters the Arena, Opening a New Crypto Portal for 50 Million Traditional Investors

Vanguard Group, the world's second-largest asset manager with $12 trillion in assets under management and over 50 million investors, has signaled a significant strategic shift by posting a job opening for a "Head of Digital Assets, Personal Wealth." The role entails developing a comprehensive digital asset strategy, establishing long-term plans, and overseeing the full integration of digital assets into Vanguard's wealth management platform, covering areas like custody, settlement, asset tokenization, and stablecoins. This move marks a notable reversal from the firm's previous stance. In 2024, Vanguard refused to list spot Bitcoin ETFs and removed Bitcoin futures products. By late 2025, it allowed some third-party crypto ETF trading but reiterated it would not create its own crypto funds. The new hire represents a third step: building an internal team to integrate digital assets into its core infrastructure, moving beyond merely listing products. The initiative focuses on foundational financial infrastructure—how tokenized assets and digital settlement systems can connect to Vanguard's existing platform, which primarily serves long-term, conservative investors. While Vanguard maintains it will not launch proprietary crypto ETFs, it is proactively preparing its systems for a future involving tokenized assets and stablecoins, which Citigroup projects could reach a $5.5 trillion market by 2030. Vanguard's scale means its chosen standards for custody, settlement, and compliance could set de facto rules for the broader wealth management industry. The firm is acting despite regulatory uncertainty and cautious market sentiment (e.g., Citi recently lowered crypto price targets). Analysts suggest even a minimal 0.01% allocation from Vanguard's asset base would bring ~$12 billion into digital assets, forcing the development of robust risk and operational frameworks. Ultimately, Vanguard's focus is on building the plumbing for digital assets to potentially serve its vast client base, an effort whose impact may extend far beyond any single market cycle.

Foresight News1 h fa

Vanguard Group Enters the Arena, Opening a New Crypto Portal for 50 Million Traditional Investors

Foresight News1 h fa

Trading

Spot

Articoli Popolari

Come comprare GRT

Benvenuto in HTX.com! Abbiamo reso l'acquisto di The Graph (GRT) semplice e conveniente. Segui la nostra guida passo passo per intraprendere il tuo viaggio nel mondo delle criptovalute.Step 1: Crea il tuo Account HTXUsa la tua email o numero di telefono per registrarti il tuo account gratuito su HTX. Vivi un'esperienza facile e sblocca tutte le funzionalità,Crea il mio accountStep 2: Vai in Acquista crypto e seleziona il tuo metodo di pagamentoCarta di credito/debito: utilizza la tua Visa o Mastercard per acquistare immediatamente The GraphGRT.Bilancio: Usa i fondi dal bilancio del tuo account HTX per fare trading senza problemi.Terze parti: abbiamo aggiunto metodi di pagamento molto utilizzati come Google Pay e Apple Pay per maggiore comodità.P2P: Fai trading direttamente con altri utenti HTX.Over-the-Counter (OTC): Offriamo servizi su misura e tassi di cambio competitivi per i trader.Step 3: Conserva The Graph (GRT)Dopo aver acquistato The Graph (GRT), conserva nel tuo account HTX. In alternativa, puoi inviare tramite trasferimento blockchain o scambiare per altre criptovalute.Step 4: Scambia The Graph (GRT)Scambia facilmente The Graph (GRT) nel mercato spot di HTX. Accedi al tuo account, seleziona la tua coppia di trading, esegui le tue operazioni e monitora in tempo reale. Offriamo un'esperienza user-friendly sia per chi ha appena iniziato che per i trader più esperti.

173 Totale visualizzazioniPubblicato il 2024.12.10Aggiornato il 2026.06.02

Come comprare GRT

Discussioni

Benvenuto nella Community HTX. Qui puoi rimanere informato sugli ultimi sviluppi della piattaforma e accedere ad approfondimenti esperti sul mercato. Le opinioni degli utenti sul prezzo di GRT GRT sono presentate come di seguito.

活动图片