Original Author: sealaunch intelligence
Original Compilation: Chopper, Foresight News
Most reports on Polymarket only scratch the surface with data: trading volume milestones, user growth, number of transactions, open interest, but never delve into who is actually trading behind these numbers. This article categorizes all active wallets based on transaction frequency and trading volume, outlining the true user profile structure of Polymarket.
The vast majority of Polymarket's trading volume is contributed by a small group of algorithmic and high-frequency traders; the massive number of low-frequency retail users have almost no intersection with these professional traders. Recognizing the differences between these two groups directly impacts platform fee design, product priority planning, and market category strategy.
Note: All data in this article is sourced from the Dune analytics dashboard, covering a three-month period of wallet-level behavior; user profiles are defined by cross-referencing transaction frequency tiers (T1–T7) and transaction amount tiers (V1–V7), with amounts denominated in USD.
User Transaction Frequency and Volume Distribution
Transaction frequency shows a typical log-normal distribution decay pattern. The largest user group made between 2 and 10 transactions during the study period, accounting for 32% of all users. Combined with users who made 11 to 50 transactions, they make up almost two-thirds of the total user base. These users typically participate during elections, sports events, or major macroeconomic events, placing small bets.
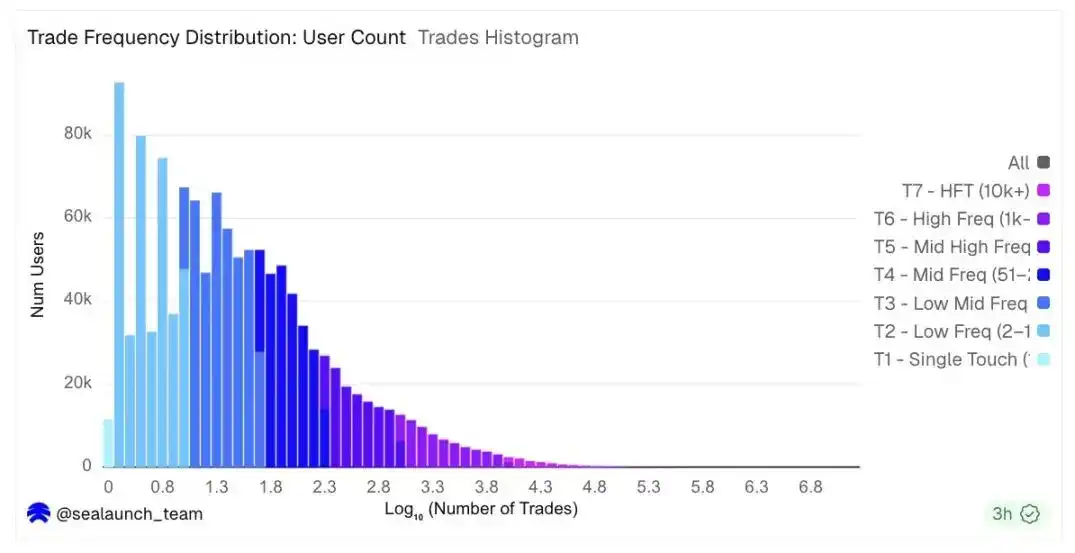
Transaction Frequency Distribution Chart
The trading volume distribution is entirely different. While transaction frequency drops sharply on the left, the volume histogram is bell-shaped on a logarithmic scale, peaking at around $600 to $3,000 per user. This means the typical active user trades in the four-figure range, but the right tail, starting from $25,000, consists of fewer users who dominate the platform's trading volume.
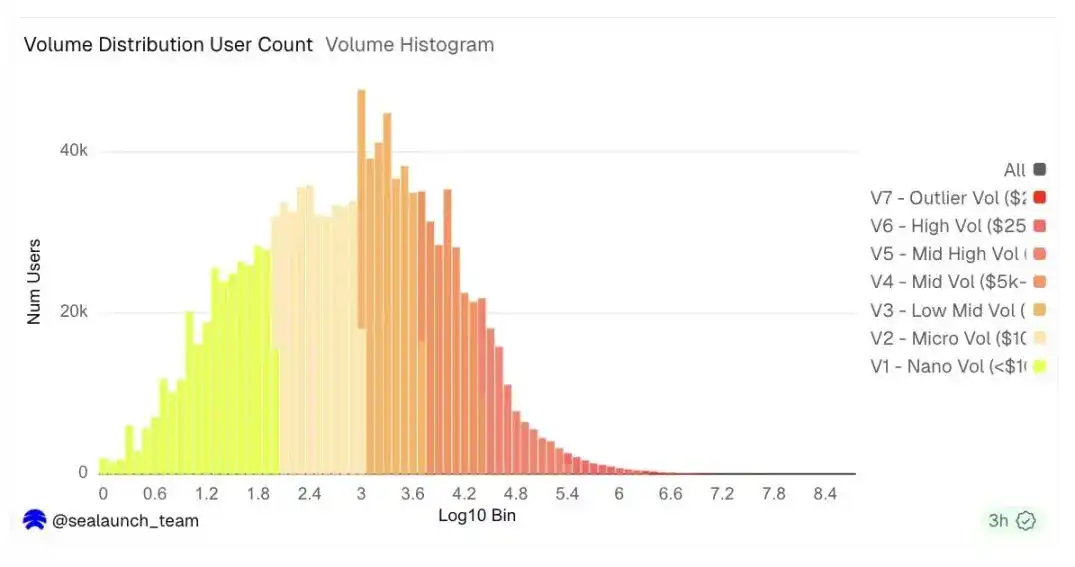
Trading Volume Distribution Chart
These two histograms together reveal a structural split: one part consists of low-frequency participants; the other part consists of high-volume participants, who are almost invisible on the user chart but dominate the trading volume chart.
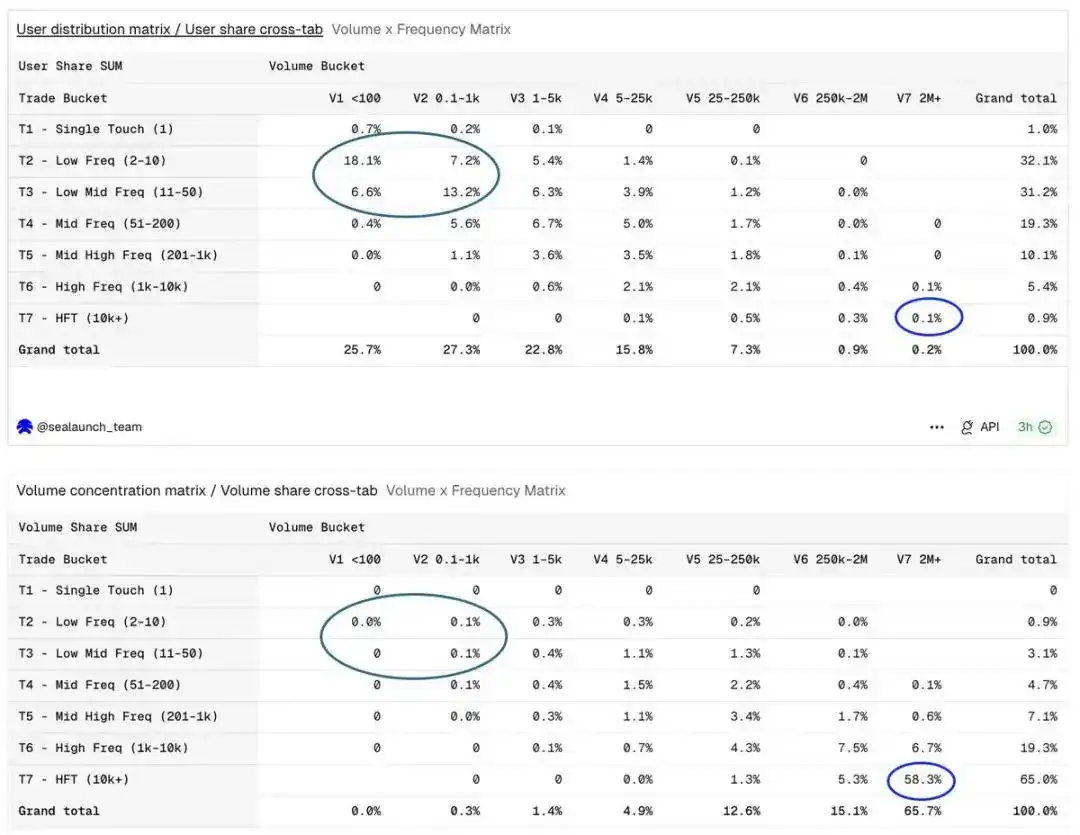
User Proportion & Volume Concentration Matrix: User dimension is concentrated in the low-frequency, small-amount range, while the volume dimension is completely reversed.
How the User Profile System is Built
Relying solely on frequency or volume to classify users ignores the logical connection between the two. Making 500 transactions totaling $50 is completely different from making 500 transactions totaling $5 million. We classify each wallet by combining these two dimensions.
We first assign each wallet to a transaction frequency tier: from T1 (single transaction) to T7 (over 10,000 transactions). Then, we assign it to a transaction volume tier: from V1 (total volume under $100) to V7 (over $2 million). The intersection of these two dimensions produces seven user profiles, each representing a distinct participant type.
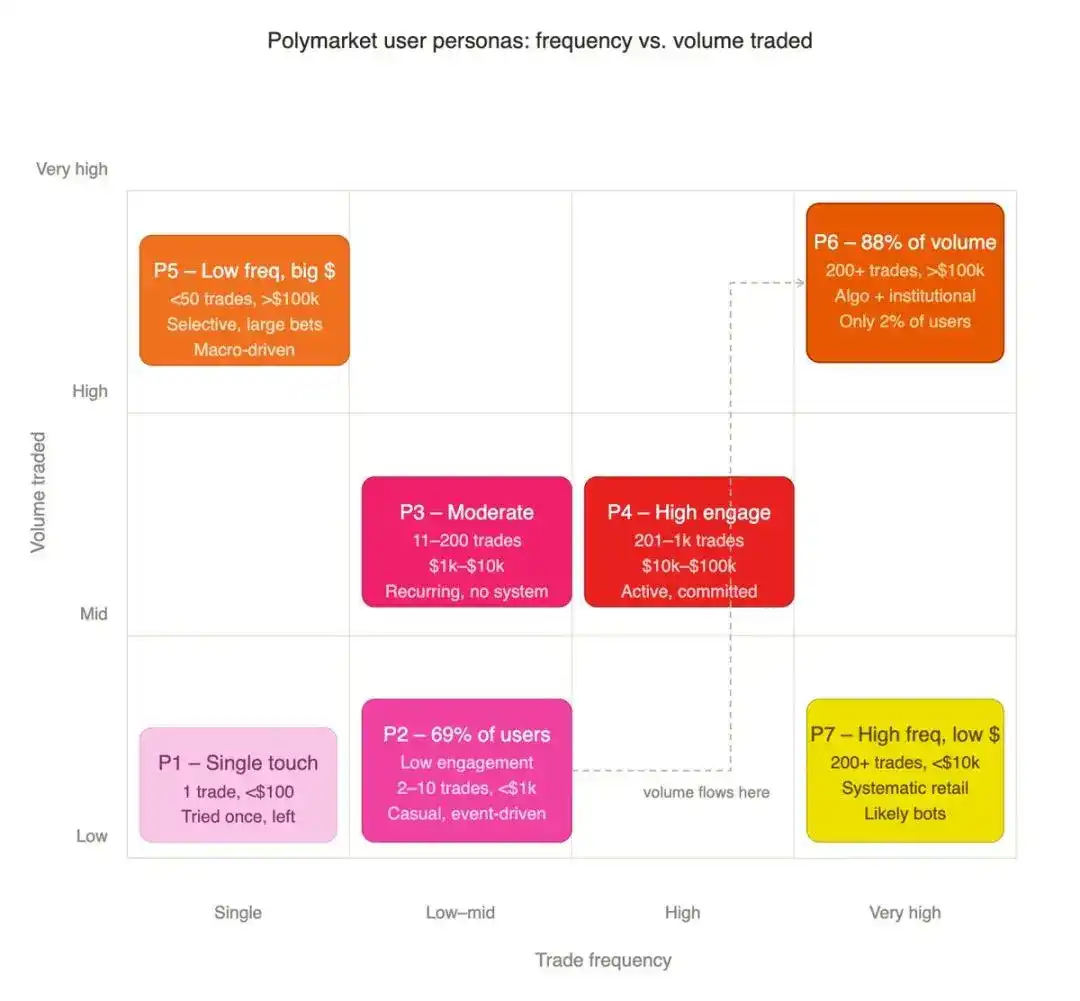
- P1 Single Inactive User: Only 1 transaction, total under $100, a one-time trial of the platform.
- P2 Low-Activity Retail User: 2–10 transactions, total volume under $1,000, casual participants driven purely by hot events.
- P3 Moderate Participant: 11–200 transactions, volume $1,000–$10,000, repeatedly enter the market but lack systematic trading logic.
- P4 High-Engagement Retail User: 201–1,000 transactions, volume $10k–$100k, actively and steadily participate but not at an institutional level.
- P5 Low-Frequency High-Net-Worth User: Fewer than 50 transactions, single large bets over $100k, selective opportunities, targeted heavy positions.
- P6 High-Frequency Professional Core: Over 200 transactions, volume exceeding $100k, algorithmic strategies and institutional trader groups.
- P7 High-Frequency Small-Volume Player: Over 200 transactions, total volume under $10k, high frequency but capital-limited participants.
2% of Users Account for Nearly 90% of Trading Volume
P2 low-activity retail users number 849,000, accounting for 69% of total users; P6 high-frequency, high-investment users number only 27,000, about 2%.
However, during the statistical period, the P6 group generated a total trading volume of $39 billion. This is the most extreme manifestation of the Pareto principle: not the conventional 80/20, but 2% of users supporting nearly 90% of the trading volume.
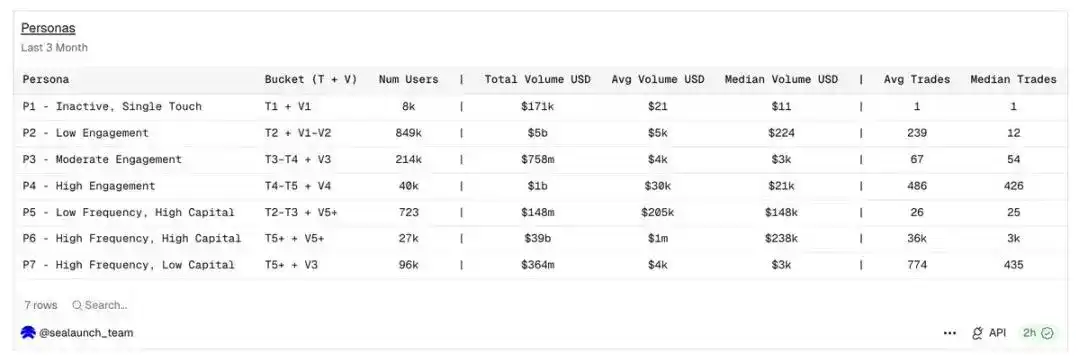
User Profile Summary Table: Seven user types derived from cross-referencing transaction frequency and volume tiers.
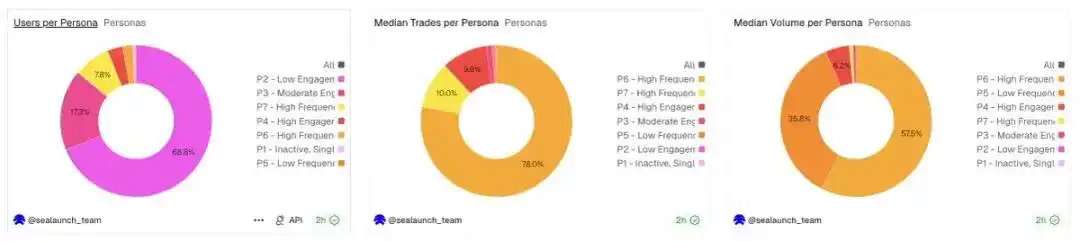
Number of users, median transaction count, and median transaction volume for each user group: The three datasets show distinctly different user distribution characteristics.
The user growth chart and the trading volume growth chart describe almost entirely different user groups. Product decisions for a platform targeting user growth versus one targeting trading volume growth are completely different.
Category Preferences of Different User Profiles
Sports and cryptocurrency are the two largest categories on Polymarket, accounting for 42% and 31% of total trading volume respectively, but with vastly different underlying user structures.
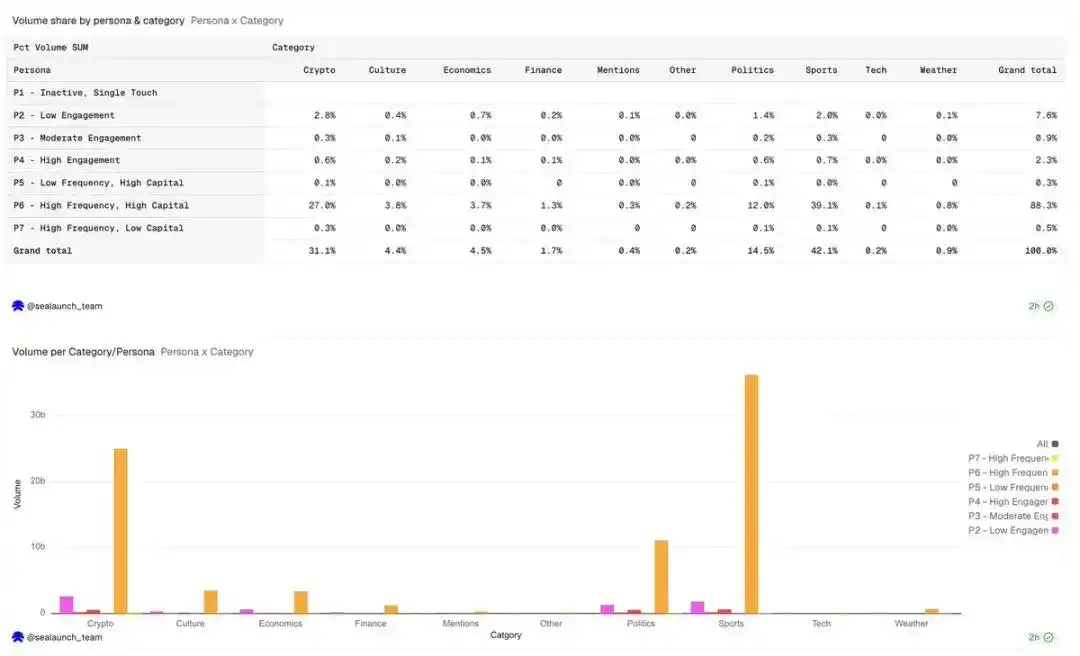
Percentage of trading volume by user profile and transaction category
The proportion of high-frequency, high-capital (P6) traders in the cryptocurrency market is significantly higher than the overall user base, a pattern consistent with algorithmic trading. These participants are not casual bettors but employ systematic strategies for cryptocurrency trading. The high trading volume and high frequency suggest automated execution rather than subjective judgment.
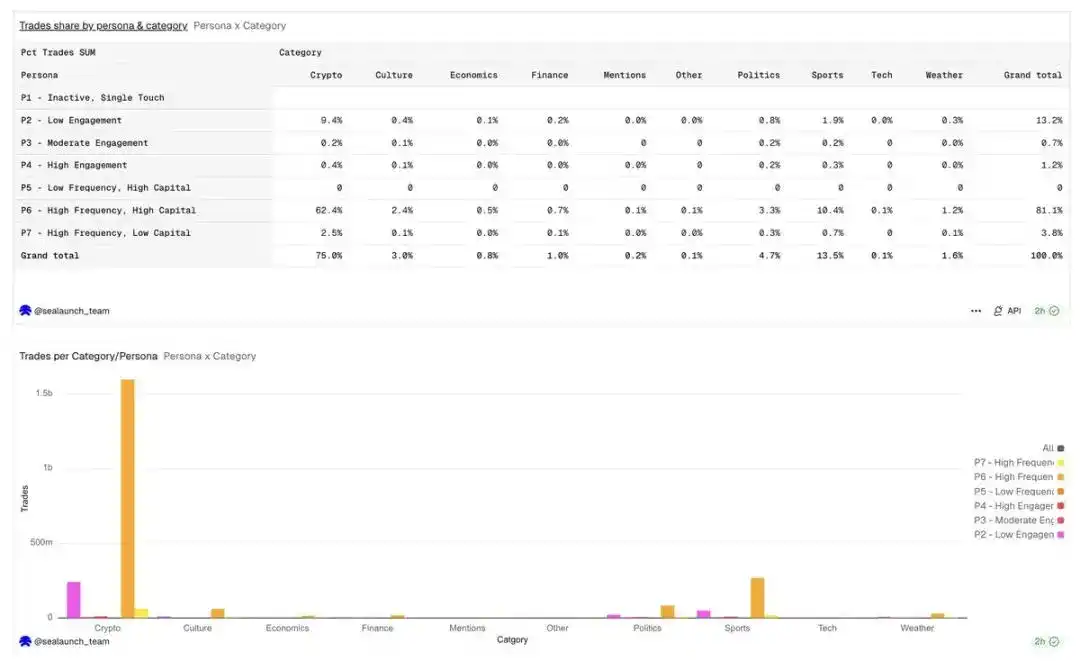
Percentage of transaction count by user profile and category
Although sports betting is also dominated by high-frequency, high-capital (P6) trading volume, the proportion of moderate (P3) and high (P4) engagement participants is higher than in the cryptocurrency category. Sports betting has both institutional algorithmic funds and a large number of experienced manual研判 players who place orders based on subjective judgment rather than machine high-frequency iteration.
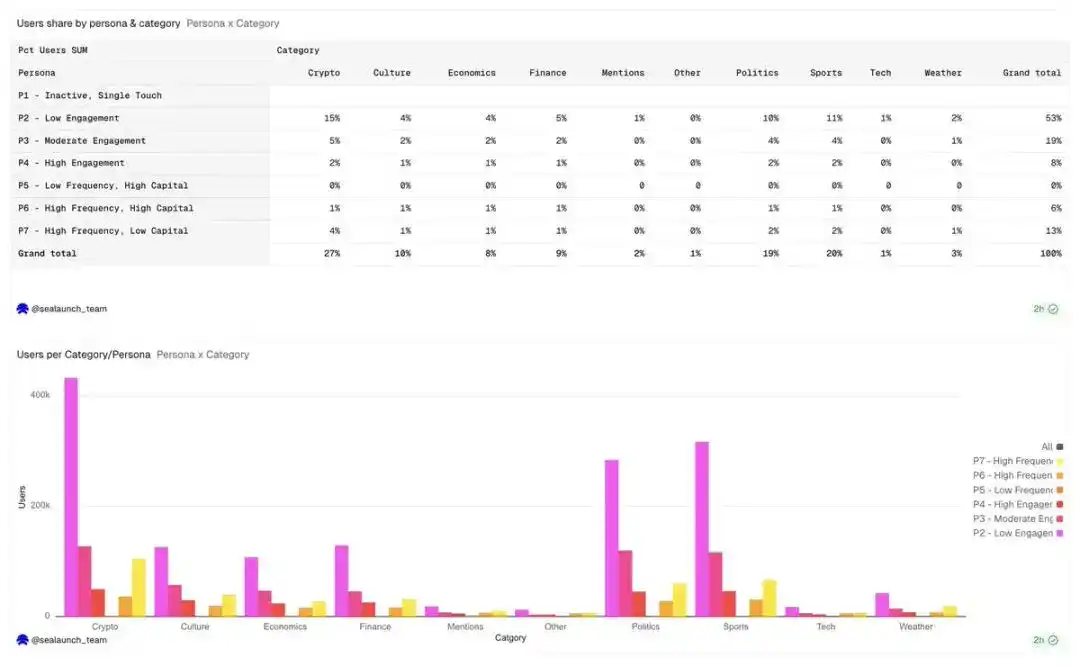
User percentage by user profile and category: User distribution is completely opposite to trading volume and transaction count.
Politics has the highest user percentage at 19%, but user numbers are relatively evenly distributed across user groups. Low-engagement users (P2) have the highest proportion among political users; compared to other categories, these users are typically event-driven, one-time retail users who register accounts to bet on elections.
The economy and finance categories attract a disproportionate number of low-frequency, high-capital (P5) participants, meaning they trade infrequently but with large single bets, deploying significant capital into macroeconomic outcomes with relatively few transactions.
The platform's categories directly determine the user groups attracted and influence liquidity depth, user retention, and fee tolerance.
A new cryptocurrency market will attract algorithmic and high-frequency traders; a new political market will attract event-driven participants who may never return after the event. More specialized market forms, like binary options or structured outcome markets, might further attract the high-frequency, high-capital (P6) user group, which already dominates the cryptocurrency market. If the goal is trading volume, build for the P6 user group. If the goal is user growth and brand influence, build for the P2 user group. These two goals require completely different category choices.
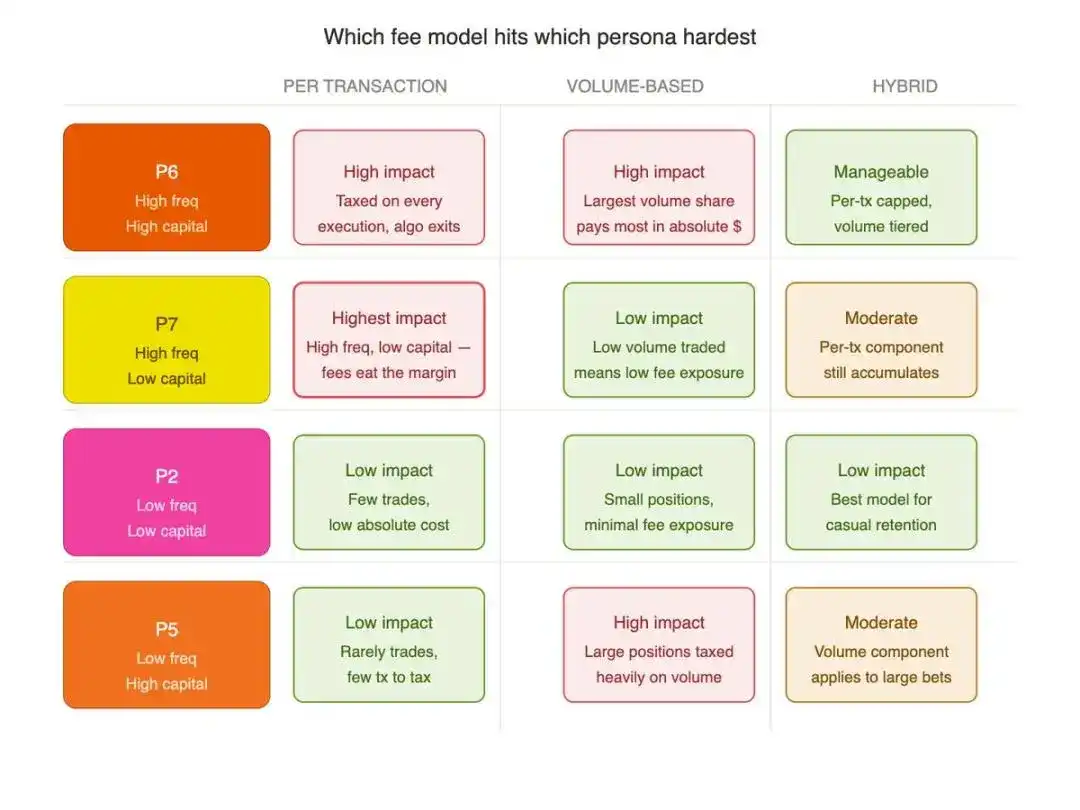
Implications for the Fee Model
User stratification directly determines the fee design for prediction markets.
A fixed per-transaction fee model would excessively suppress the P6 (high-frequency, high-capital) and P7 (high-frequency, small-volume) groups; yet these are precisely the people who support the liquidity foundation crucial for the platform's survival.
The value of category-differentiated fees lies here. Polymarket's current fee system implements this logic:
- Crypto category has the highest effective fee: 1.80%
- Sports category: 0.75%
- Politics & Finance category: 1.00%
- Geopolitics category: Zero fees throughout
These standards are not arbitrarily set but precisely match the user structure and trading habits of each category. The crypto track is filled with P6 algorithmic professional capital, which can tolerate high fees without disrupting liquidity; the political track is dominated by low-threshold retail users, requiring lower friction costs to maintain retention. Fee design detached from user profiles is essentially blind trial and error.
Key Conclusions
- The P6 high-frequency, high-capital group constitutes only 2% of users but creates 88% of the platform's trading volume;
- Fee policies that harm P6 interests will severely damage the platform's foundation;
- 69% of users are low-frequency, small-volume retail users, driven purely by hot events;
- Cryptocurrency trading is highly concentrated among algorithmic high-frequency capital, while the sports track has a more diverse participant structure;
- The average retail user makes only 12 transactions in 90 days, with a median total investment of $224;
- Expanding into new categories must target specific user profiles, not simply chase topic热度 (hotness).
Conclusion
If trading volume is concentrated in a small, high-frequency core, why does Polymarket position itself as a retail product? Professional algorithmic funds support the vast majority of the flow, but the product experience, marketing approach, and category layout always cater to ordinary retail users.
Part of the answer may lie in structural factors. The proliferation of agent frameworks, Telegram bots, and no-code tools allows retail users to easily start automated trading. If retail users are now beginning algorithmic trading, the next natural evolution is AI agents operating autonomously at a large scale and high frequency.
This is also why Polymarket might孕育 (give birth to) the first killer application at the intersection of cryptocurrency and artificial intelligence. In a market with strong liquidity, event-driven, binary outcomes, autonomous agents can operate precisely, absorbing world events, social sentiment, and real-time reasoning information, identifying mispriced trading outcomes, and executing trades without human intervention. When this application achieves a breakthrough, it will be more than just a cryptocurrency product. It will be the moment agent trading goes mainstream.


