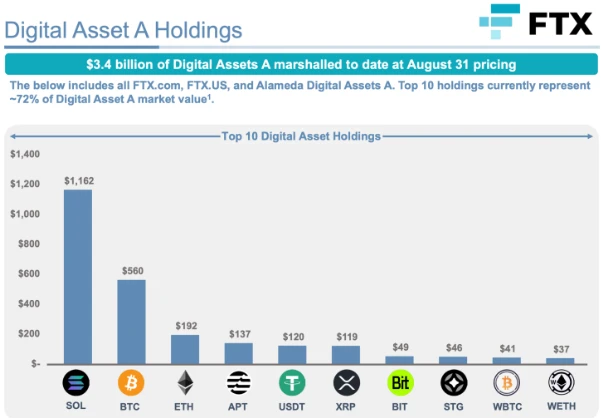
FTX 拉高出货?
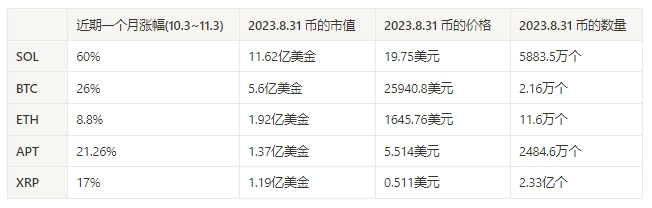
FTX 持有较多的币都一致有较大的涨幅,特别是 SOL,其次是 BTC, APT, XRP
媒体高度评价 SOL,<VanEck 長文看多 Solana 估值:預測 2030 年目標價 3, 211 美元>
SOL 在 2023.11.02 放量价格冲高回落,波动率放大,短期风险较高
基本面向好?
BTC 减半将近
BTC 的 ETF 预期
美联储 FOMC 会议没有继续加息
比特币减半距离今天(2023.11.3)还有约 168 天
减半倒计时:https://www.nicehash.com/countdown/btc-halving-2024-05-10-12-00?_360safeparam=1289146171
市场技术与情绪环境分析
技术指标

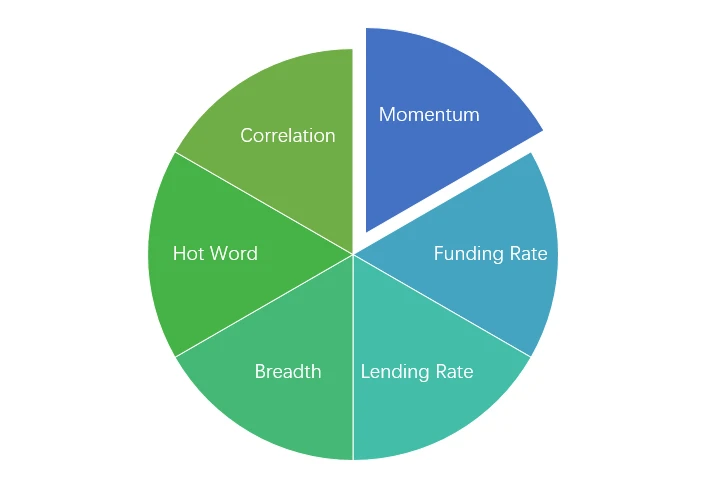
情绪分析组成

技术指标
价格走势
过去一周 BTC 价格上涨 2.31% ,ETH 价格上涨-0.14% 。

上图是 BTC 过去一周的价格图
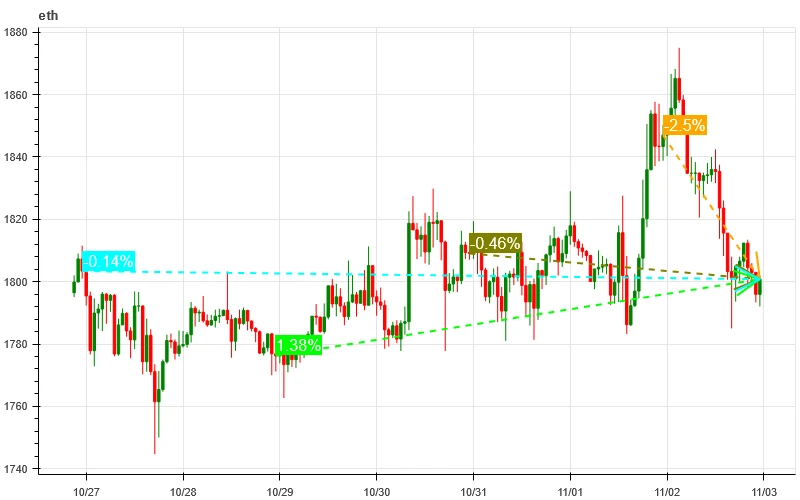
上图是 ETH 过去一周的价格图
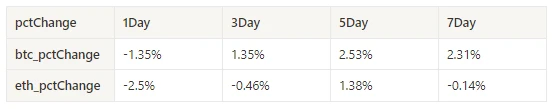
表格显示过去一个周的价格变化率
价量分布图(支撑阻力)
过去一周价格 BTC 与 ETH 在 FOMC 会议后向上突破随后又跌回密集成交区震荡
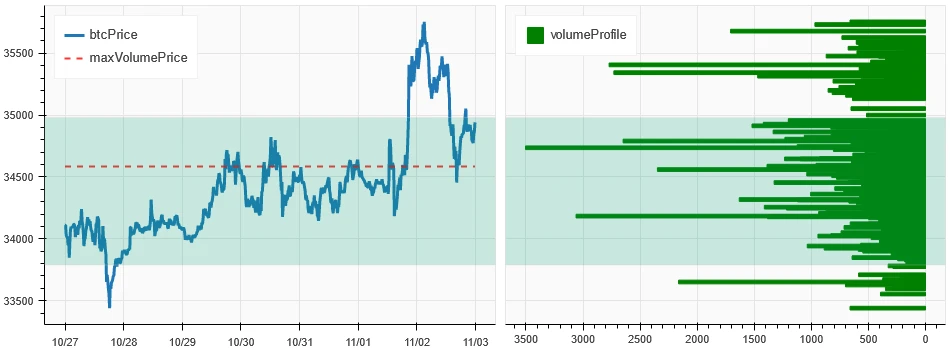
上图是 BTC 过去一周的密集成交区分布图
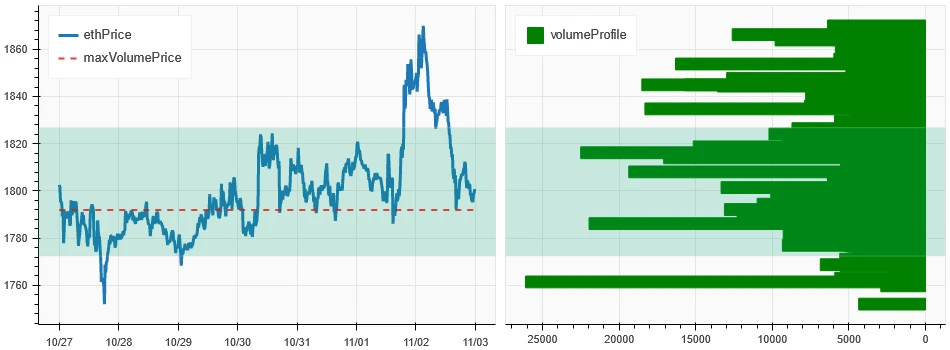
上图是 ETH 过去一周的密集成交区分布图
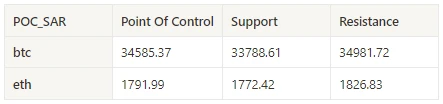
表格显示 BTC 与 ETH 过去一周中每周的密集成交区间
成交量与未平仓量
过去一周 BTC 与 ETH 都在 FOMC 会议前后交易量增加;BTC 未平仓量下降,ETH 未平仓量上升。
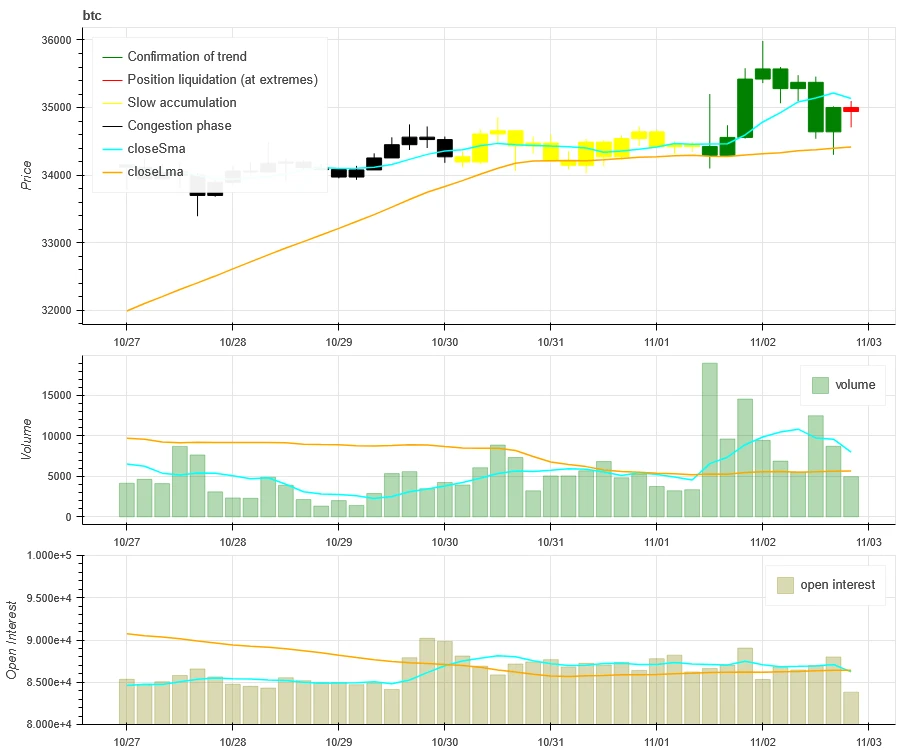
上图最上方 BTC 的价格走势,中间是成交量、最下方是未平仓量、浅蓝色是 1 天均值,橘色是 7 天均值。其中 K 线的颜色代表当前的状态,绿色是价格上升有成交量支持,红色是在平仓,黄色是在缓慢累积仓位,黑色是拥挤状态。
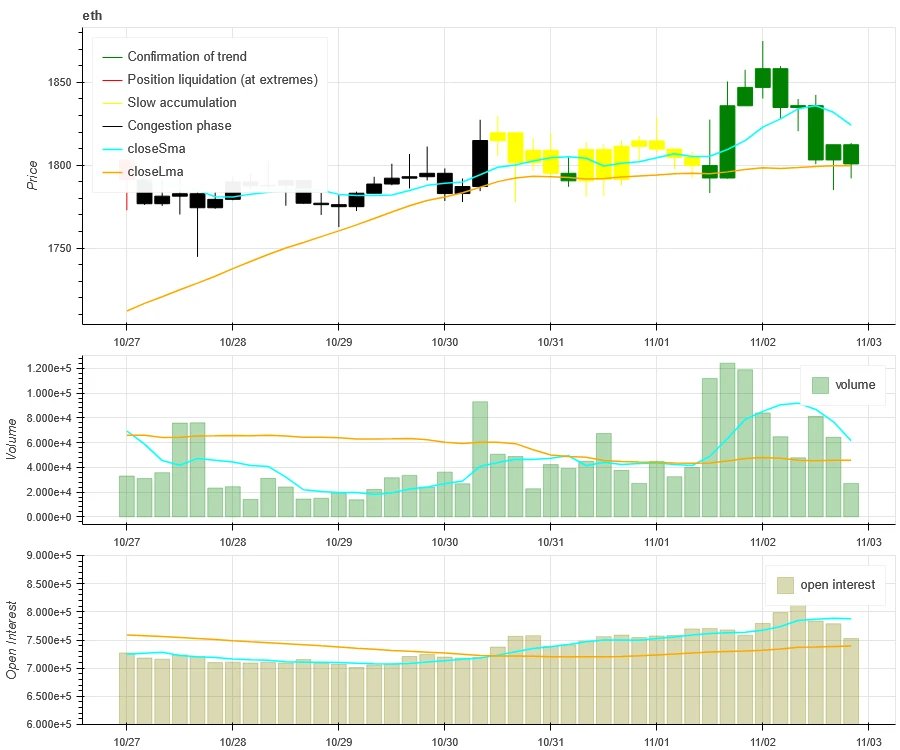
上图最上方 ETH 的价格走势,中间是成交量、最下方是未平仓量、浅蓝色是 1 天均值,橘色是 7 天均值。其中 K 线的颜色代表当前的状态,绿色是价格上升有成交量支持,红色是在平仓,黄色是在缓慢累积仓位,黑色是拥挤状态。
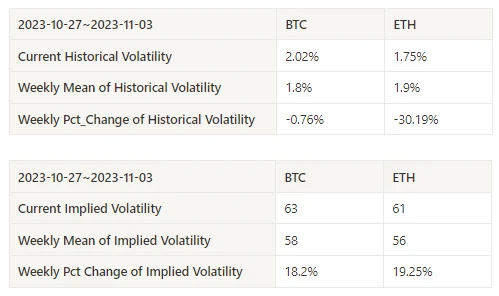
历史波动率与隐含波动率
过去一周 BTC 与 ETH 历史波动率在 11.1 最高,隐含波动率上升。
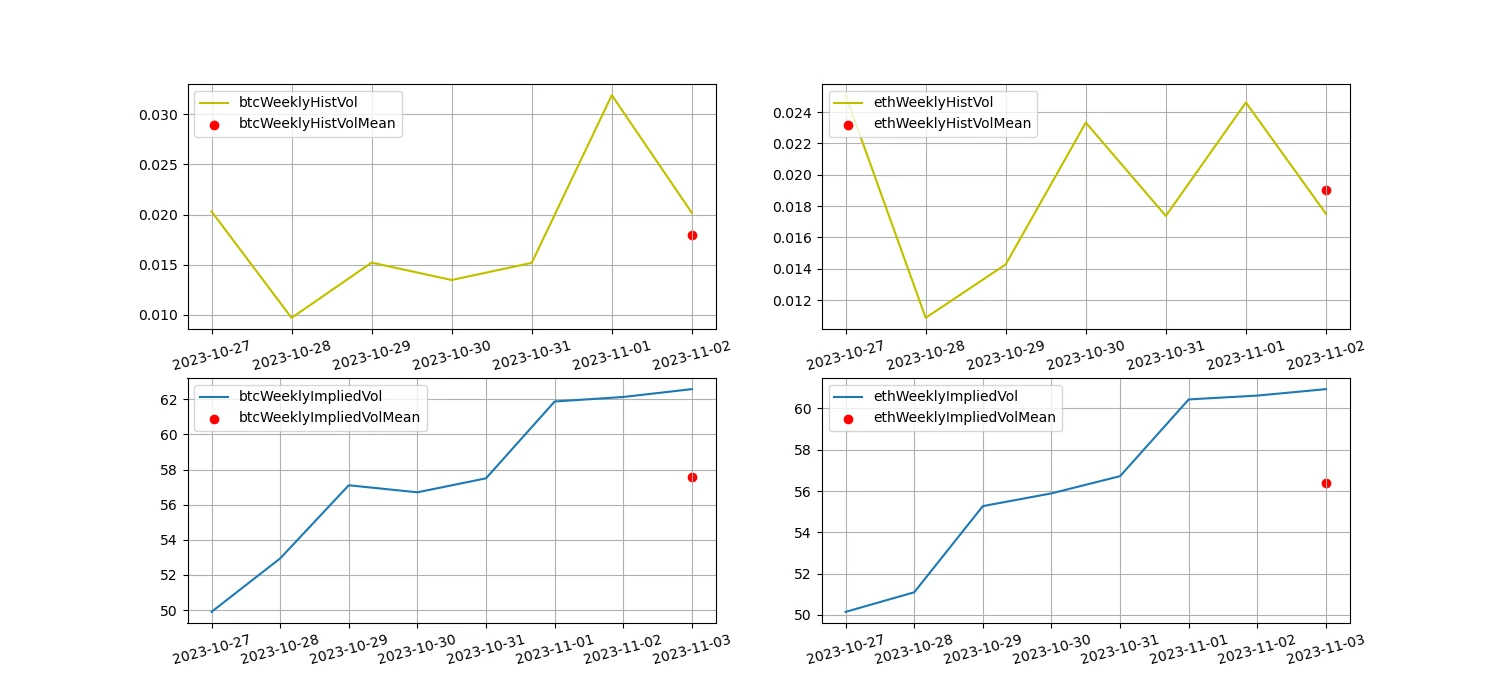
黄色线为历史波动率,蓝色线为隐含波动率,红点是其 7 日平均
事件驱动
美东时间 11 月 1 日周三,美联储货币政策委员会 FOMC 会后宣布,联邦基金利率的目标区间依然为 5.25% 到 5.50% ,将这一政策利率继续保持在二十二年来高位。关注今晚 11.03 的非农数据公布。
情緒指標
动量情绪
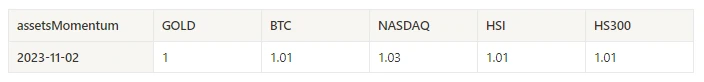
过去一周比特币/黄金/纳指/恒指/A 50 中,纳指最强势,而表现最差的为黄金。
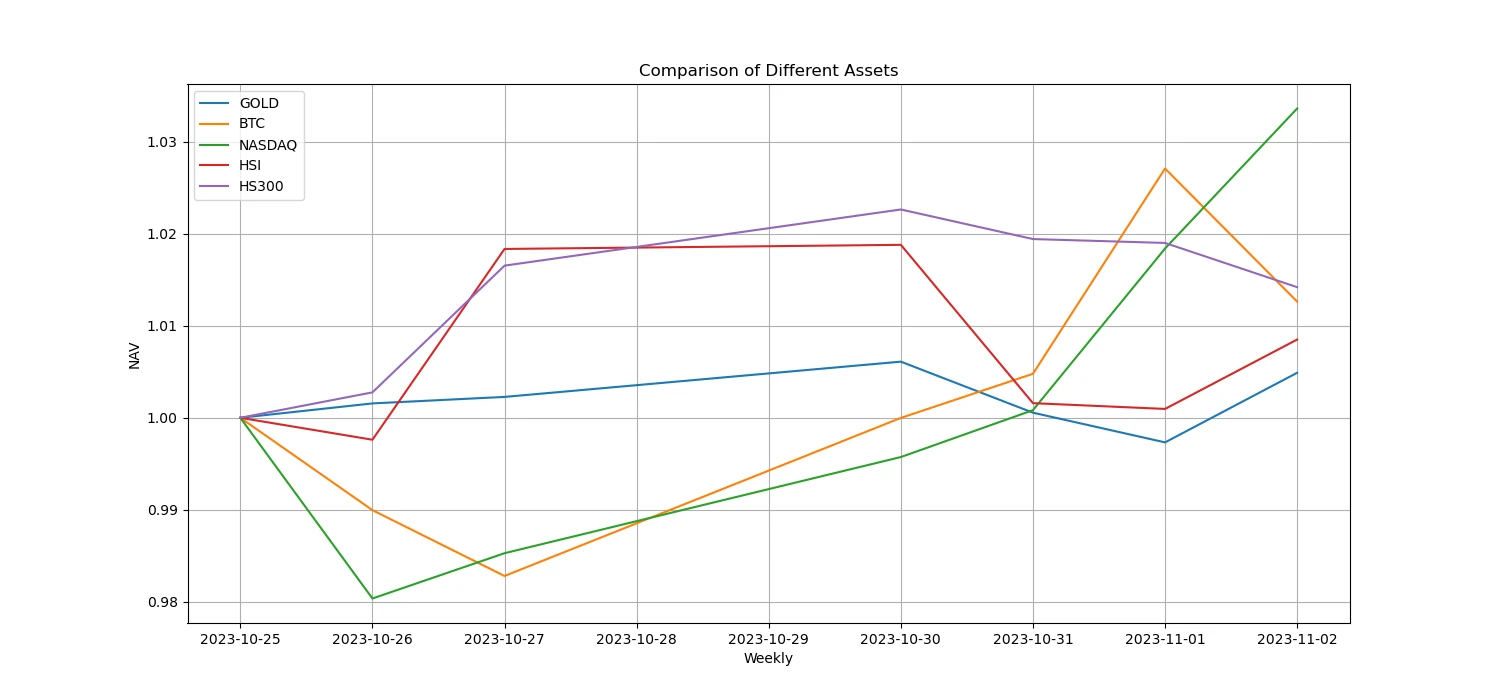
上图为不同资产过去一周的走势
放贷利率_借贷情绪
过去一周 USD 放贷年化收益平均为 17.5% ,利率稳定。
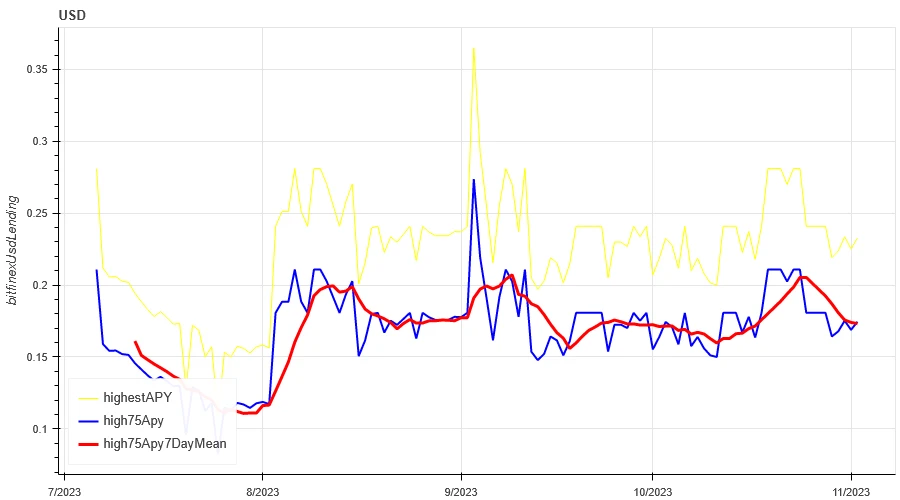
黄色线为 USD 利率的最高价,蓝色线为最高价的 75% ,红色线为最高价的 75% 的 7 天平均值
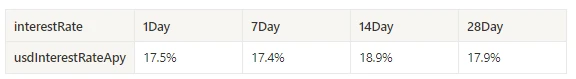
表格显示 USD 利率过去不同持有天数的平均收益
资金费率_合约杠杆情绪
过去一周 BTC 资费平均年化收益为 11%
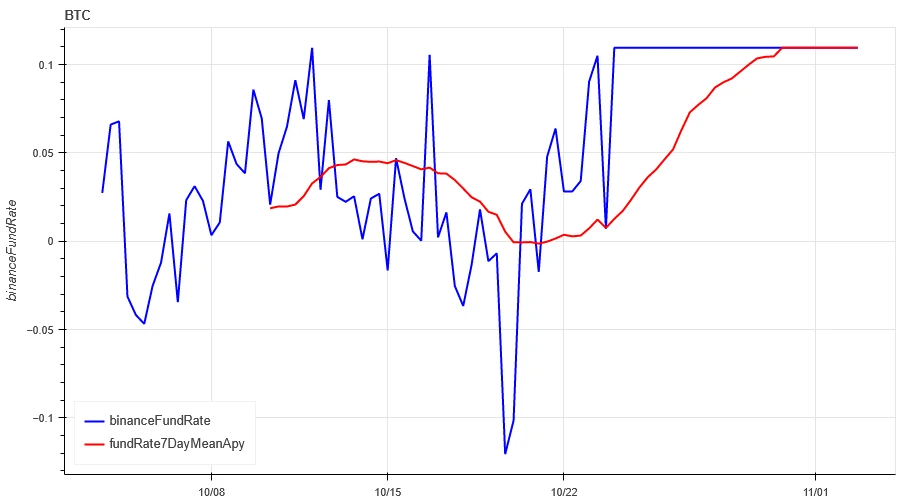
蓝色线为币安上 BTC 的资金费率,红色线为其 7 日平均
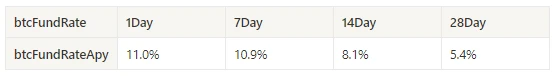
表格显示 BTC 的资费过去不同持有天数的平均收益
市场宽度_整体情绪
过去一周选中的 46 个币有 90% 的币在 30 日均线上方,市场维持在上升趋势中。
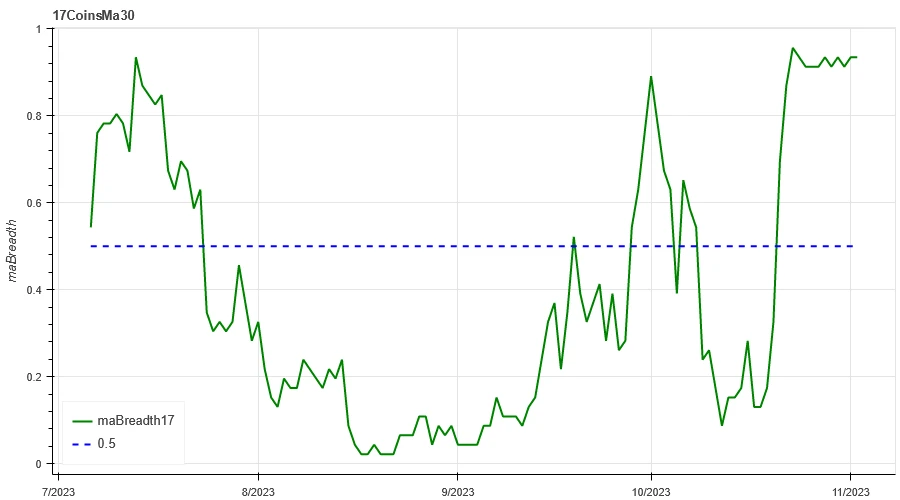
上图为['btc', 'eth', 'bnb', 'ltc', 'bch', 'doge', 'matic', 'sol','link','uni', 'enj','gala', 'mana', 'axs', 'dydx', 'fet' ,'gmx', 'xlm', 'xrp', 'ada', 'trx', 'sol', 'dot', 'avax', 'shib', 'atom', 'xmr', 'etc', 'ldo', 'hbar', 'apt', 'vet', 'qnt', 'vet','crv', 'aave', 'algo', 'ftm', 'ape', 'neo', 'sand', 'eos', 'xtz', 'rndr', 'theta', 'mkr']在 30 日均线上方的占比
市场相关性_一致性情绪
过去一周选中的 46 个币中相关性维持在 0.65 左右,不同品种间产生不一致的行情。
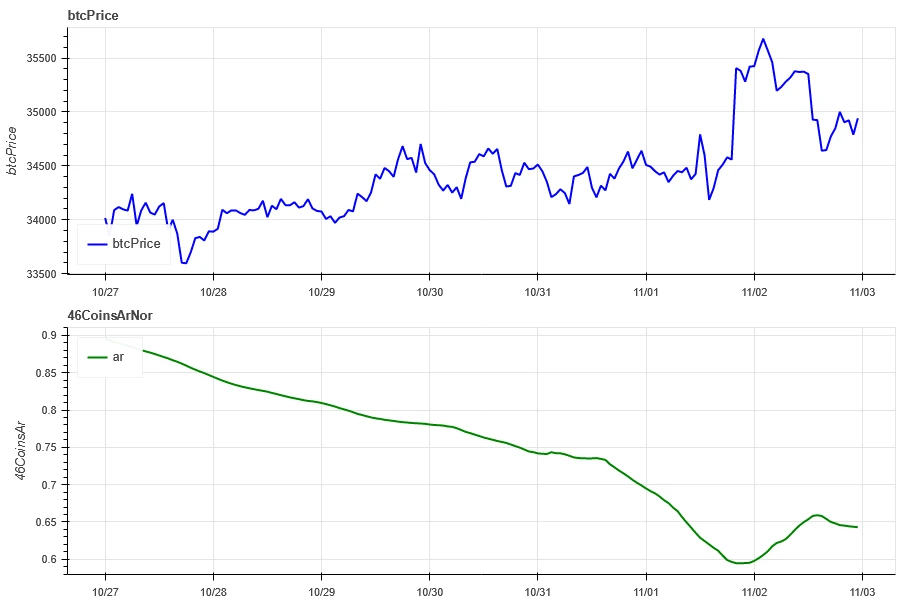
上图蓝色先为比特币价格,绿色线为['btc', 'eth', 'bnb', 'ltc', 'bch', 'doge', 'matic', 'sol','link','uni', 'enj','gala', 'mana', 'axs', 'dydx', 'fet' ,'gmx', 'xlm', 'xrp', 'ada', 'trx', 'sol', 'dot', 'avax', 'shib', 'atom', 'xmr', 'etc', 'ldo', 'hbar', 'apt', 'vet', 'qnt', 'vet','crv', 'aave', 'algo', 'ftm', 'ape', 'neo', 'sand', 'eos', 'xtz', 'rndr', 'theta', 'mkr']整体的相关性
市场热点_社交媒体情绪
过去一周热度最高分别的是 ADA/XMR。
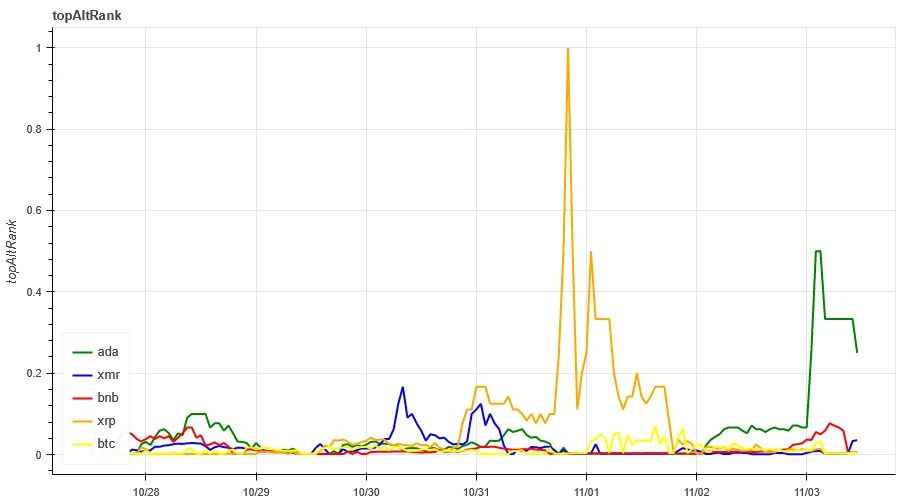
数据来源: https://lunarcrush.com/categories/cryptocurrencies
总结
是基本面向好还是拉高出货?唯一确定的是隐含波动率持续上升,波动率将放大;价格走势方面,BTC 经历一波较大涨幅创下历史新高后在高位横盘震荡,而 ETH 在 1800 的位置止步不前,BNB 在较底部的位置震荡;事件方面,美联储 FOMC 维持利率, 11.3 晚将公布非农数据,另外 FTX 即将清算的资产是影响加密市场未来一段时间价格走势的重点。
Twitter: @DerivativesCN
Website: https://dcbot.ai/