Bitcoin closed the week in the red at $26,917, recording its second consecutive week of declines and is likely to continue its correction in the near term.
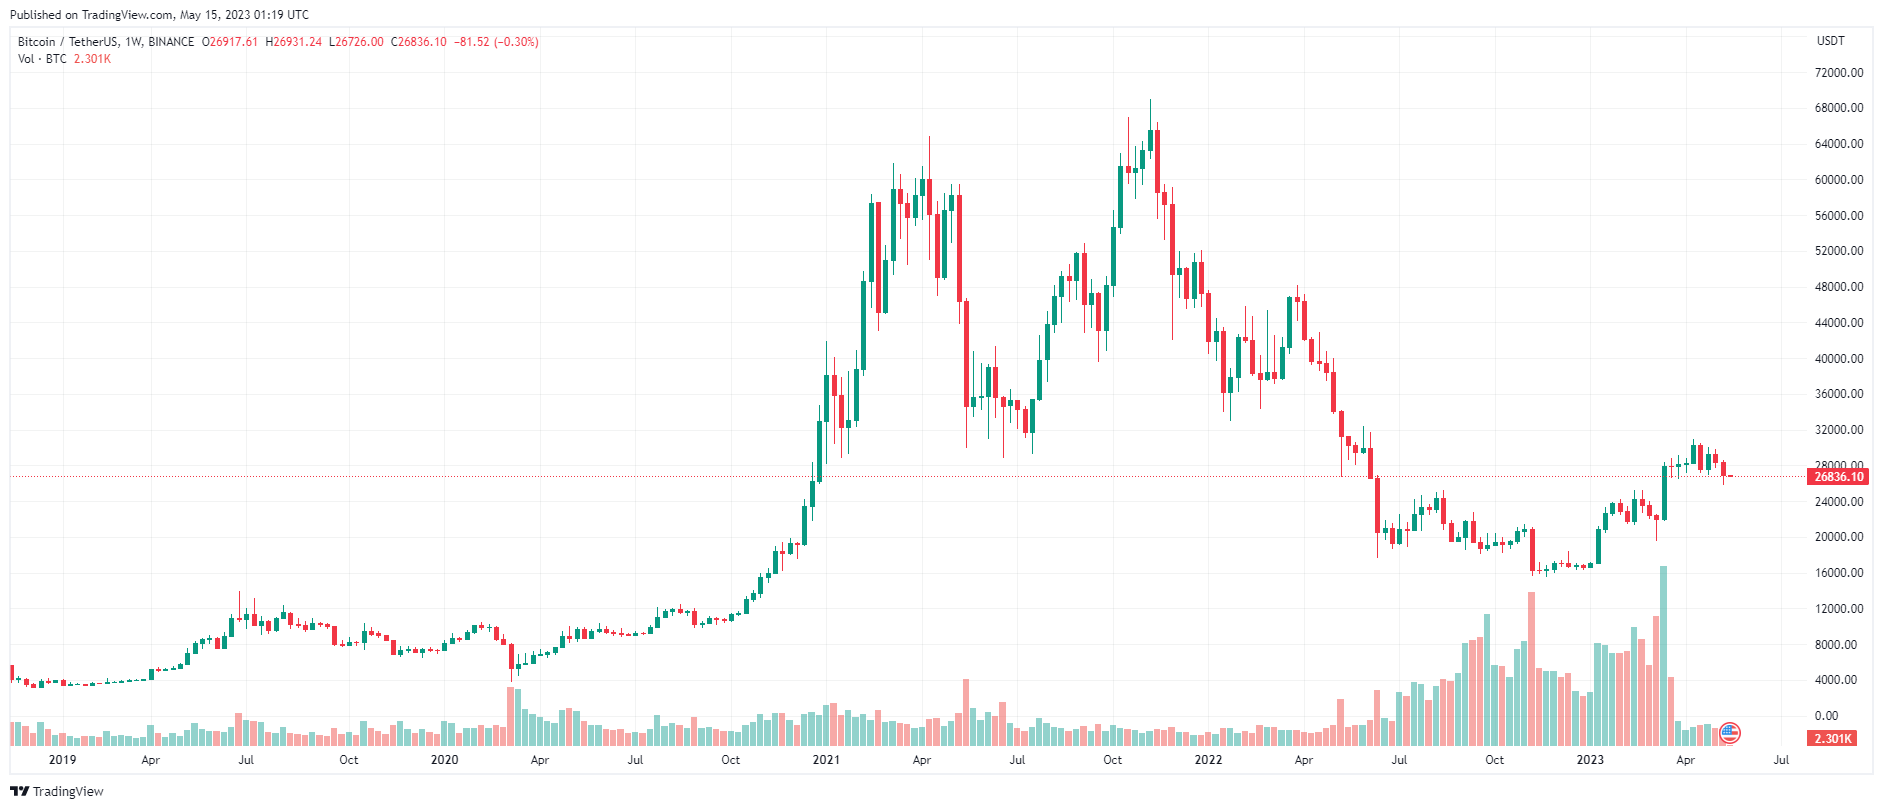
BTC Price Chart – 1 week | Source: TradingView
Futures on the US stock market fell slightly on Sunday evening after the Dow Jones and S&P 500 continued to close the week in the red.
Dow futures fell 70 points, or about 0.2%, while the S&P 500 and Nasdaq 100 futures fell 0.21% and 0.27%, respectively.
The S&P 500 and Dow lost 0.3% and 1.1% respectively last week. Meanwhile, the Nasdaq Composite gained 0.4%. Indices showed bearish momentum as the bleak sentiment surrounding the US economy weighed on investor sentiment.
Wall Street absorbed preliminary data from the University of Michigan last week, showing consumer sentiment fell to a 6-month low. Also, the focus is on debt ceiling negotiations as the US approaches "day X," with the government likely to default on its debt if it doesn't raise the limit to pay its bills. The meeting between President Joe Biden and congressional leaders on the topic has been rescheduled to next week.
On Monday, investors were watching the May data from the Empire State Index, which will show how New York State manufacturers feel about the economy. Economists polled by Dow Jones are expecting a 1, much lower than the 10.8 in the previous data.
Traders are also awaiting China's industrial output and retail sales data.
On the daily time frame, the price has declined since being rejected at the $30,000 resistance in April and it has also dipped below the 50-day moving average, which sits around the $29,000 mark.
Based on the recent candlestick pattern, an upside pullback towards the 50-day moving average is possible. However, the price could still move towards the $25,000 static support before returning to higher levels.
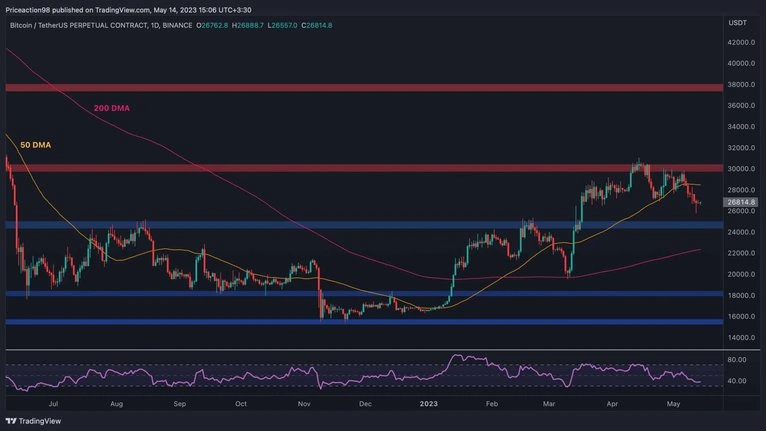
Source: TradingView
The 4-hour chart shows that BTC has dipped below the $27,500 support and is likely to test the $25,000 region in the coming days. However, with the RSI rising back above the oversold zone and a clear bullish divergence displayed between the two recent lows, the market could retest $27,500, which is currently acting as resistance. .
However, the market structure in this time frame remains bearish until BTC recovers above the $30,000 resistance level.
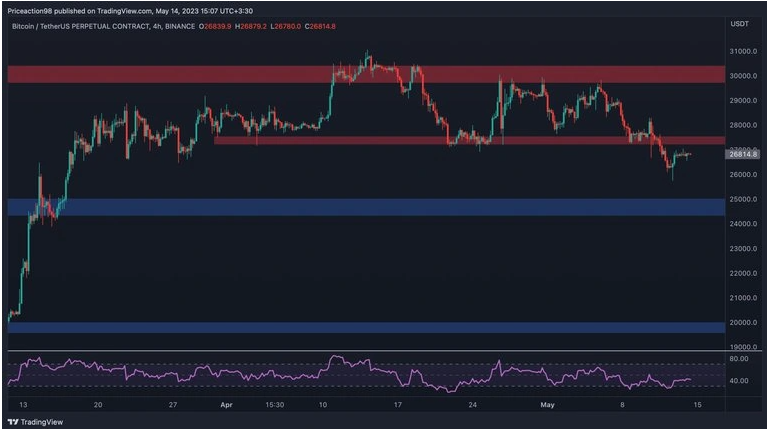
Source: TradingView
The Bitcoin network has reached ATH activity, with a new record of 682,000 daily transactions, marking a sharp increase from the 250,000 daily transactions at the beginning of 2023. The main reason for this increase is popularity. growing number of inscriptions, mainly used to create digital assets.
Unfortunately, the surge in Bitcoin activity and the growing popularity of the BRC-20 token has had a negative impact on the market. The Bitcoin network has become crowded, resulting in users paying higher transaction fees. This situation is affecting all Bitcoin participants, including everyday users and miners. Therefore, trading in the BTC market requires extra caution, as the market can be highly volatile.
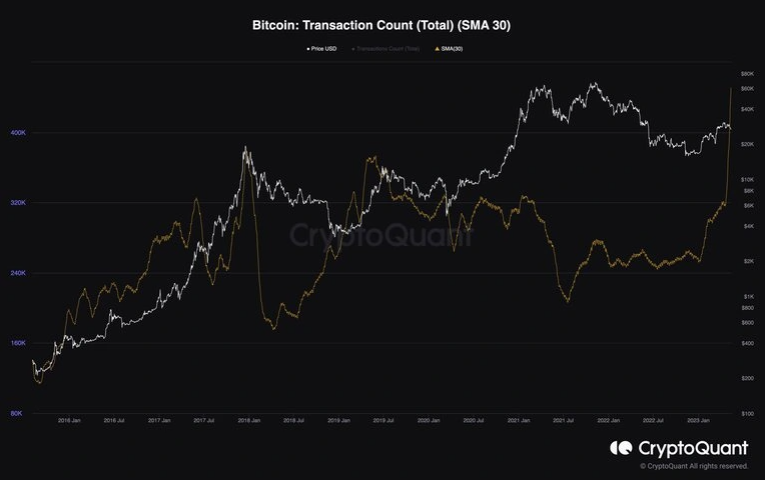
Source: CryptoQuant
On the Altcoin side, the market has recorded slight gains in the short term.
Leading the way was Conflux (CFX) with a profit of 13%, almost erasing all losses during the trading week.
In 2nd place is KAVA (KAVA) with a bounce of more than 8% on the day. On the 7-day timeframe, it is the project with the strongest breakout in the top 100, with a gain of almost 40%.
Other projects such as Sui (SUI), Huobi Token (HT), Toncoin (TON), Rocket Pool (RPL), Lido DAO (LDO), Aptos (APT), Frax Share (FXS), Litecoin (LTC)… increased from 4-7%.
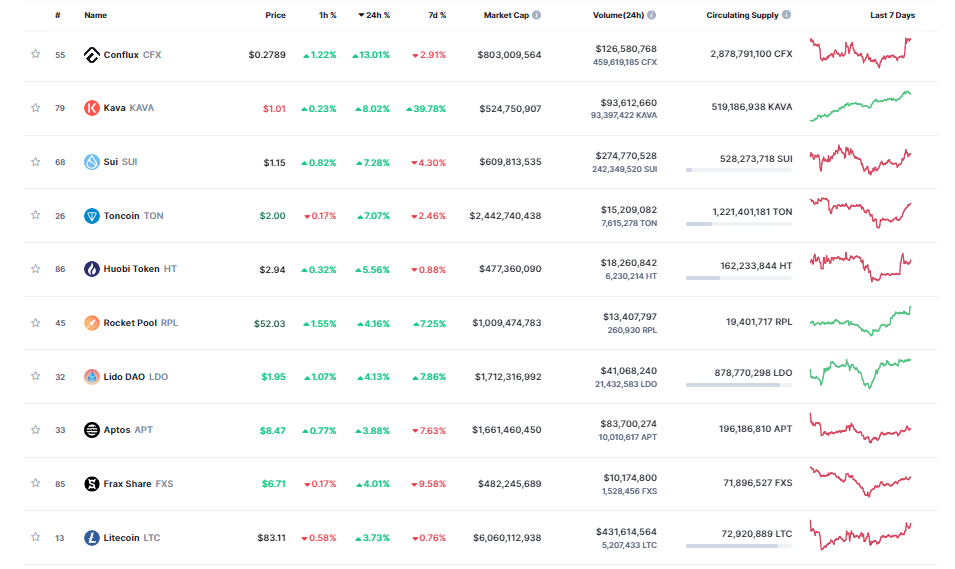
Source: Coinmarketcap
The column “Coin Price today” will be updated at 9:00 daily with general market news, readers are welcome to follow.