Why Only Dollar-Cost Averaging Can Capture Bitcoin's Long-Term Dividends?

比推Dipublikasikan tanggal 2026-03-06Terakhir diperbarui pada 2026-03-06

Abstrak

This article argues that dollar-cost averaging (DCA) is the optimal strategy for capturing Bitcoin's long-term gains, supported by historical backtesting and forward-looking models. The strategy involves investing a fixed amount regularly, regardless of market conditions. A five-year DCA simulation, starting in January 2021 with weekly $250 investments, resulted in a total investment of $67,500, acquiring approximately 1.65 BTC at an average price of $40,884. At a price of $71,000, the portfolio was worth ~$120,500, a 76% gain. Projections show even higher returns at $100,000 and the expected 2025 cycle peak of ~$126,000. A shorter-term DCA example starting in January 2024 showed an initial paper loss at current prices but significant projected profits at higher future price points. A comparison over five years also demonstrated that DCA into Bitcoin outperformed DCA into the S&P 500. Long-term modeling, based on Bitcoin's power-law growth curve, projects a median price of around $430,000 by 2030. A four-year DCA plan starting in 2026 could accumulate roughly 0.30 BTC, leading to substantial returns even under conservative price estimates. The key conclusion is that while entry timing affects the magnitude of gains, the duration of the holding period is the most critical factor for maximizing returns.

Written by: Cointelegraph

Compiled by: AididiaoJP, Foresight News

Original title: Why Only Dollar-Cost Averaging Can Capture Bitcoin's Long-Term Dividends?


Both backtest data and forward-looking models indicate that using a dollar-cost averaging (DCA) strategy to buy Bitcoin is the best way to invest in BTC. Will this method still work in the next bull market?

Bitcoin has experienced a 50% plunge over the past 5 months, and savvy investors adjust their strategies during such bear markets and correction periods. This strategy is called dollar-cost averaging (DCA), which involves investing a fixed amount regularly, regardless of market conditions.

By examining historical market cycle data and BTC price forward simulations, we can more clearly see how this steady investment approach performs across different entry times and investment horizons.

Five Years of DCA in Bitcoin Yields Substantial Net Gains

Starting from January 2021, investing $250 weekly in Bitcoin via DCA, the total investment over five years would be $67,500. According to DCA simulation data, this strategy would have accumulated 1.65097905 BTC, with an average purchase price of $40,884.

At Bitcoin's current price of nearly $71,000, this 1.65097905 BTC is worth approximately $120,500, resulting in a profit of $53,000 (a 76% increase). If Bitcoin rises to $100,000, the holdings would be worth about $165,000; and at the cycle peak of nearly $126,000 in October 2025, the holdings would reach a value of $208,000.

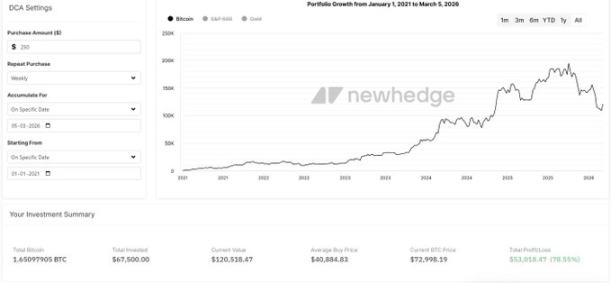
Bitcoin DCA Cycle 2021-2026 Source: Newhedge

Now consider a shorter investment period to see the impact of entry timing on early returns. Starting weekly $250 DCA from January 2024, the total investment is $28,500, accumulating 0.36863166 BTC with an average purchase price of $77,312.

At the current price of $71,000, this Bitcoin is worth approximately $26,909, representing a 6% paper loss. At a price of $100,000, the holdings would be worth $36,863; at the cycle peak of $126,000, the holdings would be worth $46,448.

In February this year, Swan Bitcoin analyst Adam Livingston compared on platform X the returns of DCA into BTC versus the S&P 500 index over the past five years. Investing $100 weekly resulted in $42,508 for BTC and $37,470 for the S&P 500, with returns of 62.9% and 43.6% respectively.

Livingston noted that although Bitcoin is highly volatile, historical data shows that persisting with DCA during downturns leads to higher long-term gains.

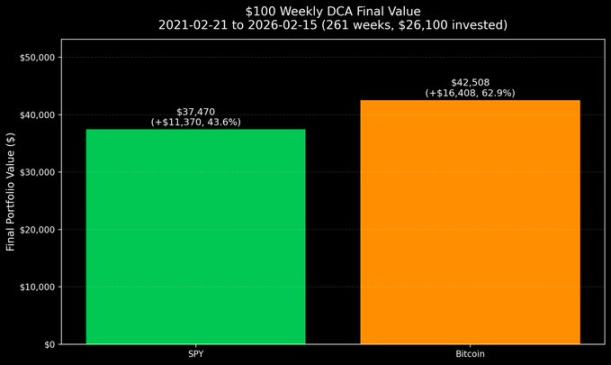
Weekly $100 DCA: BTC vs. S&P 500 Source: Adam Livingston/X

Long-Term Models: Time is the Key

Forward-looking simulation studies have also tested the effectiveness of DCA starting in 2026. Starting a weekly $250 DCA from January 2026 until March 2030 would mean a total investment of approximately $54,250.

The price prediction is based on Bitcoin's long-term power law growth curve (which tracks the historical relationship between Bitcoin's price and time on a logarithmic scale). This model generates a rising support band and a median trendline, largely consistent with previous market cycles.

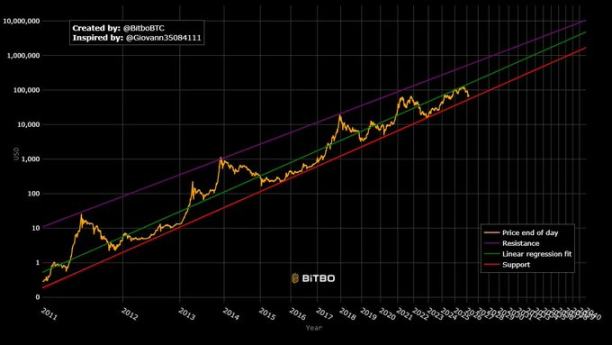
Bitcoin Power Law Growth Curve Source: Bitbo.io

Based on this model, analysts estimate the long-term trend support could break above $100,000 by 2028, which also serves as the foundational assumption for future DCA modeling. Bitcoin Well's simulation shows that by March 2030, the median price projection is approximately $430,000.

Accounting for potential price deviations, the model also considers the upper and lower bounds of the power law channel, providing a lower estimate (approx. $274,000) and a higher estimate (approx. $900,000).

Based on these assumptions, four years of DCA would accumulate roughly 0.30 BTC:

  • If BTC price is $274,000, holdings value ~$82,200.

  • If BTC price is $430,000 (median projection), holdings value ~$129,000.

  • If BTC price is $900,000, holdings value ~$270,000.

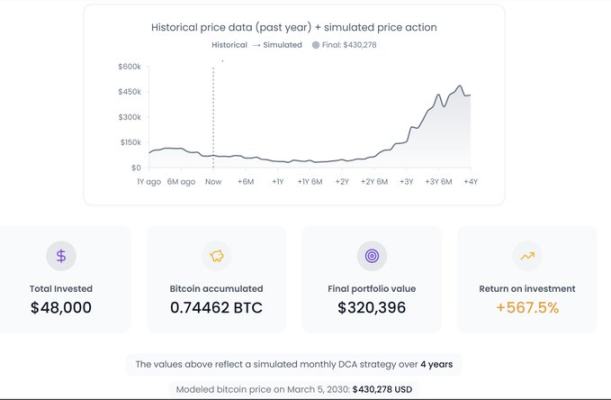
DCA Investment Results as of March 2030 Source: Bitcoin Well

In November 2025, Bitcoin researcher Sminston With conducted a study using a similar predictive model to test the impact of entry time on long-term returns. The findings revealed that even buying at a price 20% higher than the then price of $94,000 and selling at a price 20% lower than the projected 2035 median price, the remaining holdings after ten years would still yield a profit of nearly 300%.

In this simulation, the final total assets were 7.7 times the initial investment.

The study concluded: Entry timing affects the level of returns, but the duration of holding is the key determinant of the magnitude of gains.


Original link:https://www.bitpush.news/articles/7617498

Pertanyaan Terkait

QWhat is the main investment strategy discussed in the article for capturing Bitcoin's long-term gains?

AThe main investment strategy discussed is Dollar-Cost Averaging (DCA), which involves investing a fixed amount of money at regular intervals, regardless of market conditions.

QAccording to the backtest data, how much profit was generated from a 5-year DCA strategy starting in January 2021 with a weekly investment of $250?

AThe 5-year DCA strategy generated a profit of $53,000, a 76% increase, with the total investment of $67,500 growing to approximately $120,500 at a Bitcoin price of $71,000.

QWhat model is used to predict Bitcoin's future price in the long-term simulations mentioned in the article?

AThe long-term price predictions are based on Bitcoin's power-law growth curve model, which tracks the historical relationship between Bitcoin's price and time on a logarithmic scale.

QHow does the performance of a DCA strategy compare to investing in the S&P 500 index over a five-year period, as cited in the article?

AOver a five-year period, a weekly DCA investment of $100 in Bitcoin yielded $42,508 (a 62.9% return), outperforming the S&P 500 index, which yielded $37,470 (a 43.6% return).

QWhat is the key conclusion from the research by Bitcoin researcher Sminston With regarding the timing of entry and long-term holding?

AThe key conclusion is that while the timing of entry affects the magnitude of returns, the duration of holding (long-term holding) is the primary determinant of the overall profit size.

Bacaan Terkait

Berapa Utang Sebenarnya yang Dimiliki Strategy? Mungkinkah Terjadi Ledakan Utang?

Per 3 Juni 2026, MicroStrategy (MSTR) memegang 843,706 Bitcoin (nilai sekitar $531 miliar), tetapi juga memiliki utang yang signifikan. Struktur modalnya terdiri dari obligasi konversi senilai $6.754 miliar dengan beban bunga rendah (~$34.6 juta/tahun) dan saham preferen abadi senilai $15.482 miliar. Beban dividen tahunan dari saham preferen, terutama dari seri STRC ($9.78 miliar), mencapai sekitar $13.38 miliar. Ditambah bunga obligasi, total kewajiban tahunan perusahaan adalah $1.712 miliar, jauh melebihi pendapatan operasional perangkat lunaknya yang hanya ~$500 juta. Pada akhir Mei 2026, MicroStrategy menjual 32 Bitcoin (senilai $2.5 juta) untuk membayar dividen, melanggar janji lama "tidak pernah menjual". Ini menandakan tekanan likuiditas. Meskipun penjualan kecil, hal ini memicu penurunan harga Bitcoin dan saham MSTR. STRC, saham preferen abadi terbesar ($8.5 miliar), dirancang sebagai "pinjaman abadi" tanpa jatuh tempo untuk membeli lebih banyak Bitcoin tanpa menjual aset yang ada. Namun, dividen bulanannya yang tinggi (saat ini 11.5%) menjadi beban berat. Model bisnisnya bergantung pada siklus: menerbitkan STRC baru -> menggunakan dana untuk beli Bitcoin & bayar dividen -> mengandalkan apresiasi harga Bitcoin untuk menutupi biaya. Jika penerbitan STRC mandek atau harga Bitcoin stagnan, perusahaan harus menggunakan cadangan kas ($900 juta per Juni) atau akhirnya menjual Bitcoin untuk memenuhi kewajiban. Risiko utama bukanlah kebangkrutan atau likuidasi paksa Bitcoin (karena tidak dijaminkan), tetapi hilangnya kemampuan pendanaan. Jika premium saham MSTR atas nilai Bitcoin (mNAV) menyusut di bawah 1, mekanisme penerbitan saham/STRC untuk mengumpulkan dana akan terhambat. Dalam skenario terburuk, jika cadangan kas habis dan STRC tidak terjual, perusahaan mungkin perlu menjual sekitar 27,000 BTC per tahun (3.2% dari total kepemilikan) untuk membayar dividen, berpotensi menekan harga Bitcoin lebih lanjut. Singkatnya, MicroStrategy telah berevolusi dari perusahaan "HODL" Bitcoin menjadi sebuah "bank Bitcoin" yang kompleks, yang mengandalkan leverage keuangan dan apresiasi aset untuk mempertahankan operasinya. Kelangsungan model ini bergantung pada tiga pilar: harga Bitcoin yang terus naik, premium saham MSTR yang terjaga, dan pasar yang terus membeli instrumen pendanaannya seperti STRC.

marsbit4m yang lalu

Berapa Utang Sebenarnya yang Dimiliki Strategy? Mungkinkah Terjadi Ledakan Utang?

marsbit4m yang lalu

Anthropic Berteriak Serigala (AGI) Datang, Untuk Manusia atau IPO?

Anthropic menerbitkan artikel berjudul "When AI builds itself" yang membahas konsep peningkatan diri secara rekursif (recursive self-improvement) pada AI, di mana AI mulai berpartisipasi dalam desain, pelatihan, dan pengoptimalan versi penerusnya sendiri. Data internal menunjukkan bahwa lebih dari 80% kode yang digabungkan ke basis kode Anthropic hingga Mei 2026 ditulis oleh Claude, dan produktivitas insinyur meningkat sekitar 8 kali lipat dibandingkan tahun 2024. Claude juga semakin mampu menangani tugas-tugas rekayasa yang kompleks dan terbuka, dengan tingkat keberhasilan mencapai 76% pada Mei 2026. Claude tidak hanya menulis kode, tetapi juga digunakan dalam tinjauan kode, penelitian keamanan AI, dan proses penelitian lainnya. Anthropic menyoroti bahwa Claude semakin mampu memberikan saran yang lebih baik daripada manusia dalam beberapa tahap penelitian. Perusahaan memetakan evolusi dari pekerjaan manusia murni hingga agen AI yang dapat menjalankan dan mendelegasikan tugas. Anthropic memperingatkan tentang potensi "loop tertutup" di mana AI dapat terus meningkatkan diri sendiri secara mandiri, dan menyerukan perlunya mekanisme koordinasi global untuk memperlambat atau menghentikan sementara pengembangan AI depan jika risikonya meningkat. Artikel ini muncul di tengah persiapan IPO Anthropic. Sementara menyampaikan peringatan keamanan, ia juga menekankan posisi teknologi unggulan Anthropic, menyarankan bahwa Claude bukan hanya produk, tetapi juga alat produksi kunci yang tertanam dalam proses pengembangan model. Ini menciptakan narasi "roda gila" untuk menarik investor. Perbandingan dibuat dengan OpenAI, yang baru-baru ini juga menyebutkan tanda-tanda awal peningkatan diri rekursif tetapi lebih fokus pada tata kelola, sedangkan Anthropic lebih menonjolkan kemampuan internal dan kemajuan Claude.

marsbit1j yang lalu

Anthropic Berteriak Serigala (AGI) Datang, Untuk Manusia atau IPO?

marsbit1j yang lalu

Dengan Data Roadshow, Bagaimana Wall Street Melihat SpaceX Sekarang

Berdasarkan materi roadshow IPO yang diajukan ke SEC, SpaceX menargetkan valuasi sekitar $1,77 triliun dengan harga saham $135. Perusahaan ini tidak lagi hanya dilihat sebagai perusahaan roket, tetapi sebagai kompleks infrastruktur yang mengintegrasikan tiga lapisan: transportasi luar angkasa (Space), konektivitas satelit Starlink (Connectivity), dan infrastruktur komputasi AI. Data keuangan menunjukkan ketidakseimbangan: divisi Connectivity (Starlink) menghasilkan profit dengan EBITDA $72 miliar pada 2025, divisi Space menghasilkan $7 miliar, sedangkan divisi AI masih rugi $12 miliar. Secara keseluruhan, perusahaan mencatat kerugian GAAP $49 miliar pada 2025 dengan belanja modal yang sangat tinggi. Tanggapan Wall Street terpecah. Sejumlah analis dan investor melihat premium untuk platform infrastruktur masa depan yang sulit ditiru. Namun, pihak lain menyoroti valuasi yang sangat tinggi, dengan perbandingan price-to-sales antara 90-103x. Beberapa estimasi valuasi yang lebih konservatif muncul, seperti $780 miliar dari Morningstar dan sekitar $1,25 triliun dari investor lama Scottish Mortgage. Tiga titik kunci yang akan diawasi pasar adalah: pertumbuhan dan profitabilitas berkelanjutan Starlink, kelayakan rencana ambisius divisi AI, serta diskon tata kelola karena struktur kepemilikan saham supervoting Elon Musk yang mengendalikan 82,4% hak suara. Inti perdebatan adalah seberapa banyak investor mau membayar untuk kombinasi arus kas nyata, roadmap teknologi futuristik, dan "premium Musk" dalam satu paket.

marsbit1j yang lalu

Dengan Data Roadshow, Bagaimana Wall Street Melihat SpaceX Sekarang

marsbit1j yang lalu

Trading

Spot
Futures
活动图片