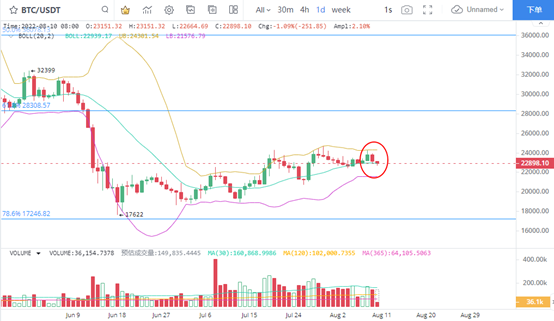
1. BTC pullback prompt adjustment signal
After the price increase narrows in the rebound stage, BTC's Bollinger line index is obviously in a closed state. At this time, BTC's short-term rebounded to the brin line and retreated after encountering obstacles. The closing fall of the price on August 9 further indicated a reversal signal. BTC appears to be in the form of breaking its head and breaking its feet at the position in the figure. The price has nearly fallen below the corresponding US $22939 of the middle rail of the brin line, indicating that BTC is choosing to retreat downward. Judging from this, the risk of holding currency has been increased recently. Especially during the period of shrinking trading volume, the rebound rhythm of BTC did not slow down, and the pressure of price correction began to appear.
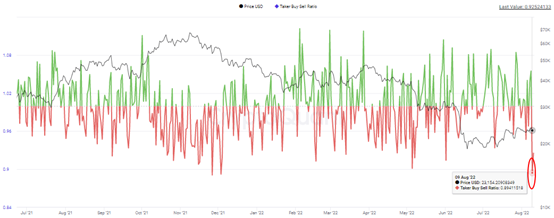
2. The divergence between the long and the short is increasing
The divergence between long and short contracts of BTC has increased. On August 9, the long and short strength began to incline to the short side, and the long and short ratio dropped to 0.894, the lowest value after December 3, 2021. That is to say, the BTC starts to prompt a downward pullback transaction signal. Of course, the decline of the long / short ratio is not completed in a short time. Since July 22, the long / short ratio has gradually dropped, and the value has gradually dropped from around 1.09 to the low point on August 9. During the fall of the long / short ratio, the BTC price began to stagnate, further verifying the downward risk.
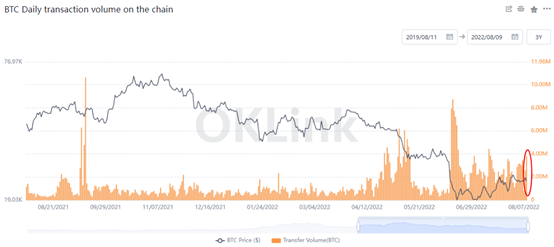
3. BTC chain transfer is very active
The relatively active online transfer data shows that BTC is currently in a stage of high investor attention. Especially when the spot trading volume of the exchange remains stable, the synchronous performance of online transfer is better, which means that the potential trading heat of BTC is not low. Nevertheless, considering that the performance of the number of active addresses is not ideal, the number of active addresses per day remains around 900000, which is obviously lower than the average level before the middle of 2021. Therefore, in the near future, we can properly pay attention to the selling pressure changes of price pullback and pay attention to the opportunities of low price.
4. Eth long and short scramble to a critical stage
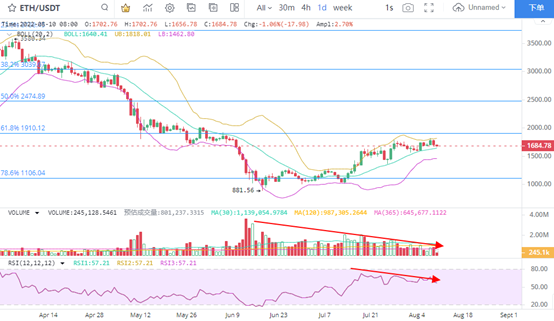
The ETH price fluctuates relatively frequently, and the point continues to be close to the corresponding USD 1910 of 61.8% of Fibonacci. At the same time, the intraday trading volume of eth continues to shrink, and the RSI index continues to indicate a deviation from the falling signal, so it is imperative to change the price. On the news side, the merger date of eth is approaching, and the breakthrough direction change after the price fluctuation will be paid attention to after the positive cashing. On the trend, after the ETH rebound space improved, the confirmation of the support of USD 1000 continued to strengthen. There are many adjustment factors that need to be considered in the near future, and the selling of the price below $2000 needs attention.
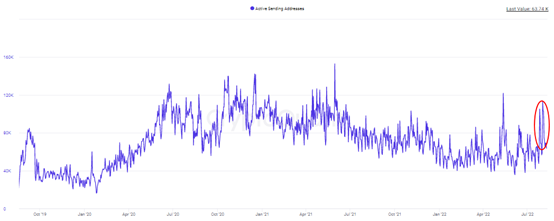
5. Stable coin sending address activity rebound
Recently, the number of sending addresses of eth rebounded in the short term, and the fluctuation trend was consistent with the performance of eth. In the same period, the number of receiving addresses of stable coins showed a steady decline, which means that the concentration of stable coins is increasing while the supply of stable coins is generally unchanged. Most stable coin holders send a large number of stable coins, which means that the concentration of stable coins rebounds in the short term.
This shows that the main force of holding coins, or the number of giant whales holding coins, has increased, which has a deeper impact on the market.