Executive Summary
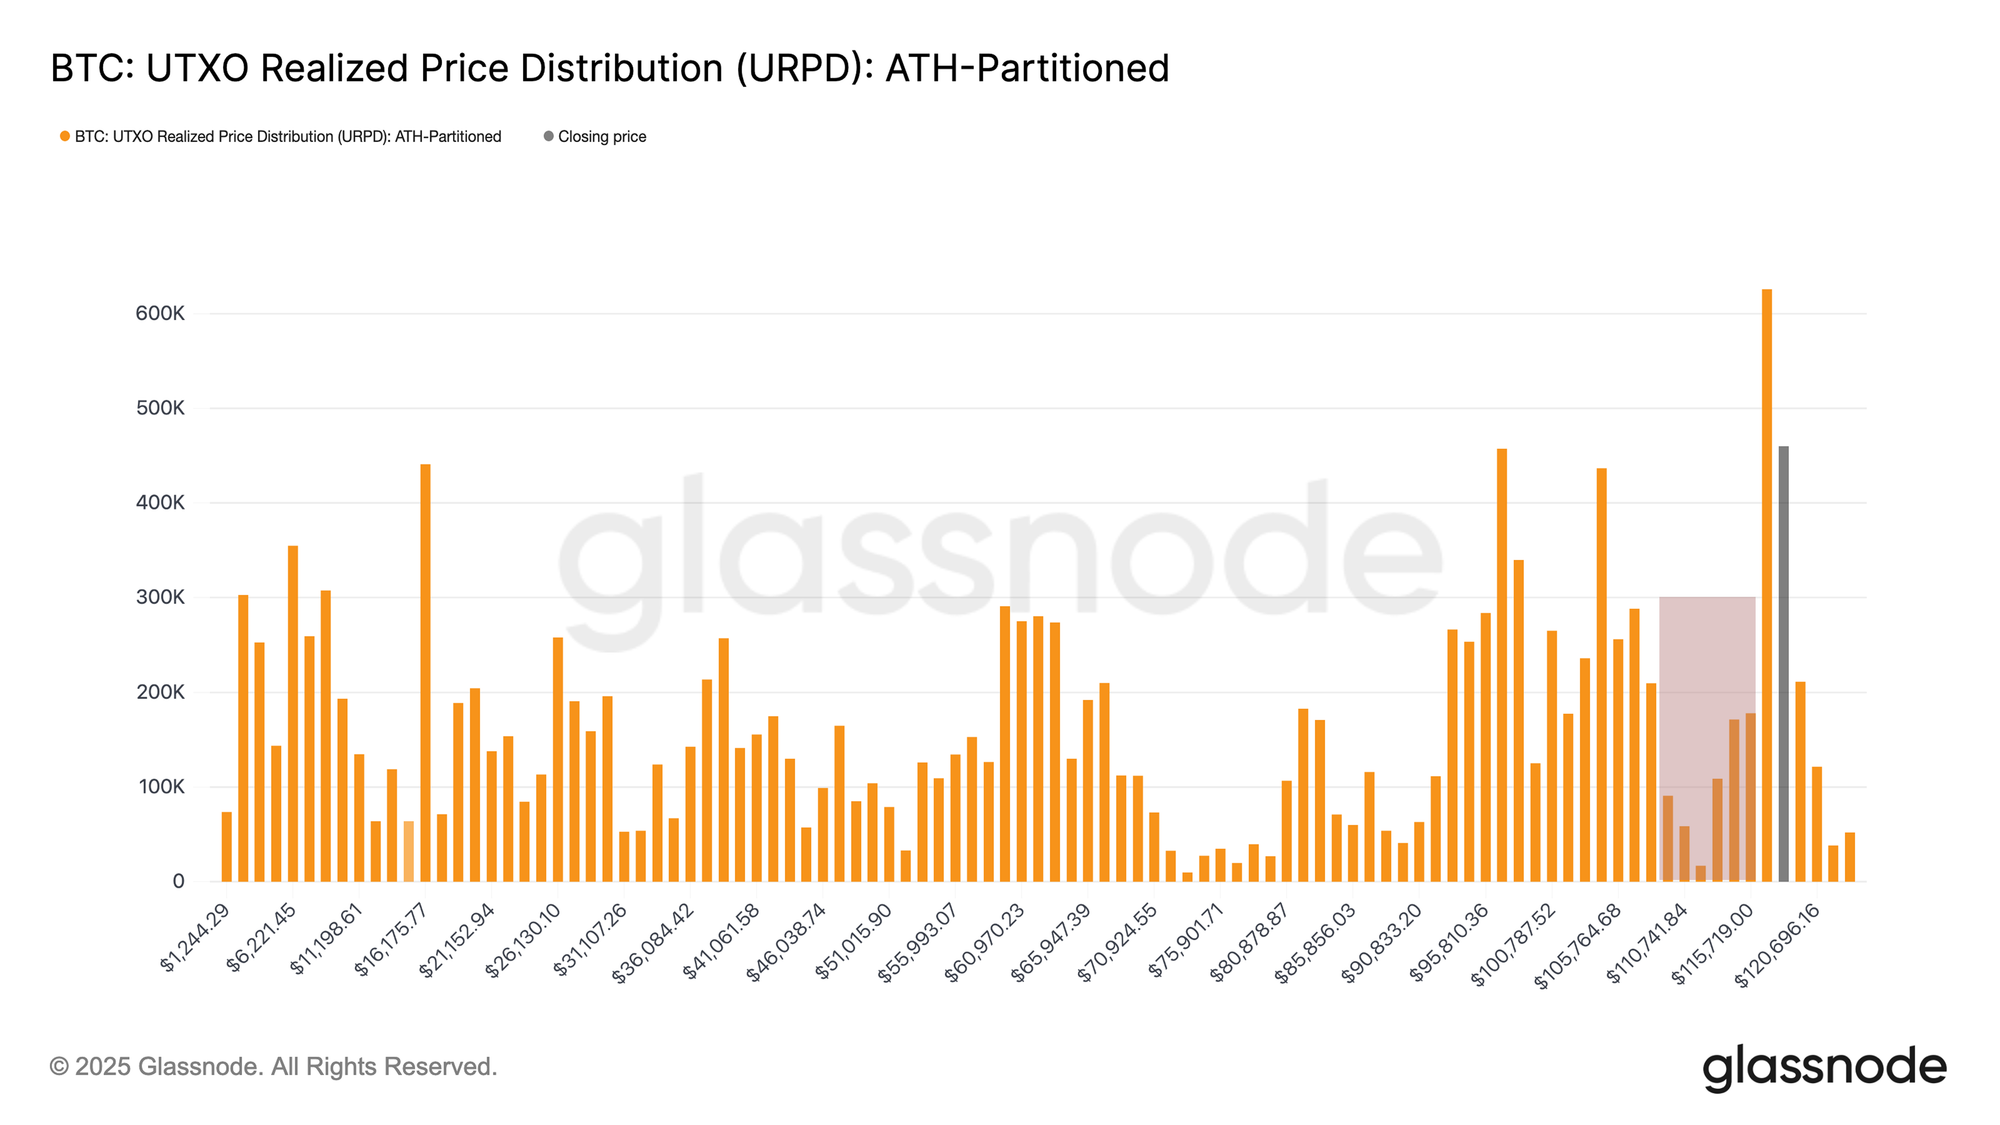
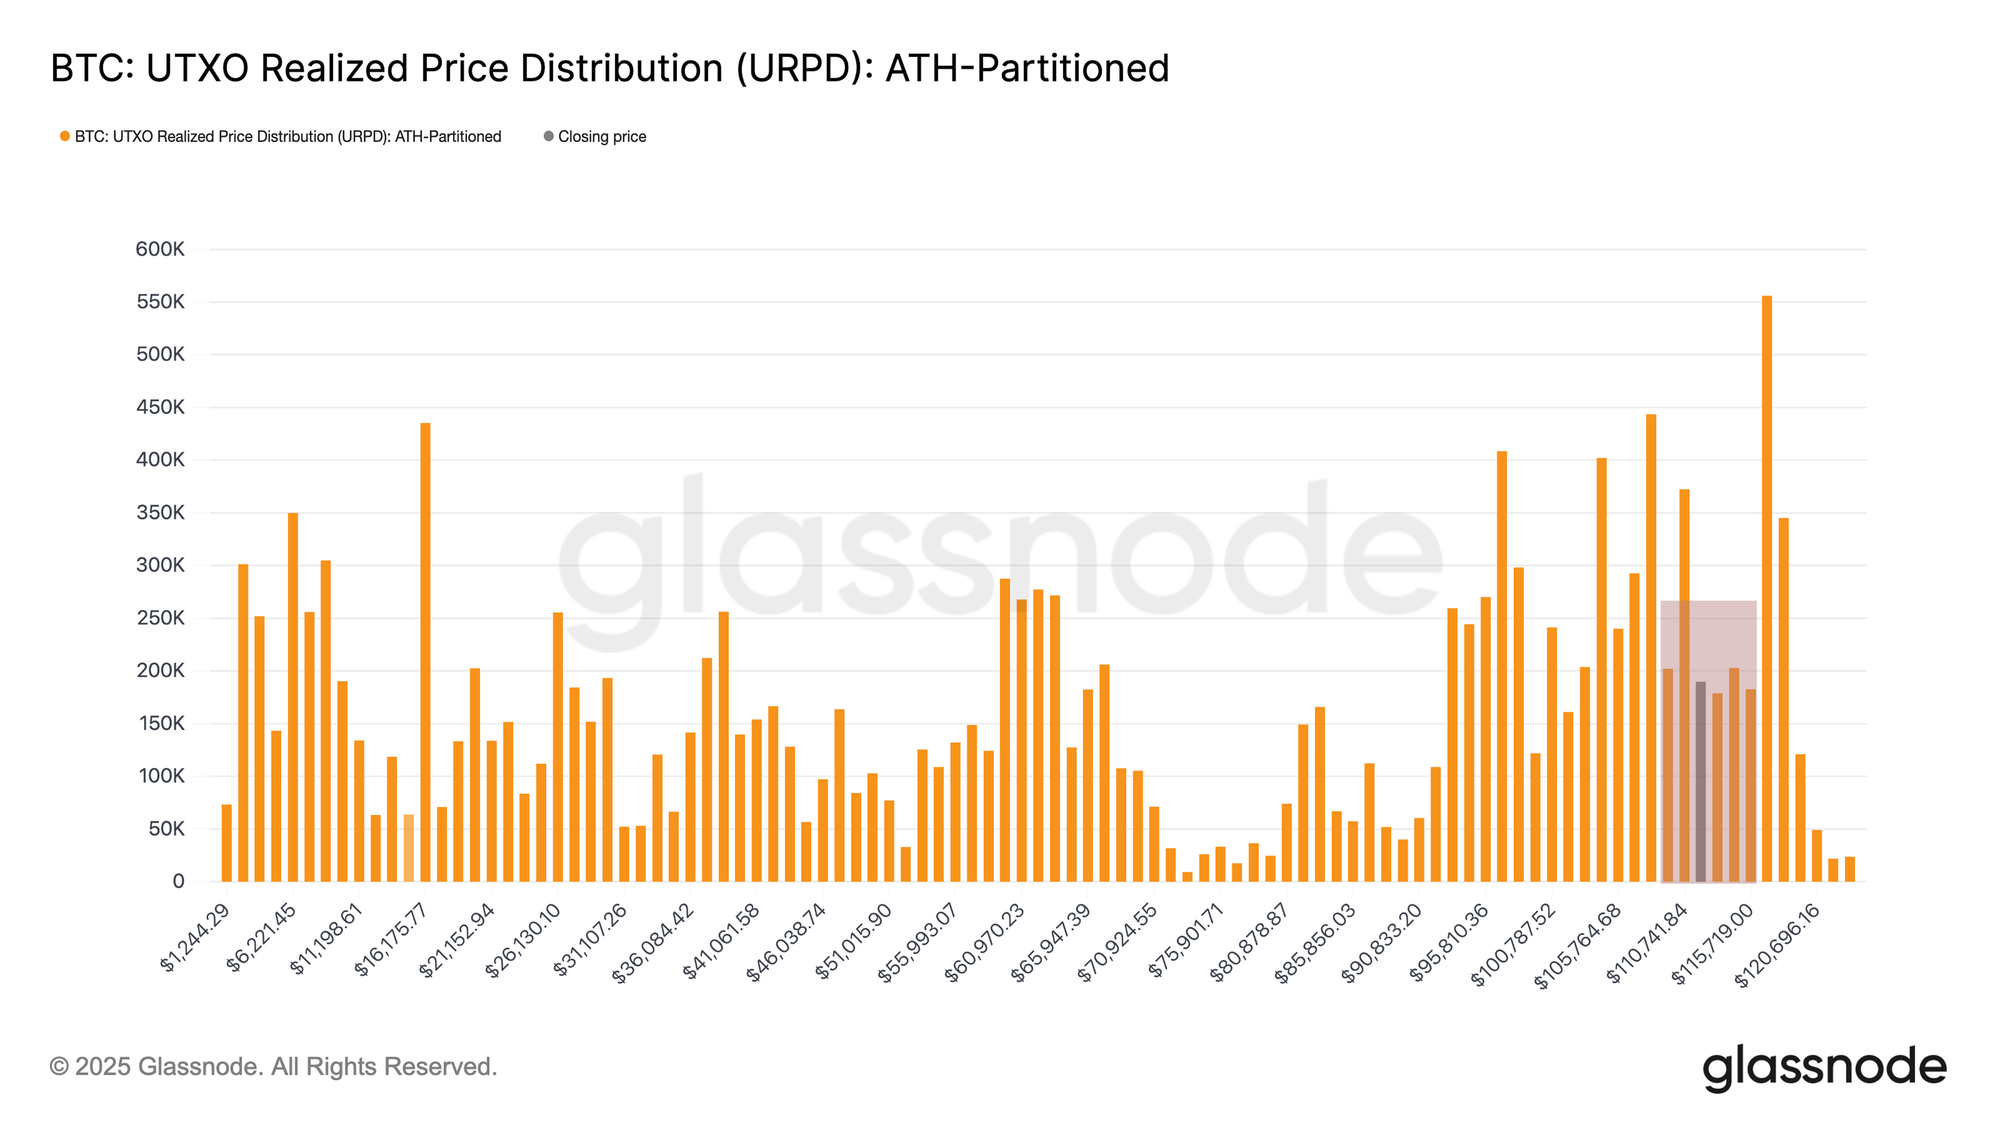
- Bitcoin trades near $112k, consolidating between $104k and $116k. URPD shows investors accumulated in the $108k–$116k range, filling the air gap. This reflects constructive dip-buying, though it does not rule out further contraction.
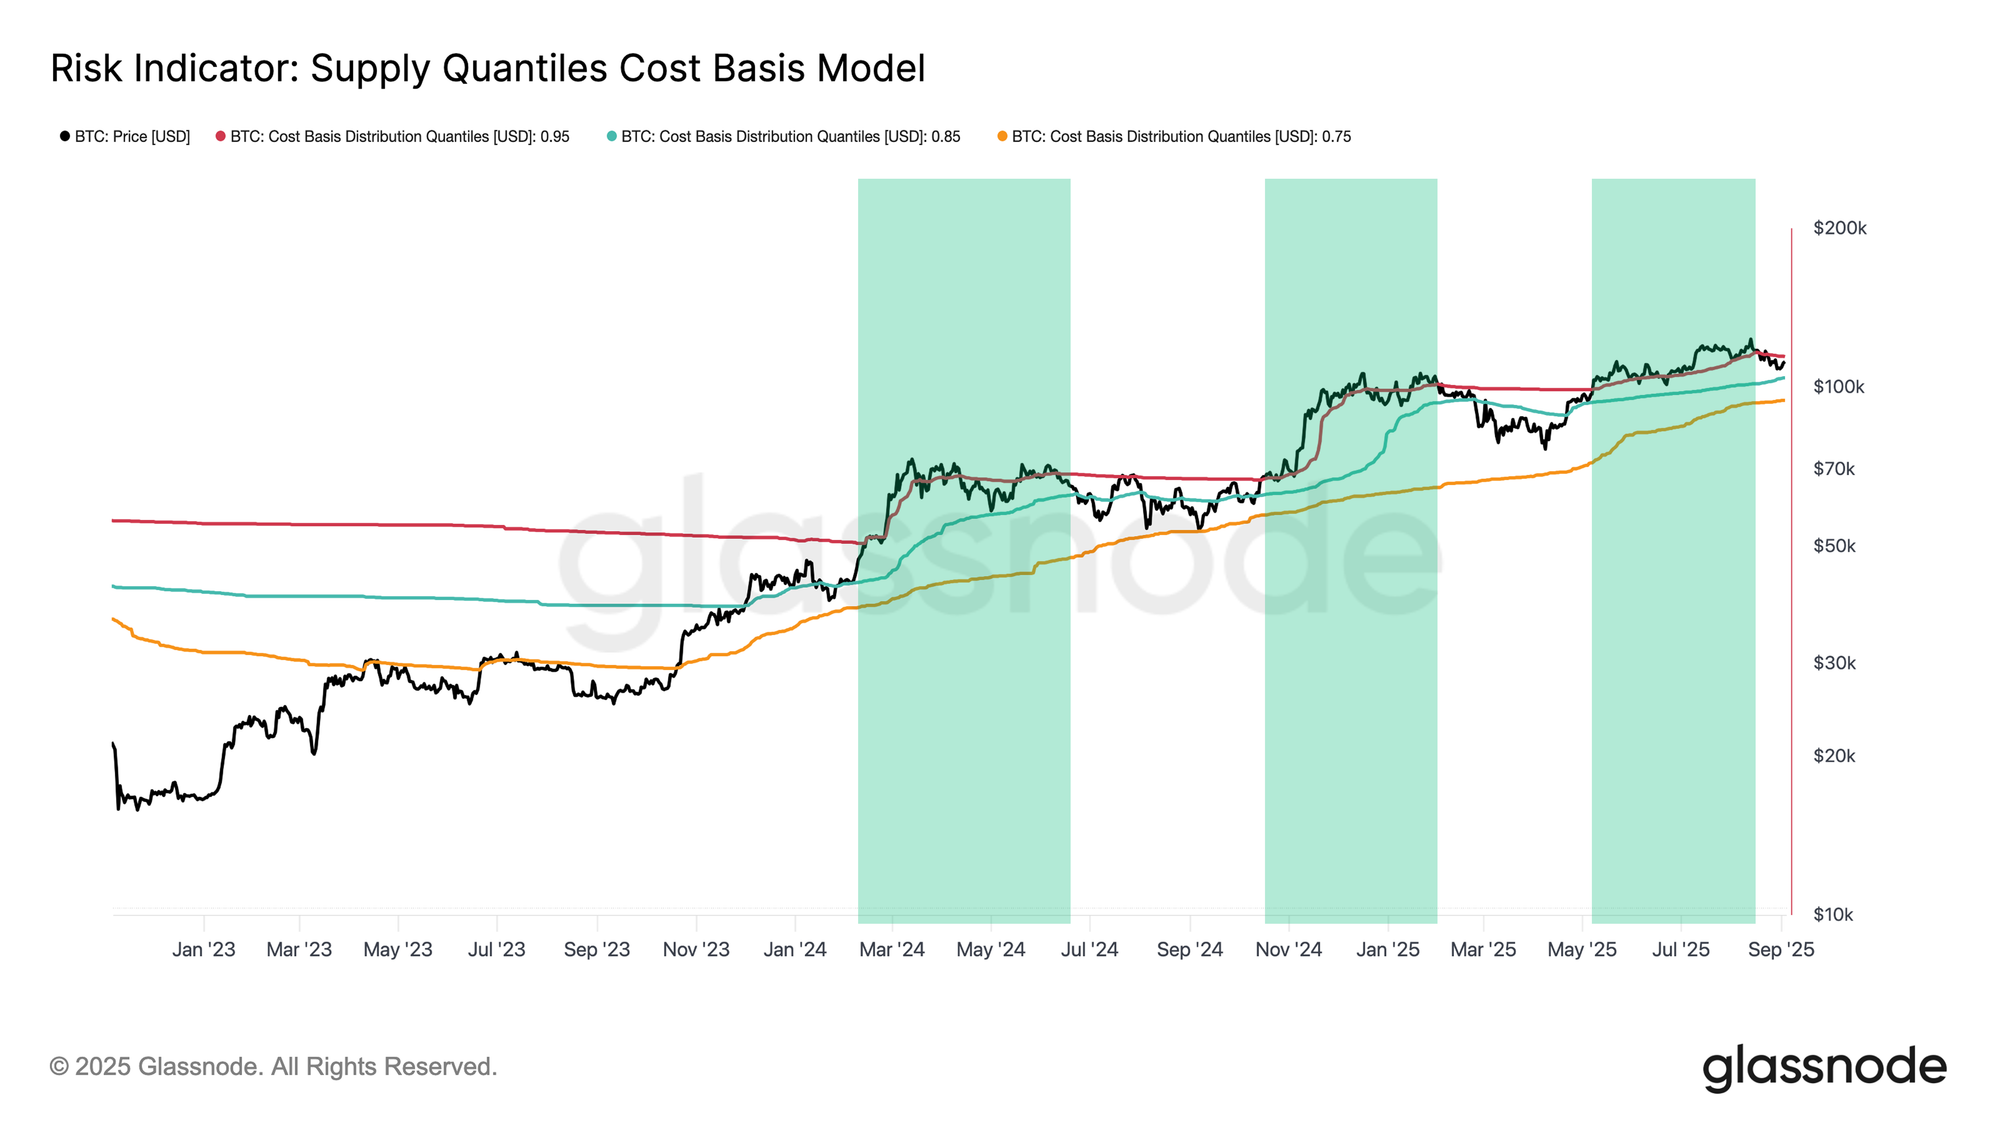
- The break below the 0.95-quantile cost basis ended a 3.5-month euphoric phase, placing the price back into the $104k–$114k band. Historically, this zone has been a corridor of sideways consolidation before the next decisive trend.
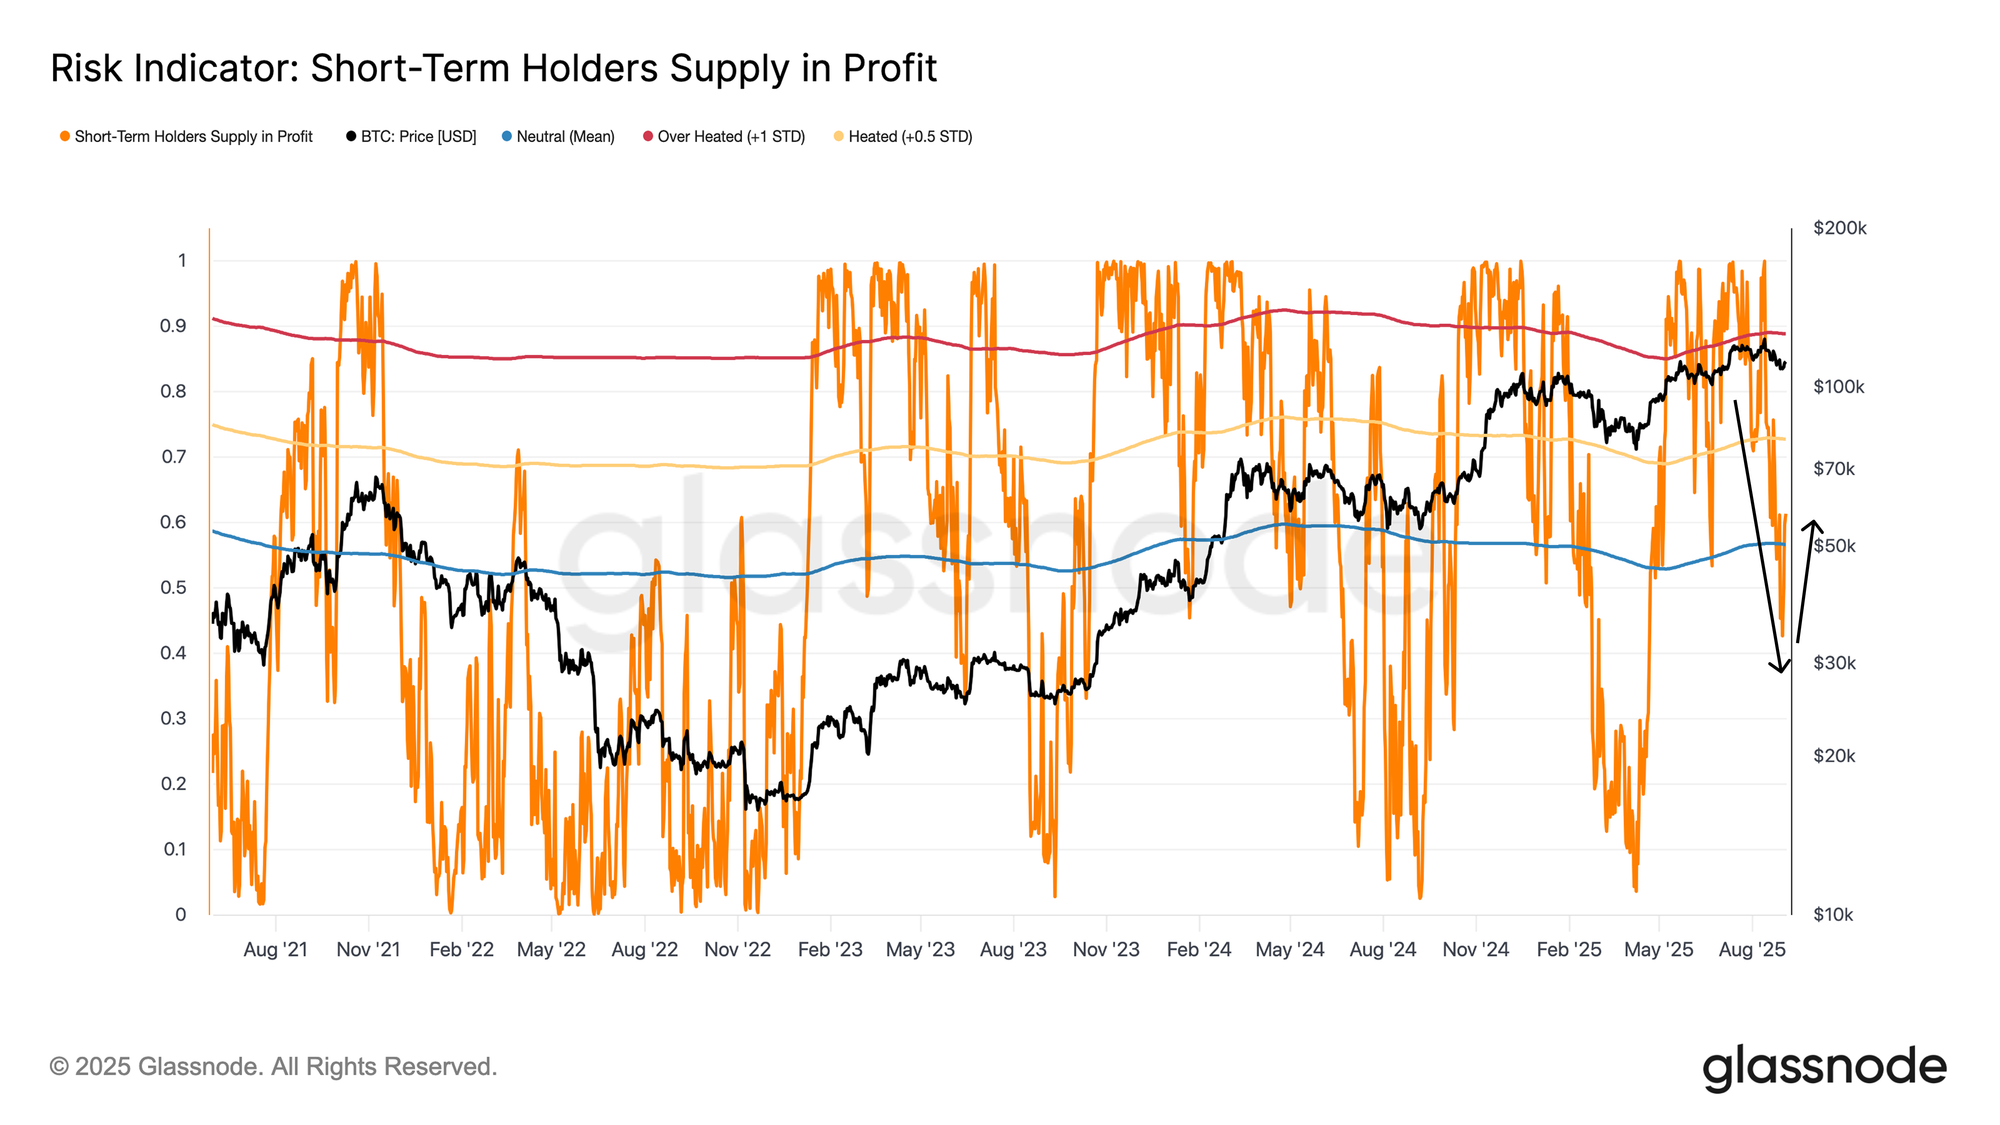
- Short-term holder profitability dropped sharply to 42% during the selloff, before rebounding to 60%. This bounce leaves the market neutral but fragile, with confirmation of renewed momentum only if price reclaims $114k–$116k.
- Off-chain sentiment is cooling. Futures funding remains neutral but vulnerable, while ETF inflows have slowed sharply. Bitcoin ETF flows were primarily directional spot demand, while Ethereum flows reflected a mix of spot demand and cash-and-carry arbitrage.
Accumulating in the Gap
Since the mid-August all-time high, Bitcoin has entered a volatile downtrend, declining to $108k before bouncing back toward $112k. With volatility rising, the central question is whether this marks the start of a true bear market or simply a short-term contraction. To address this, we turn to both on-chain and off-chain metrics.
A useful starting point is the UTXO Realized Price Distribution (URPD), which shows at what prices the current set of Bitcoin UTXOs were created, providing insight into where investors acquired their coins.
Comparing the snapshot from August 13th with the current structure, it is evident that investors have taken advantage of the pullback into the $108k–$116k “air gap.” Accumulation has steadily filled this range, reflecting a clear “buy-the-dip” response. This behaviour is constructive for the longer term, yet it does not eliminate the risk of further contraction in the short to mid-term.
From Euphoria to Exhaustion
While the URPD highlights constructive dip-buying, the case for continued weakness stems from the broader cycle context. The rally to new highs in mid-August was the third multi-month euphoric phase of this cycle, defined by overwhelming price momentum pushing the majority of supply into profit. Sustaining such periods requires relentless capital inflows strong enough to offset persistent profit-taking, a dynamic that rarely endures for long.
This behaviour is captured by the 0.95 quantile cost basis, the threshold above which 95% of supply is in profit. The most recent euphoric phase lasted roughly 3.5 months before demand finally showed signs of exhaustion, with Bitcoin falling back below this band on August 19.
At present, the price trades between the 0.85 and 0.95 quantile cost basis, or in the $104.1k–$114.3k range. Historically, this zone has acted as a consolidation corridor following euphoric peaks, often leading to a choppy sideways market. Therefore, breaking below $104.1k would replay the post-ATH exhaustion phases seen earlier in this cycle, whereas a recovery above $114.3k would signal demand finding its footing and reclaiming control of the trend.
Short-Term Holders Under Pressure
Given that Bitcoin is now trading in a decisive range, the behaviour of recent buyers becomes crucial. Short-term holders’ unrealized profit and loss are often the main psychological drivers shaping local tops and bottoms, as sudden swings between profit and loss dictate their reactions.
The percentage of short-term holder supply in profit provides a clear lens on this dynamic. With the leg down to $108k, their share in profit collapsed from above 90% to just 42%, a textbook cooling-off from an overheated state to a zone of sudden stress. Such sharp reversals typically provoke fear-driven selling from top buyers, which is then often followed by exhaustion of the very same sellers. This pattern explains the recent rebound from $108k back to $112k.
At current prices, more than 60% of short-term holder supply is back in profit, a neutral stance compared to the extremes of recent weeks. However, this comeback remains fragile. Only a sustained recovery above $114k–$116k, where over 75% of short-term holder supply would return to profit, could provide the confidence necessary to attract new demand and fuel the next leg higher.
After digesting the current stage of the market through on-chain price models and the profitability lens of short-term holders, the next step is to assess whether off-chain indicators align with these signals or point to divergences
A Sentiment Probe
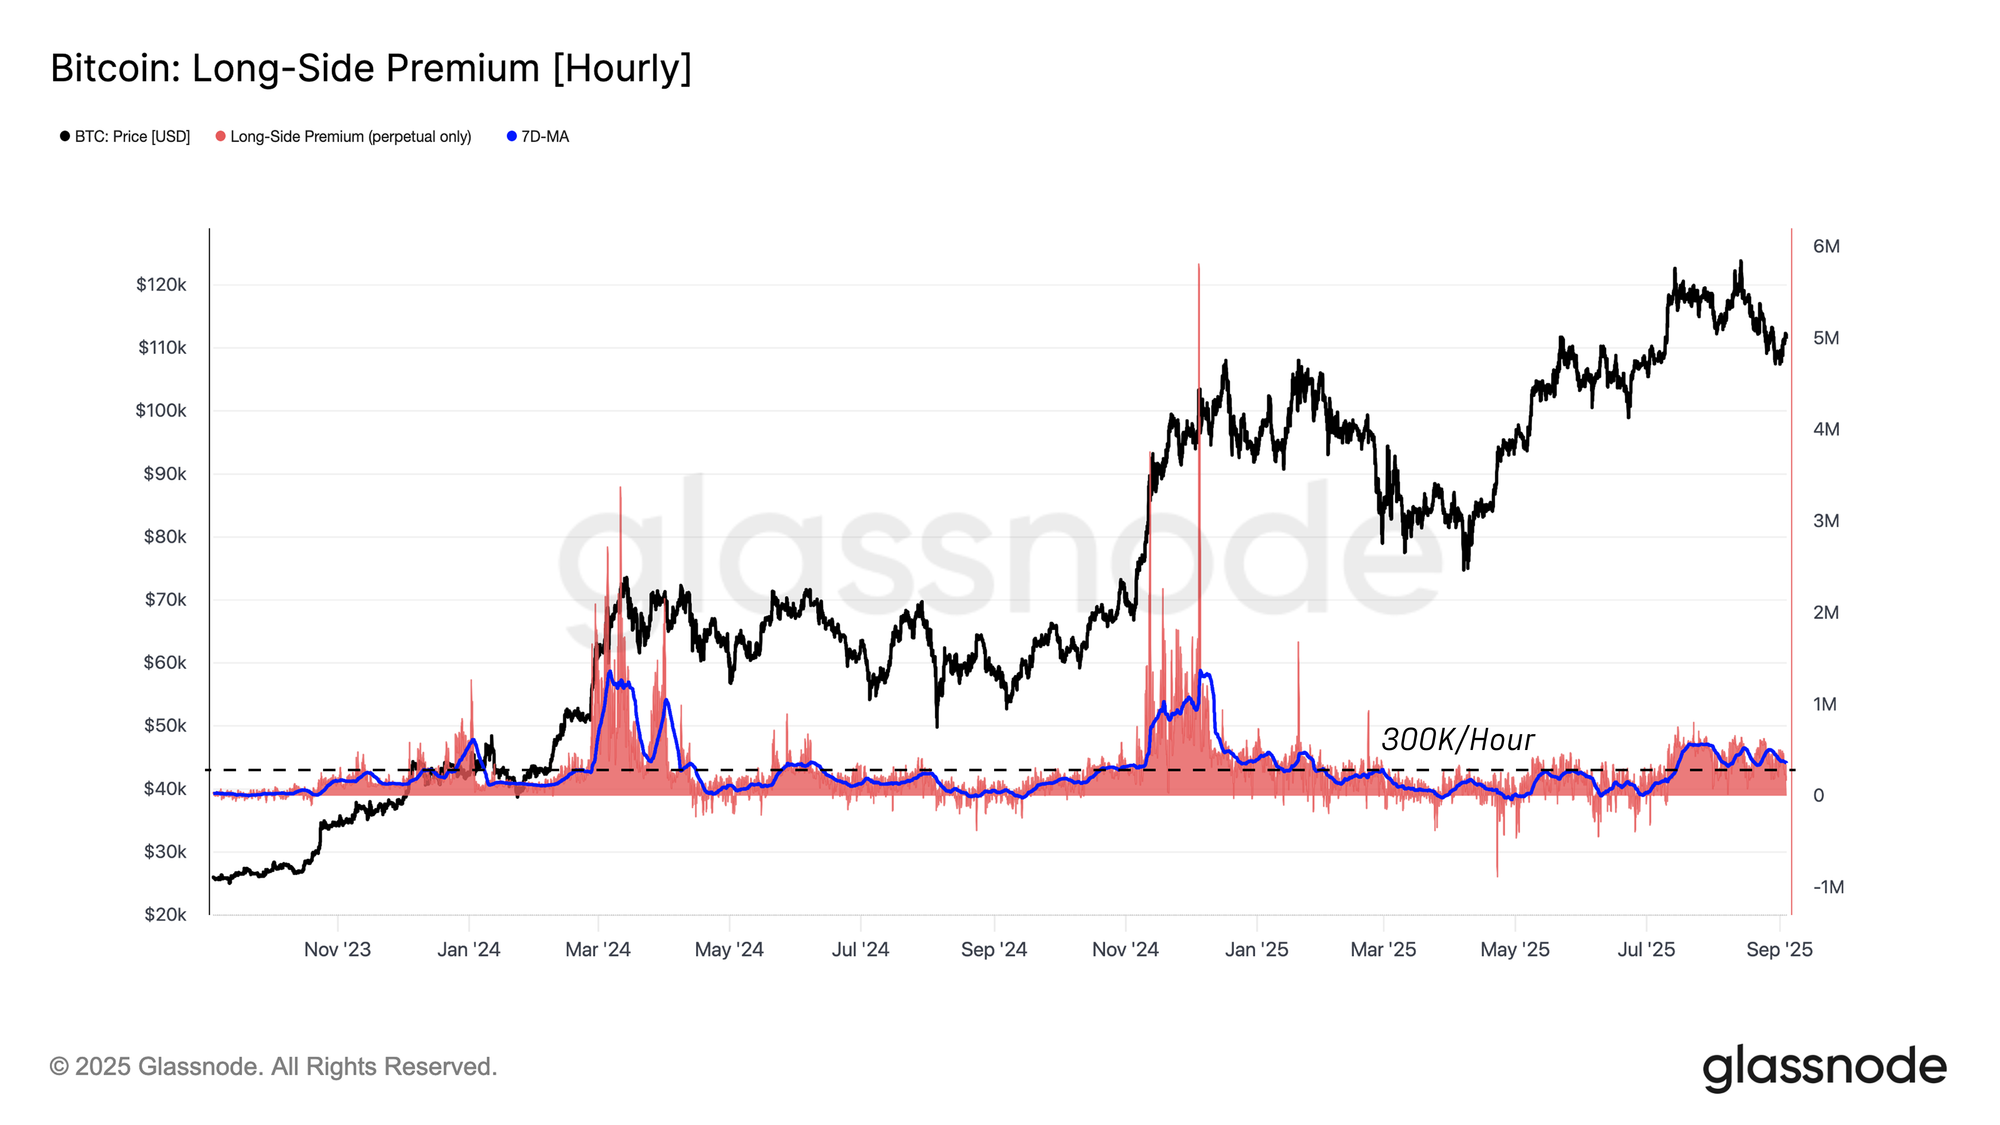
Among off-chain indicators, the futures market — particularly perpetual contracts — tends to react most sensitively to shifts in overall sentiment. Funding rates, which reflect the hourly interest longs are willing to pay to hold positions, serve as a direct gauge of speculative demand. Elevated values signal an overheated market, while a drift toward zero or negative values highlights weakening momentum.
With $300k per hour as an established baseline between bullish and bearish phases of the current cycle, and current funding sitting around $366k per hour, the market in a neutral zone: neither overheated like the >$1M per hour peaks of March and December 2024, nor cooled as in the <$300k per hour lows of Q1–Q3 2025. Should funding compress further below this threshold, it would confirm that demand is diminishing more broadly across the futures landscape.
TradFi Demand Cooling
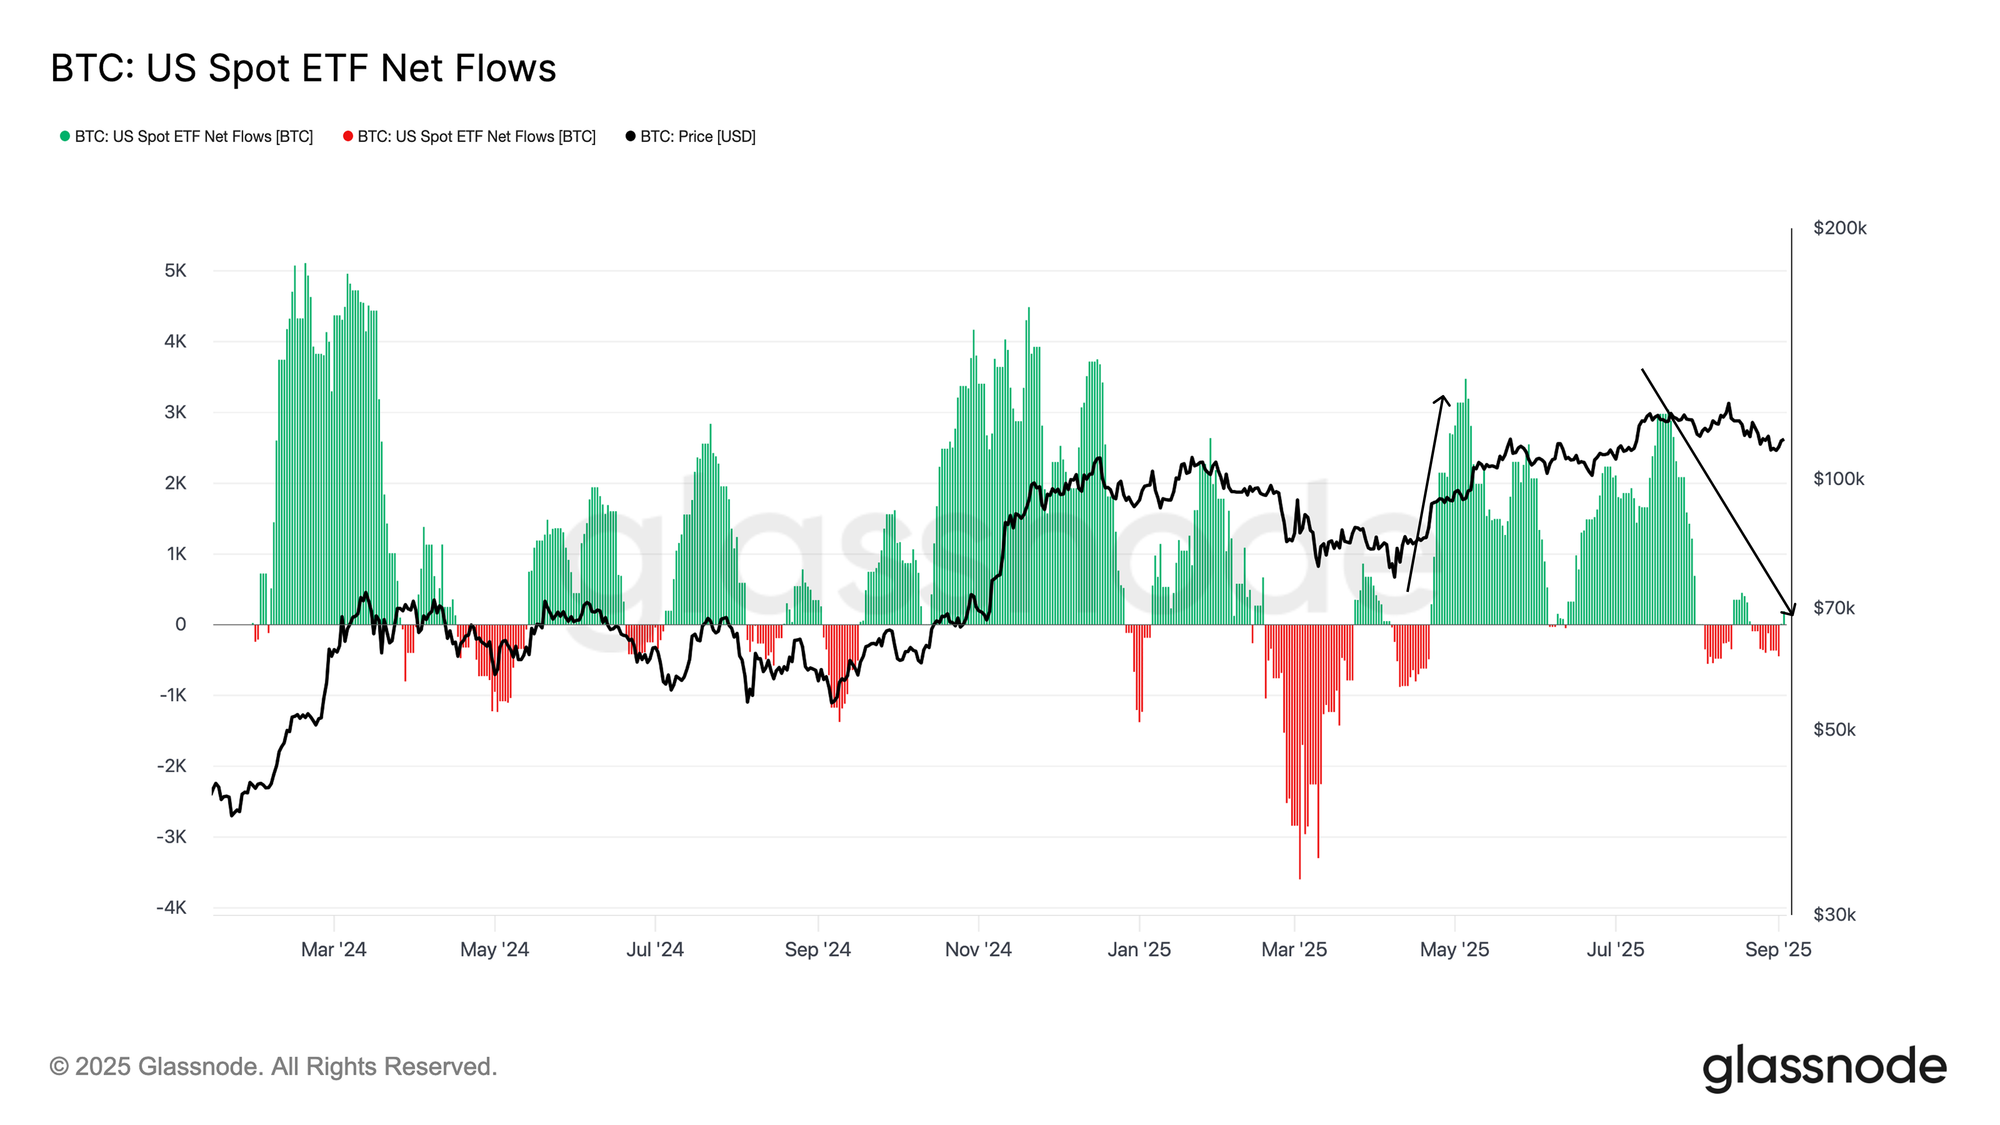
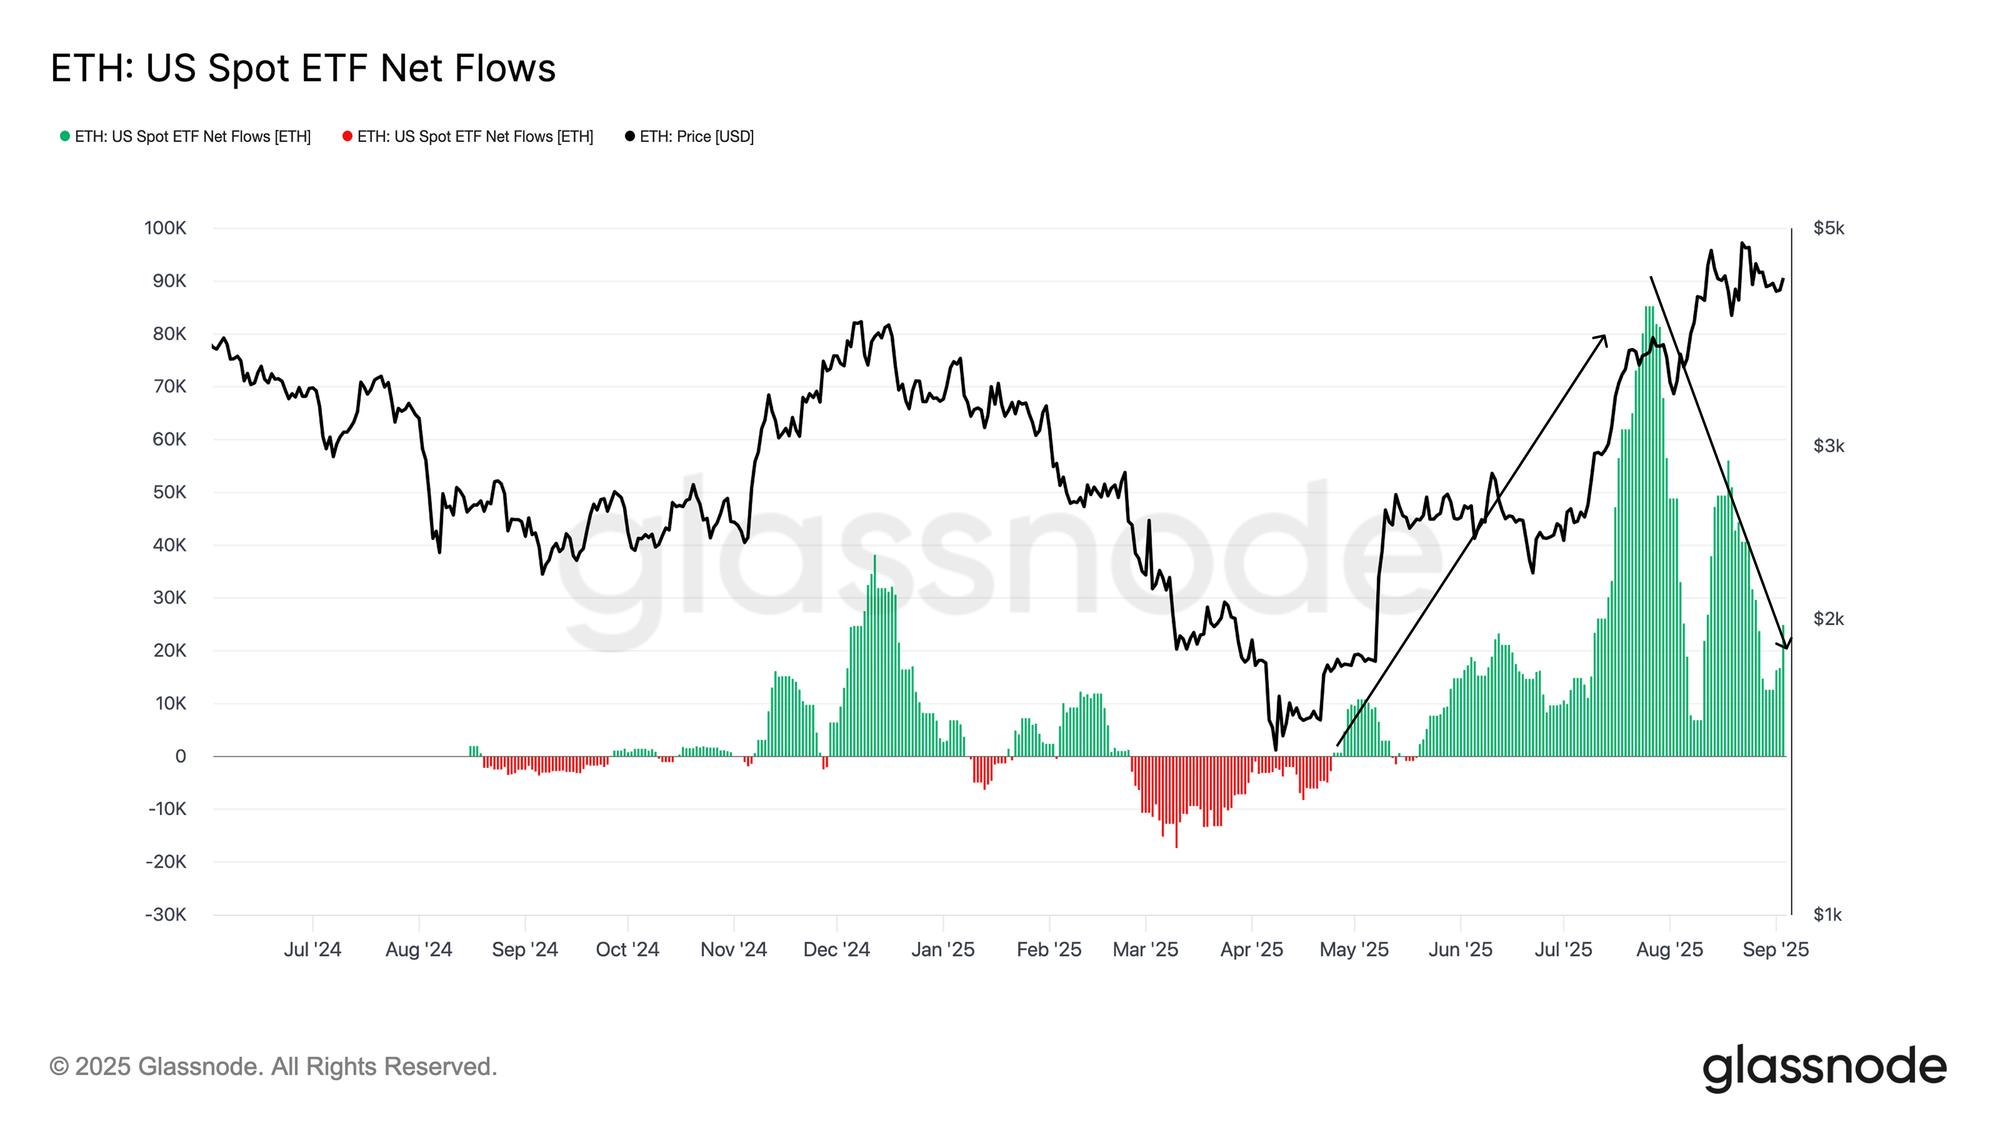
Beyond futures markets, another important lens on off-chain sentiment comes from spot ETF flows, which capture the strength of institutional demand from traditional finance. The 14-day average of net inflows highlights how a surge of 56k–85k ETH per day from May to August 2025 played a pivotal role in driving Ethereum to new highs. Over the past week, however, this pace has slowed sharply to just 16.6k ETH per day, underscoring weakening demand as prices retreated from their peaks.
Bitcoin experienced a similar trend. Inflows that had consistently exceeded 3k BTC per day since April cooled through July, with the current 14-day average now down to only 540 BTC. Taken together, both markets reflect a clear contraction in TradFi buying power, coinciding with the broader pullback in prices over recent weeks.
A Structural Difference
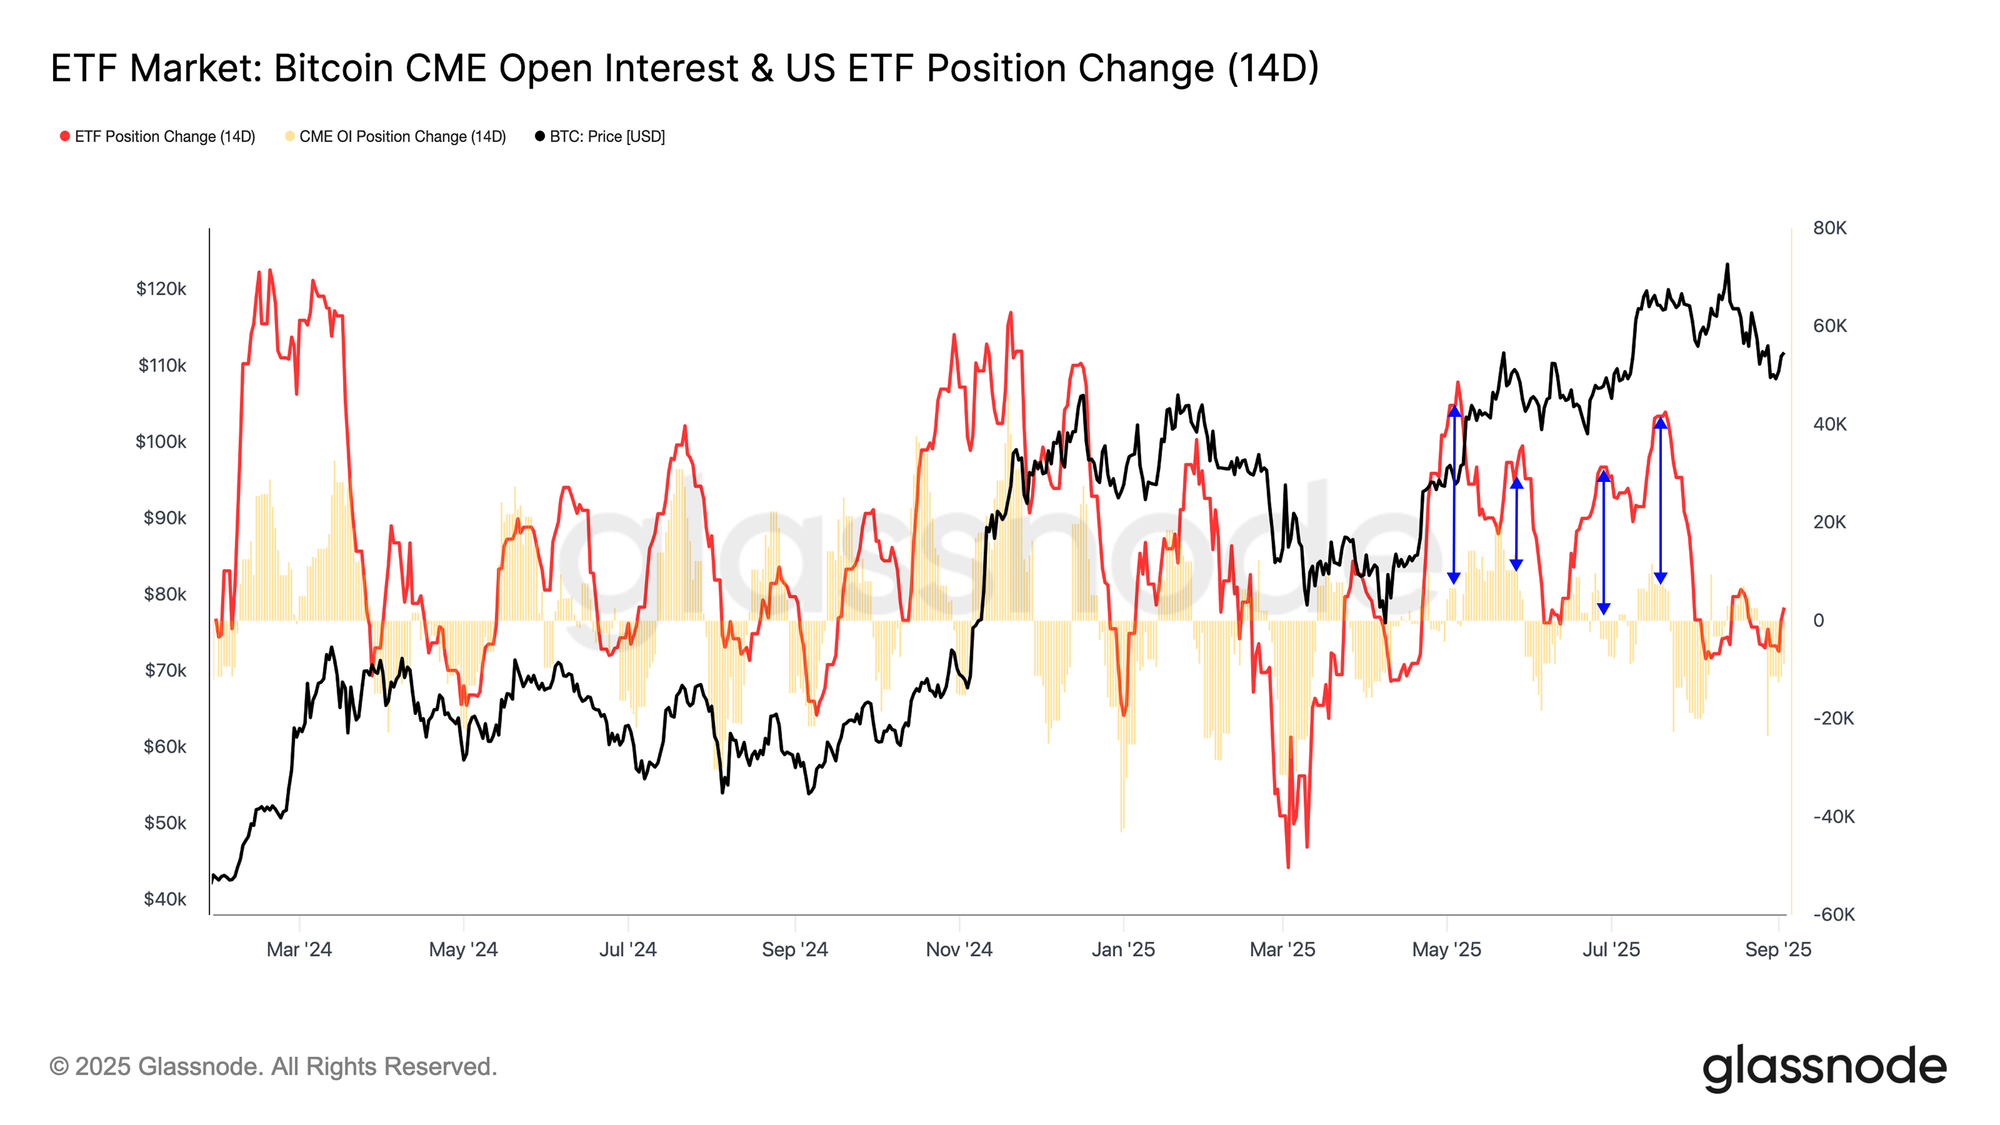
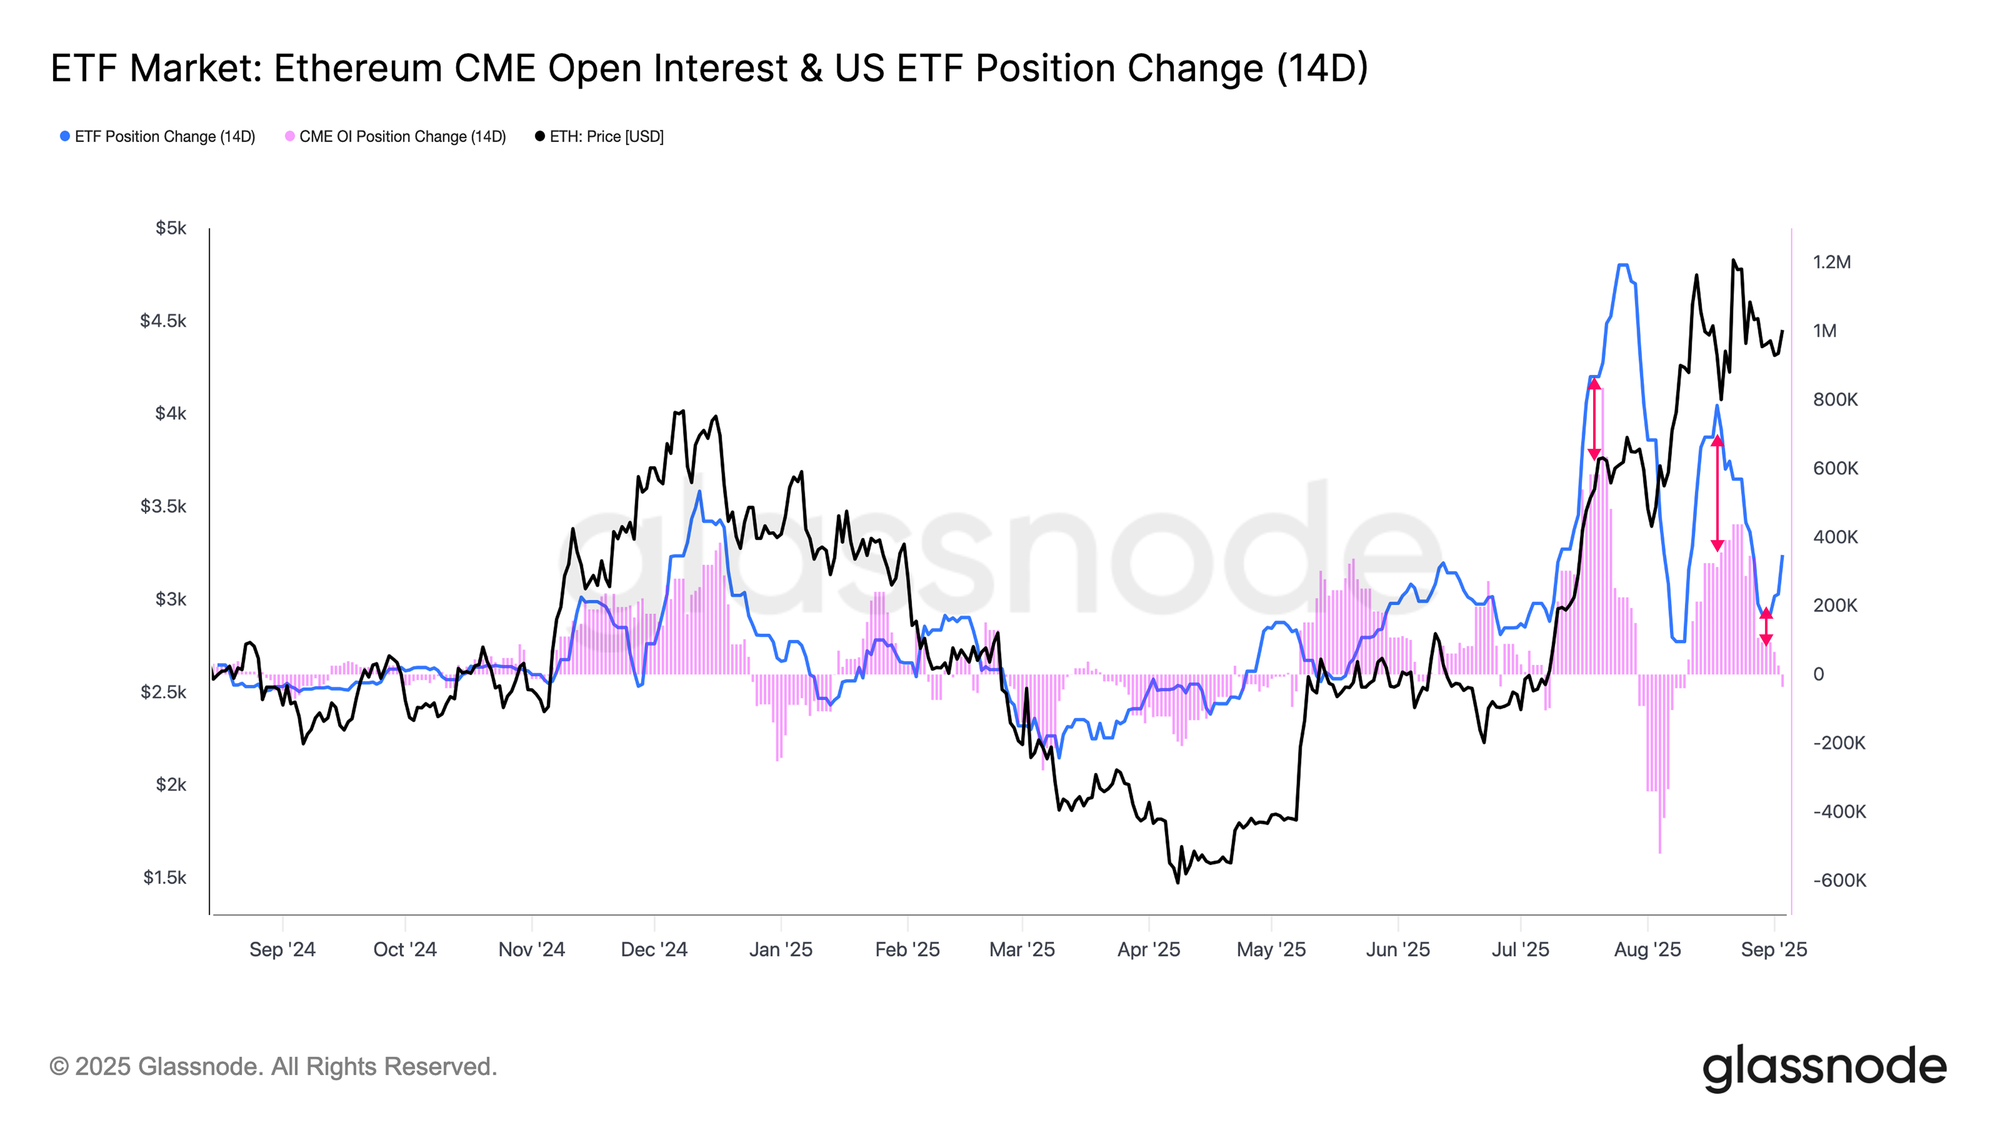
While both Bitcoin and Ethereum saw price appreciation alongside surging ETF inflows, the underlying structure of TradFi demand differed between the two. Comparing cumulative ETF flows with bi-weekly changes in CME open interest reveals these distinctions.
For Bitcoin, ETF inflows have far outweighed changes in futures positioning, indicating that TradFi investors primarily expressed directional demand through spot exposure. In contrast, Ethereum shows a more nuanced picture: bi-weekly changes in CME open interest have amounted to more than 50% of cumulative ETF inflows. This suggests that a large portion of TradFi activity in Ethereum combined spot exposure with cash-and-carry strategies, blending directional bets with neutral arbitrage.
Conclusion
Bitcoin sits near $112k, consolidating within the $104k–$116k range. On-chain signals show short-term holders remain fragile, with profitability recovering from recent lows but not yet strong enough to confirm renewed momentum. Reclaiming $114k–$116k would restore broad STH profitability and strengthen the bull case. Conversely, a breakdown below $104k risks repeating prior post-ATH exhaustion phases, with downside toward $93k–$95k.
Off-chain indicators echo this uncertainty. Futures funding is neutral but at risk of softening if demand fades, while ETF inflows that fueled earlier rallies have slowed sharply. For Bitcoin, the recent capital inflow to ETFs was majorly directional demand, while in Ethereum, it was a larger mix of cash-and-carry trades alongside spot exposure.
Disclaimer: This report does not provide any investment advice. All data is provided for informational, and educational purposes only. No investment decision shall be based on the information provided here and you are solely responsible for your own investment decisions.
Exchange balances presented are derived from Glassnode’s comprehensive database of address labels, which are amassed through both officially published exchange information and proprietary clustering algorithms. While we strive to ensure the utmost accuracy in representing exchange balances, it is important to note that these figures might not always encapsulate the entirety of an exchange’s reserves, particularly when exchanges refrain from disclosing their official addresses. We urge users to exercise caution and discretion when utilizing these metrics. Glassnode shall not be held responsible for any discrepancies or potential inaccuracies.
Please read our Transparency Notice when using exchange data.
- Join our Telegram channel.
- For on-chain metrics, dashboards, and alerts, visit Glassnode Studio.