Bitcoin Eyes $97,000-$99,000 As Key Support Zone If Price Decline Persists – Analyst

bitcoinistDipublikasikan tanggal 2025-06-01Terakhir diperbarui pada 2025-06-02

Abstrak

Bitcoin prices fell by over 3% in the past week as the broader crypto market suffers from a general price...

Trusted Editorial content, reviewed by leading industry experts and seasoned editors. Ad Disclosure

Bitcoin prices fell by over 3% in the past week as the broader crypto market suffers from a general price correction influenced by macroeconomic pressure. Notably, the premier cryptocurrency now trades above $104,000 representing an estimated 7% decline from its new all-time high at $111,970. Amidst what may yet be a mere correction, market analyst Daan Crypto has highlighted a support zone with strong potentials to halt any further price decline. 

$97,000-$99,000 Emerges As Key BTC Price Level

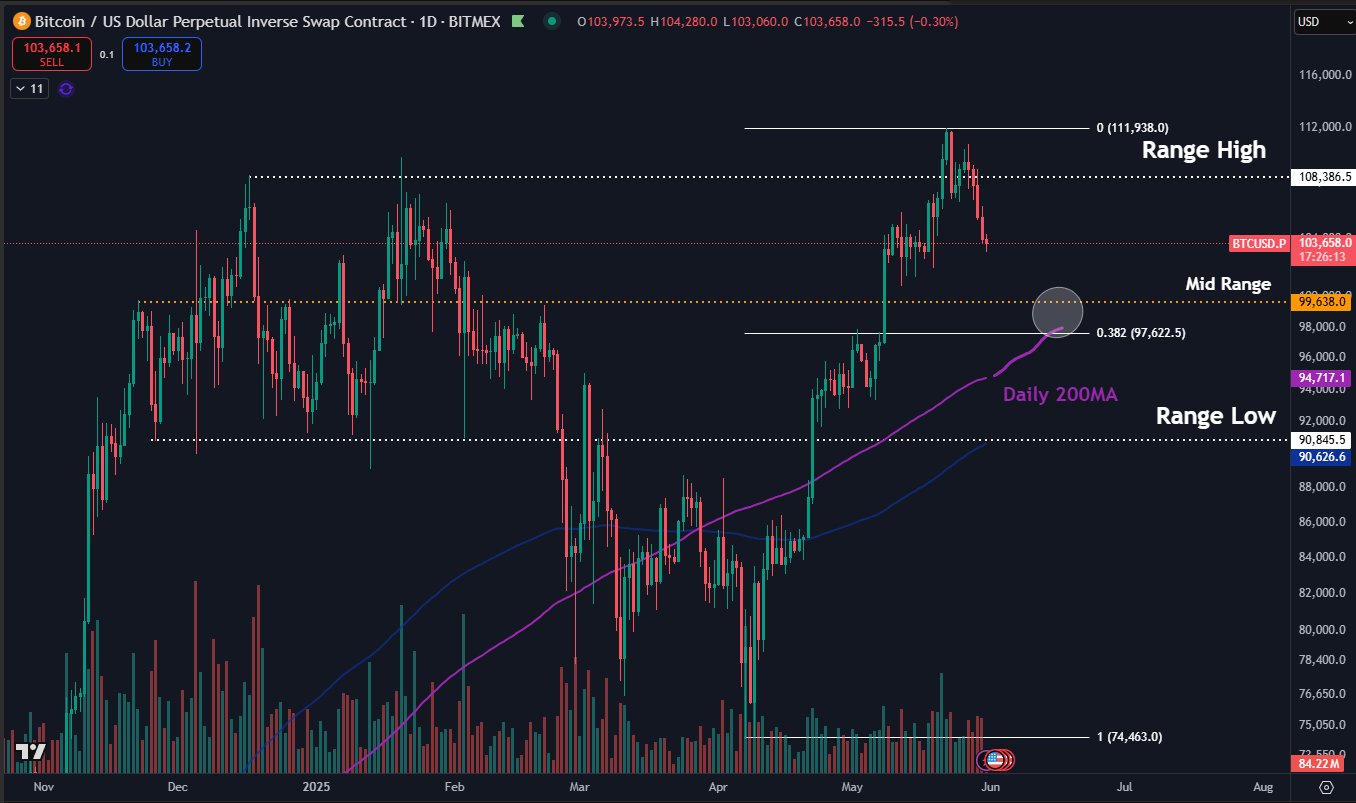
In a brief X post on May 31, Daan Crypto has shared a cautious outlook on Bitcoin amidst an ongoing price correction. The analyst notes that if the retracement persists into June, Bitcoin is likely to fall to around $97,000 -$99,000 at which it may find a credible market resistance.

Daan Crypto’s selection of this price range as the next major support level for Bitcoin stems from a confluence of technical indicators. As seen in the chart below, the $97,000-$99,000 price region represents the mid range of Bitcoin trading channel between $90,845 and $108,386, alongside hosting the 200-day moving average and the 0.382 Fibonacci retracement level.
Bitcoin
Source: @DaanCrypto on X

The mid-range in a trading channel usually serves as a key level of support or resistance, depending on where the price is relative to it. Amidst Bitcoin’s price correction, the current mid-range at $97,000-$99,000 represents the next major price floor for the premier cryptocurrency — a decisive price fall below which would signal a bearish price trend.

Meanwhile, the 0.382 Fibonacci retracement level represents a healthy market correction zone meaning prices generally pull back to this area before resuming the initial trend. In addition, the 200 day MA is a long-term indicator averaging the market closing price over the past 200 days. It also functions as a support level during bullish trends acting as a common retest level before price continues an uptrend.

Generally, all three indicators suggest the $97,000-$99,000 would act as a sound technical support zone should Bitcoin price dip any further. However, the loss of the support zone would threaten Bitcoin’s bullish potential with the next support level set around $94,000.

Bitcoin Price Overview

At press time, Bitcoin trades at $104,650 reflecting a slight price gain of 0.14% in the past day. The premier cryptocurrency also reports a monthly gain of 7.21% indicating that the majority of new market entrants remain in profits. However, the weekly decline of 2.86% suggests there is need for a resurgence in market demand to halt a creeping bearish sentiment investment.

Bitcoin
BTC trading at $104,632 on the daily chart | Source: BTCUSDT chart on Tradingview.com
Featured image from Pexels, chart from Tradingview
Editorial Process for bitcoinist is centered on delivering thoroughly researched, accurate, and unbiased content. We uphold strict sourcing standards, and each page undergoes diligent review by our team of top technology experts and seasoned editors. This process ensures the integrity, relevance, and value of our content for our readers.

Semilore Faleti works as a crypto-journalist at Bitconist, providing the latest updates on blockchain developments, crypto regulations, and the DeFi ecosystem. He is a strong crypto enthusiast passionate about covering the growing footprint of blockchain technology in the financial world.

Bacaan Terkait

Setelah Aave Pergi dan TVL Berguncang Hebat, Di Mana Anchor Valuasi MegaETH Berada?

Berdasarkan data DefiLlama, TVL MegaETH mengalami fluktuasi tajam pada 9-10 Juli, turun sekitar 60% dalam 24 jam menjadi sedikit di atas $30 juta, turun sekitar 70% dari puncaknya pada Mei. Protokol teratas Aave V3 menarik sekitar 80% likuiditas. Harga MEGA turun ke sekitar $0.048, dengan kapitalisasi pasar sekitar $54 juta dan FDV sekitar $480 juta. Artikel ini menganalisis tiga ketidaksesuaian dalam valuasi MegaETH: 1. **Ketidaksesuaian valuasi dengan penggunaan nyata**: FDV $4.7 miliar tidak didukung oleh aktivitas ekonomi riil. Pendapatan protokol 30 hari kurang dari $900k dengan hanya 2.619 alamat aktif harian. Sekitar 88.7% token belum beredar, berpotensi menciptakan tekanan jual di masa depan. 2. **Ketidaksesuaian narasi token dengan kualitas ekosistem**: Meski dinarasikan sebagai blockchain DeFi berkinerja tinggi, sebagian besar pendapatannya justru berasal dari game kartu Monster (sekitar 80%). Aave hanya menyumbang sekitar $90k. Volume perdagangan DEX dan kontrak berlanjut rendah, dan stablecoin native USDM terus menyusut. 3. **Ketidaksesuaian ekspektasi jangka pendek dengan realisasi jangka panjang**: TVL awal didorong oleh insentif dan strategi arbitrase siklus (seperti yang melibatkan USDe), bukan kebutuhan riil yang stabil. Integrasi protokol besar seperti Uniswap dan Aave tidak mempertahankan TVL. Penurunan serupa terlihat pada Monad (MON), menunjukkan pasar mulai meminta dukungan nilai yang lebih jelas daripada sekadar TVL dan narasi. Kesimpulannya, setelah insentif dan modal arbitrase keluar, MegaETH kekurangan pijakan nilai yang solid antara valuasi saat ini dan fundamental on-chain-nya. Pemulihan berkelanjutan bergantung pada kemampuan tim untuk mengubah likuiditas jangka pendek menjadi penggunaan nyata dan mewujudkan hasil ekosistem yang konkret. Tanpa itu, selain pemulihan jangka pendek dari sentimen pasar, sulit menemukan alasan kuat untuk valuasi yang stabil.

链捕手6j yang lalu

Setelah Aave Pergi dan TVL Berguncang Hebat, Di Mana Anchor Valuasi MegaETH Berada?

链捕手6j yang lalu

Trading

Spot
活动图片