
crypto Anmool
01/26 10:40
Solana Price Could Plunge 20% As Ethereum Stabil
Solana Price Could Plunge 20%
As Ethereum Stabilizes Above Key Support
Solana price has retraced 14% from its recent high of $295, touching $255 on Saturday. Key market indicators suggest that SOL could see further declines as Ethereum gradually recovers following Vitalik Buterin’s announcement that the team intends to stop selling ETH.
Ethereum (ETH) has stabilized above the $3,100-3,300 support zone as SOL has recently struggled to maintain momentum amid increased selling pressure. This contrasting price action highlights the growing divergence between the two major layer-one competitors as Ethereum appears poised to regain market dominance.
Solana Price Weakens as Ethereum Stabilizes
Solana (SOL) continues to exhibit bearish price action as Ethereum’s (ETH) stability amid volatile market trends suggests that traders are selectively riding the market.
Analyzing the Ethereum price prediction chart, ETH price is consolidating above a critical support zone between $3,050 and $3,208.
This support is reinforced by the 200-day moving average (MA), a key technical indicator for measuring long-term trends.
According to the TradingView chart above, ETH’s relative strength index (RSI) is hovering around 47.57, indicating neutral momentum and accumulation potential. Meanwhile, the MACD histogram shows a mild bearish divergence but suggests weakening downside pressure as the recent bars narrow towards the zero line.
These factors suggest that ETH price is stabilizing, creating a subdued environment for related altcoins such as Solana.
In contrast, SOL lacks strong institutional interest in Ethereum’s support zone.
As ETH finds buyers around its 200-day MA and key levels, SOL’s price weakness could signal a flight to safety for large-cap assets. If Ethereum continues to consolidate above $3,200, it could impose indirect resistance on SOL, limiting its ability to recover in the near term. Solana bulls must recapture the lost support zone to shift sentiment towards the next bullish phase.
Solana Price Prediction: SOL to Plunge 20% as Selling Pressure Intensifies
Looking at the recent Solana price prediction, the current market dynamics suggest a bearish outlook, with a 20% drop likely as selling pressure intensifies.
As shown in the chart below, SOL price recently broke through key support levels including the 50-day simple moving average (SMA) at $232.51 and the 200-day SMA at $168.88, indicating weakening demand.
The swing failure pattern (SFP) due to excessive selling further confirmed the bearish sentiment as buyers failed to sustain the upward momentum, leading to a price crash.
The price is currently testing the range midpoint at $232.51, which now acts as a resistance level.
The relative strength index (RSI) and other momentum indicators may be in oversold territory, but a rebound seems unlikely without significant buying interest. The demand area is around $168.88, which coincides with the 200-day SMA and is the next key support level. If this level fails to hold, SOL prices could quickly fall to $169.00, consistent with the 20% drop forecast.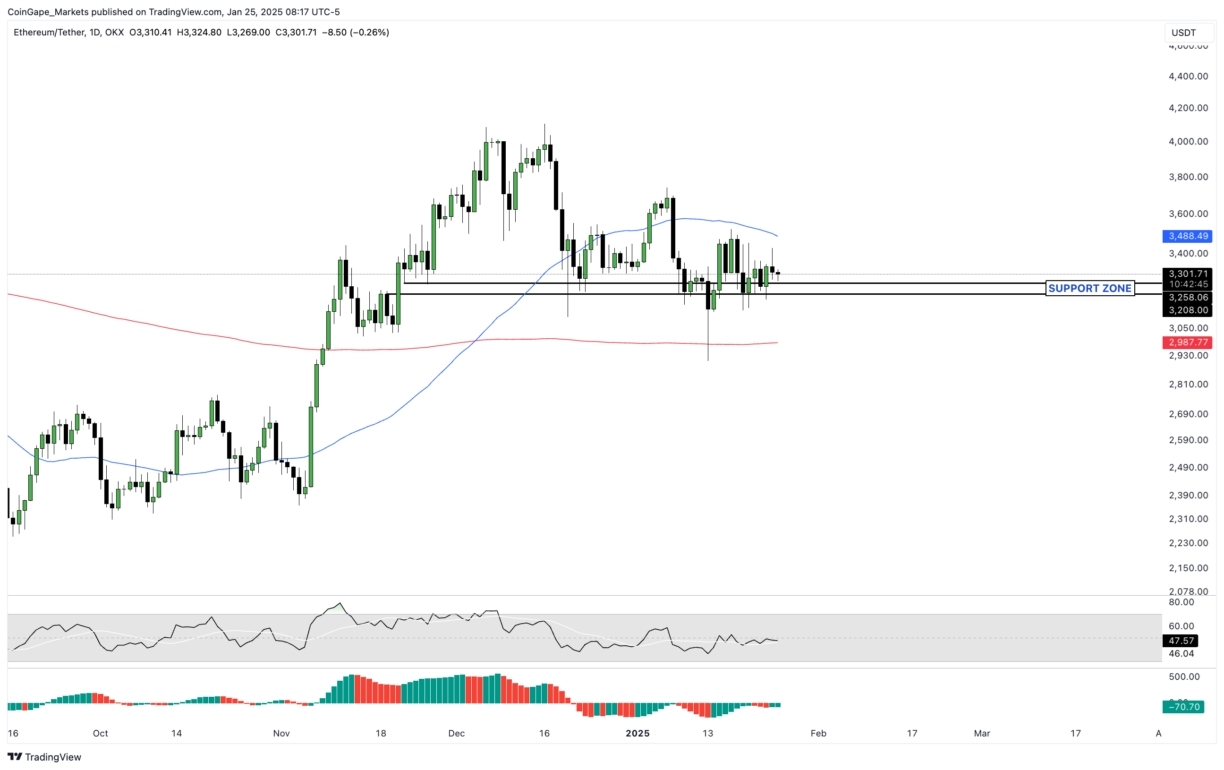
#Share Your Thoughts on Popular Assets in March#Tariffs Crash Crypto#BTC price hits a new high of $120,000! #Santa Claus Rally#The Federal Reserve announced a rate cut
1Bagikan
Semua Komentar0TerkiniHangat