Joao Wedson
06/23 14:19
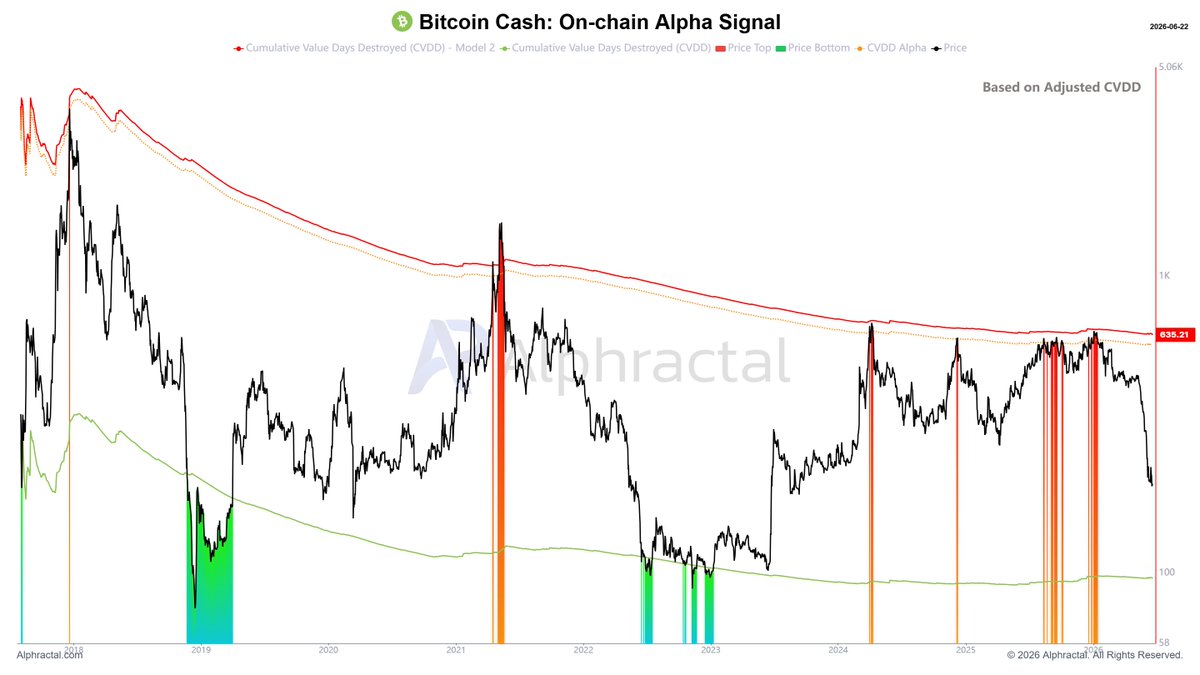
This shows the true power of Alphractal’s calibrated metrics and tools, such as the Workbench.
The most interesting part is that, even with this impressive track record, I would not be surprised if BCH still falls further.
Right now, the bottom signal from this model would only appear below $100, which means there is still a possible downside of nearly 50% from here.
Will this actually happen? Nobody knows, and I cannot tell you that it will, because no market ever gives certainty.
But one thing is clear: if this drop happens, the region below $100 has a high probability of marking the bottom of this Bitcoin Cash bear cycle.
This is exactly what we are building at Alphractal:
Turning complex data into objective signals that help identify top and bottom zones with much more clarity.
Data comes first. Narratives come later.
#HTXCommunity4thAnniversary
10Bagikan
Semua Komentar0TerkiniHangat