Mareena
07/16 16:10
Calculated timing, measured flows Zoom in on TRUM
Calculated timing, measured flows
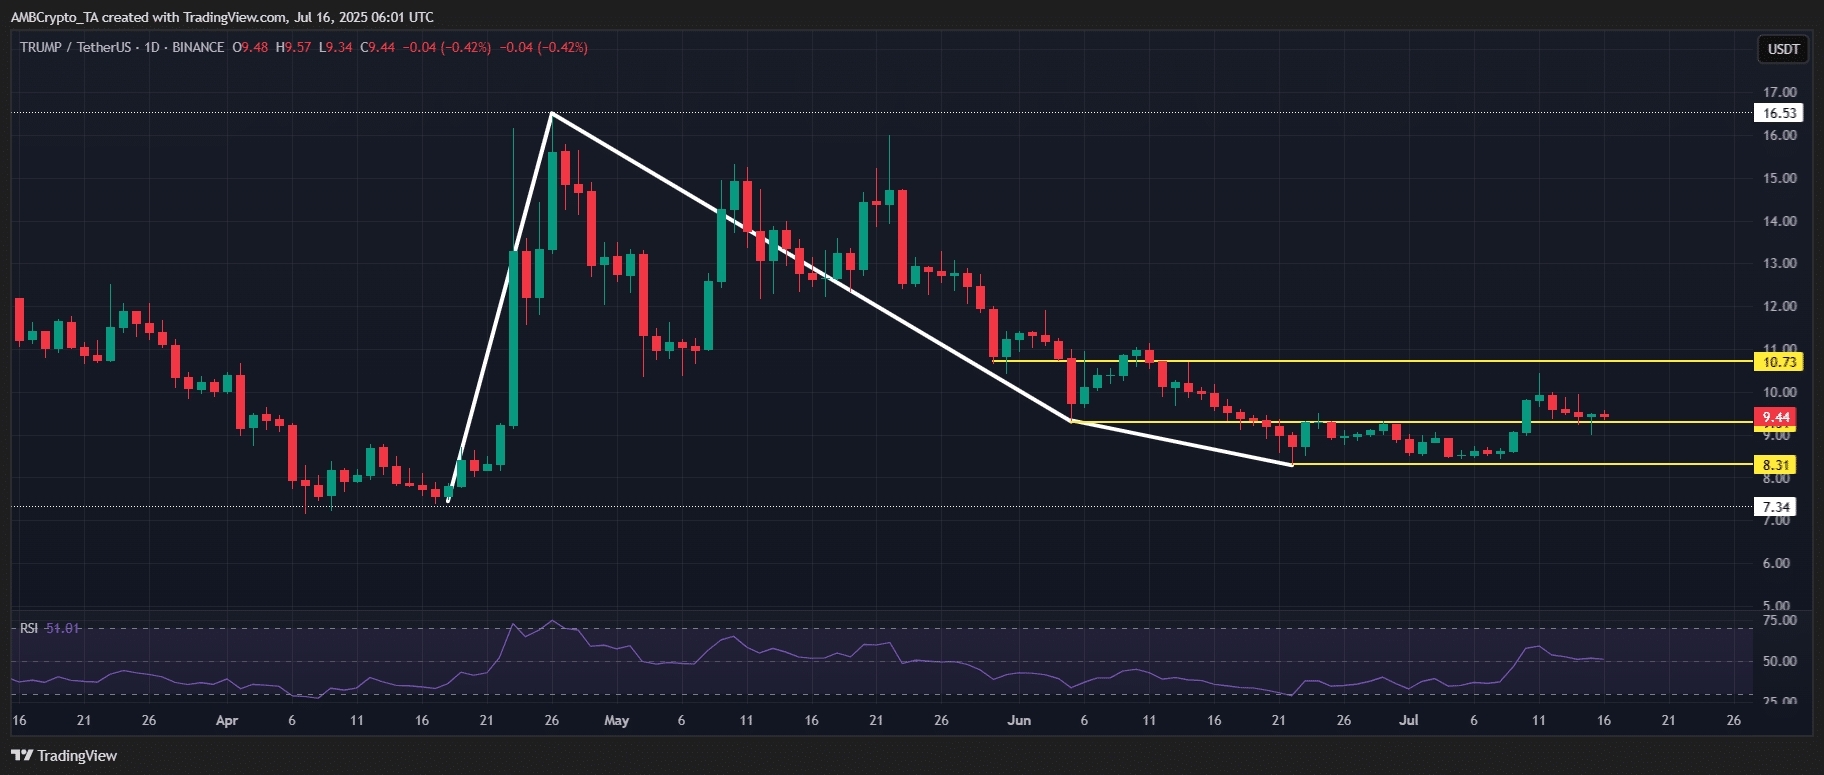
Zoom in on TRUMP’s daily chart, and mid-April stands out like a rocket launch. The token bounced from its Q1 bottom at $7 and ripped nearly 80% in a week, closing at $16.44, marking its strongest move in months.
Since then, though, it’s been a slow bleed. Three lower lows, no clean support flips, reinforcing a classic bearish structure.
But zoom in closer, and things get interesting.
That same 80% rally? It happened right as 40 million tokens were unlocked on the 18th of April.
Instead of a dump, TRUMP pumped, logging a 7.96% daily gain the next day, registering its biggest candle that month.
#Check In to Win a 20g Gold Bar#BTC price hits a new high of $120,000! #HTX 12th-Anniversary Carnival#Do you think DELOREAN is promising?#Do you think ANIME is promising?
1Bagikan
Semua Komentar0TerkiniHangat