
Golo
02/08 10:51
Technical analysis and XRP price target
Technical analysis and XRP price target
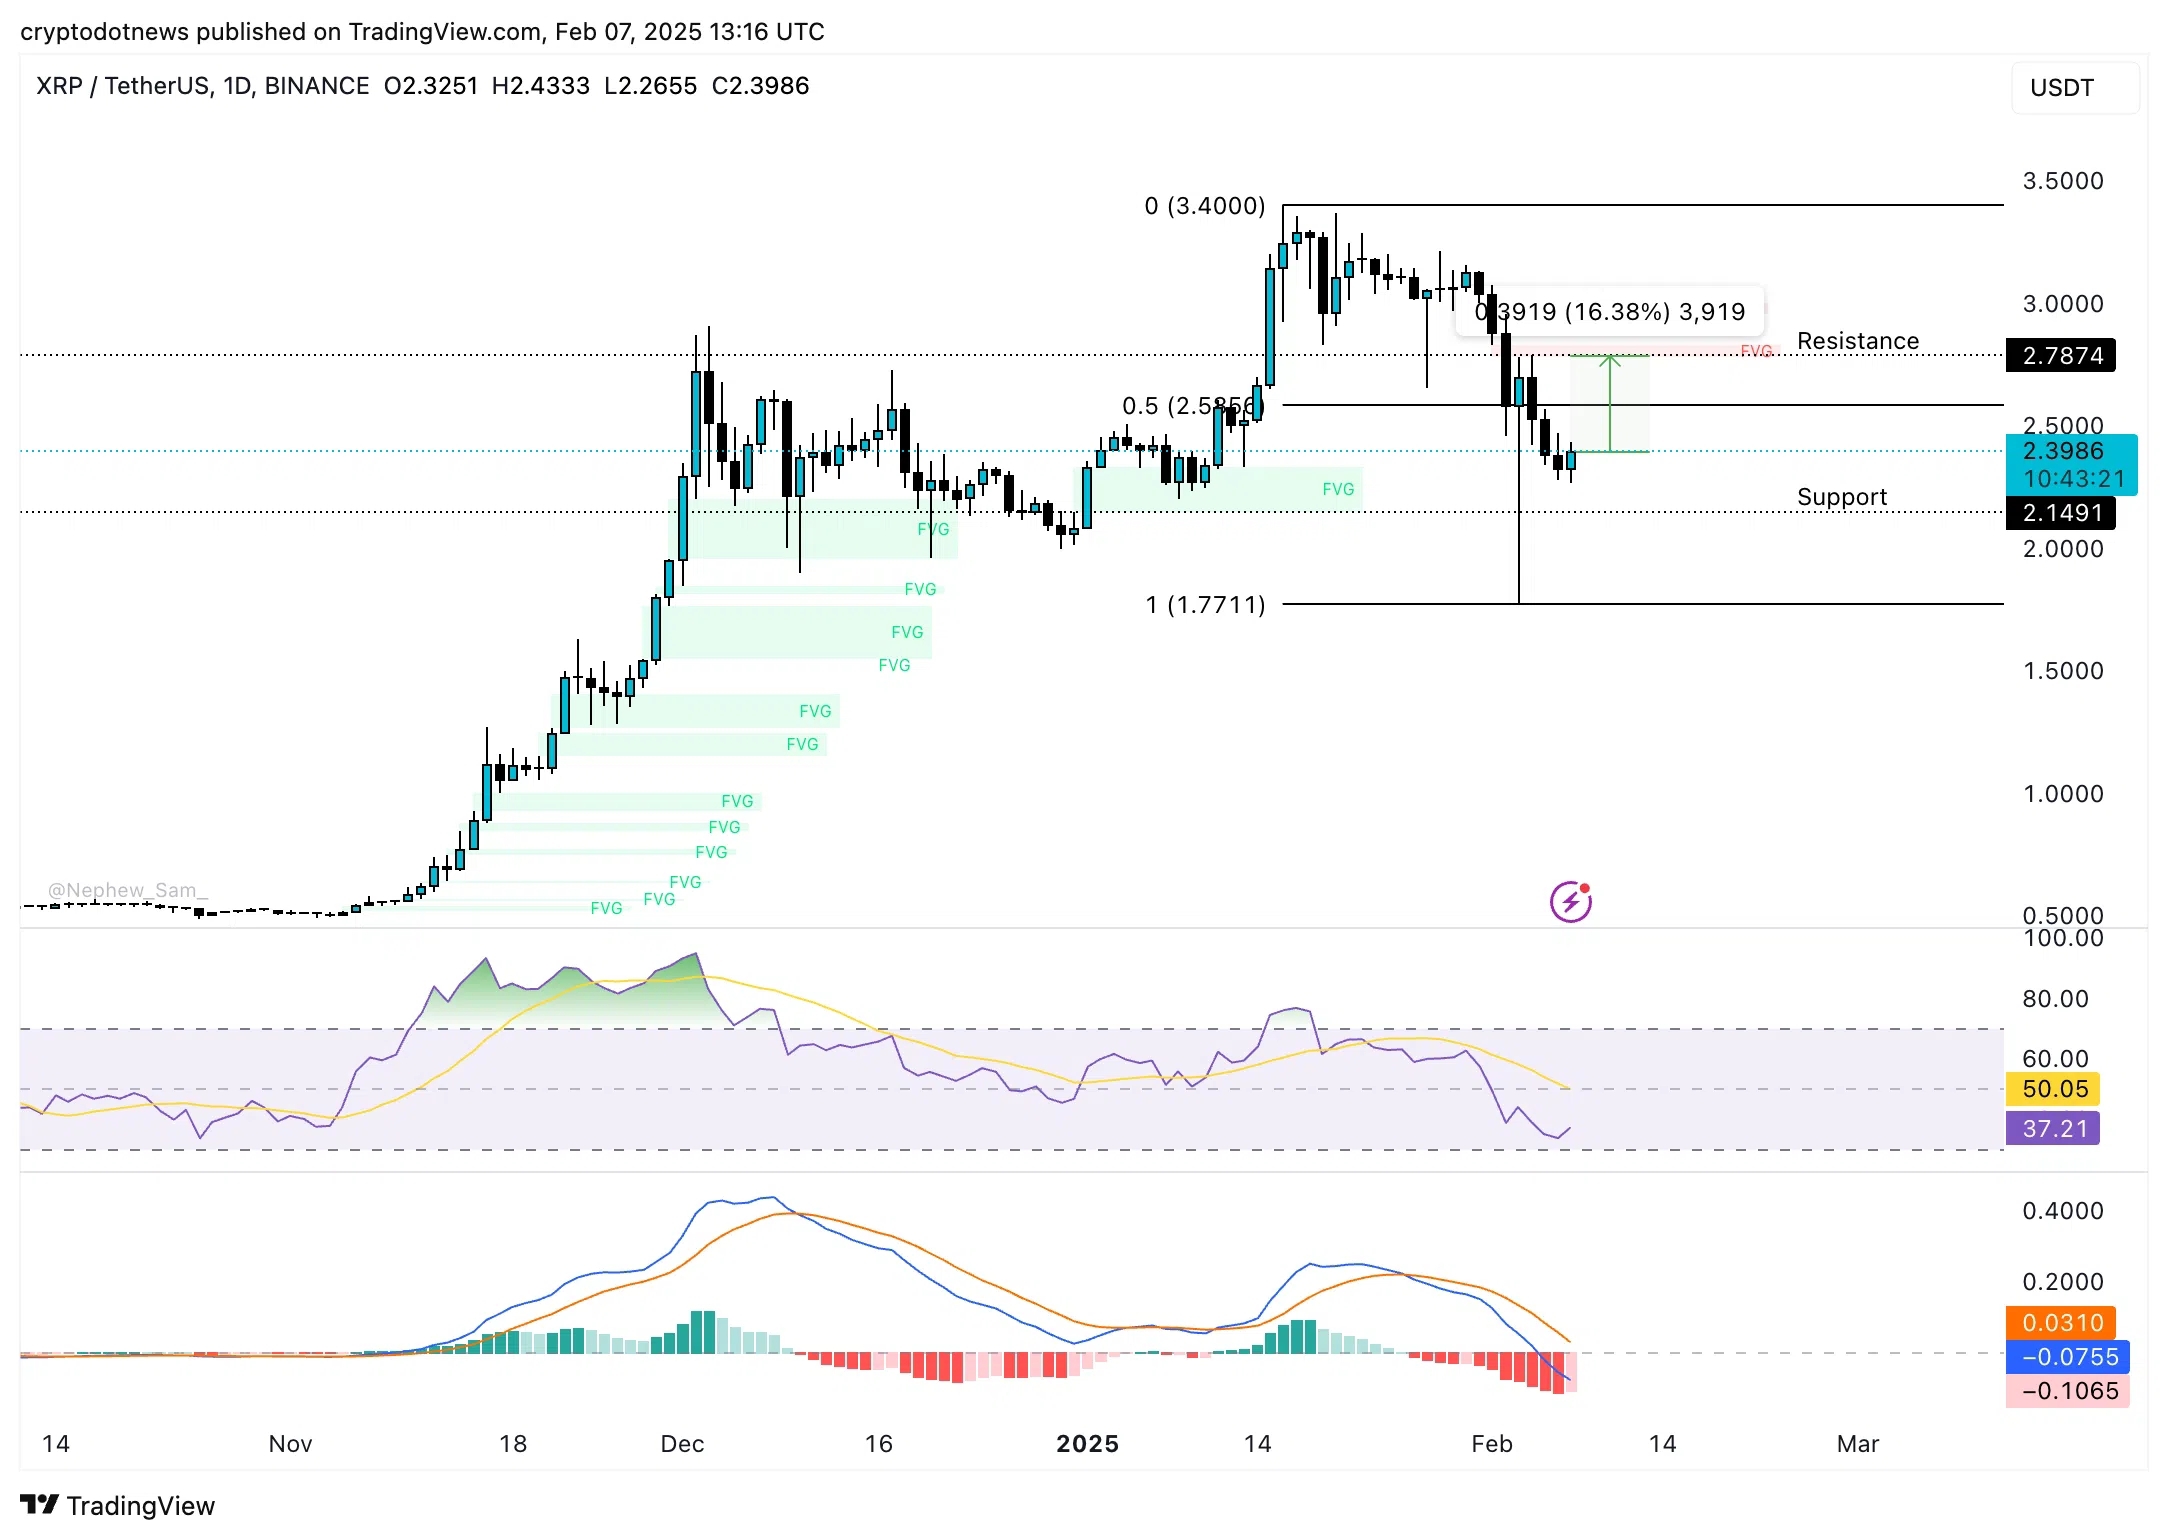
XRP started its downward trend on January 16. The altcoin trades at $2.3986 at the time of writing. Technical indicator on the daily timeframe, RSI points at a bullish thesis for XRP. RSI reads 37 and is sloping upwards.
MACD on the XRP/USDT price chart shows an underlying negative momentum in XRP price trend, however the red histogram bars have reduced intensity and are shorter, meaning traders need to keep eyes peeled for a reversal.
XRP could face resistance at the lower boundary of the Fair Value Gap (FVG) between $2.7874 and $2.8281. This marks a 16% rally in XRP price. The altcoin could find support at $2.1491, the December 31 high for XRP.
#Grab $100,000 Surprise Gifts#Share Your Thoughts on Popular Assets in March#BTC price hits a new high of $120,000! #Santa Claus Rally#The Federal Reserve announced a rate cut
SukaBagikan
Semua Komentar0TerkiniHangat