Range Judgment Realized, Strategy Fully Executed | Guest Analysis

marsbitPublié le 2026-01-09Dernière mise à jour le 2026-01-09

Résumé

In his weekly analysis, Cody Feng, a quantitative trading expert, reviews Bitcoin's price action from January 5 to 11. BTC movement aligned closely with his initial forecast, trading within a range of $84,000 to $94,500. The price faced strong resistance at the $93,000–$94,500 zone and later pulled back toward the mid-to-lower part of the range. A short position was executed near $94,000 based on signals from momentum and spread trading models, and the trade was closed around $90,584, capturing a profit of approximately 3.4%. The strategy emphasized pre-planned execution and disciplined risk management. Currently, Bitcoin has found support around $86,500, with technical indicators suggesting oversold conditions and a potential bounce. However, the overall structure remains a broad consolidation. A rebound toward $92,000–$93,000 is anticipated, where renewed selling pressure may emerge. A break above $94,500 would require a reassessment of the market outlook. Feng concludes that in a ranging market, executing well-defined strategies with strict risk controls is more critical than predicting directional moves.

Odaily guest market analyst Cody Feng, Master of Financial Statistics from Columbia University, has focused on quantitative trading of US stocks since college and gradually expanded to digital assets such as Bitcoin. He has built a systematic quantitative trading model and risk control system through practical experience; possesses keen data insight into market fluctuations, and is committed to continuous growth in the professional trading field, pursuing stable returns. He will delve into BTC technical, macroeconomic, and capital flow changes weekly, review and showcase practical strategies, and preview noteworthy upcoming developments for reference.

Bitcoin Mid-Week Review(01.05~01.11)

Conclusion First:

This week, Bitcoin's overall price action largely operated within the 84,000~94,500 USD oscillation range we provided at the beginning of the week. The price precisely encountered resistance in the 93,000~94,500 USD pressure zone and subsequently fell back to the middle-lower part of the range. Our core level judgments were verified by actual market performance.

In this trade, we established short positions near 94,000 USD and exited all positions near 91,000 USD, capturing approximately 3.4% profit (spot) from the range, completing a high-probability, low-drawdown profit realization in a ranging market.

I. Validation of This Week's Core Range and Key Levels

At the beginning of the week, we clearly stated that this week required close attention to the battle between bulls and bears at the upper and lower boundaries of the 84,000~94,500 USD range.

The actual movement showed that Bitcoin clearly met resistance after rebounding to the 93,000~94,500 USD pressure zone, with multiple failed attempts to break higher, subsequently leading to a pullback under pressure, validating the effectiveness of this area as a阶段性 "ceiling".

Regarding support levels, the price showed clear signs of stopping declines and stabilizing after falling to the 86,000~86,500 USD area, where buying interest began to emerge. The more critical support level at 84,000 USD has not been touched yet, and the overall structure remains within the wide-range oscillation framework.

II. Execution of Plan A (From Entry to Exit)

Based on the range oscillation judgment, our Plan A formulated at the start of the week was effectively executed.

When the price rebounded to the 93,000~94,500 USD zone showing signs of upward exhaustion, and both the (momentum, spread trading) models simultaneously issued top signals, we immediately established short positions at 93,771 USD. The market subsequently declined as expected.

When the "Spread Trading" model issued a bottom signal, we finally exited all positions at 90,584 USD, completing a full, emotion-free short trade. The entire trading process was not "hindsight analysis" but involved pre-planning, in-execution, and post-verification.

III. Operational Thoughts for the Latter Half of the Week

Bitcoin 4-Hour Chart: (Momentum Quantitative Model + Spread Trading Model)
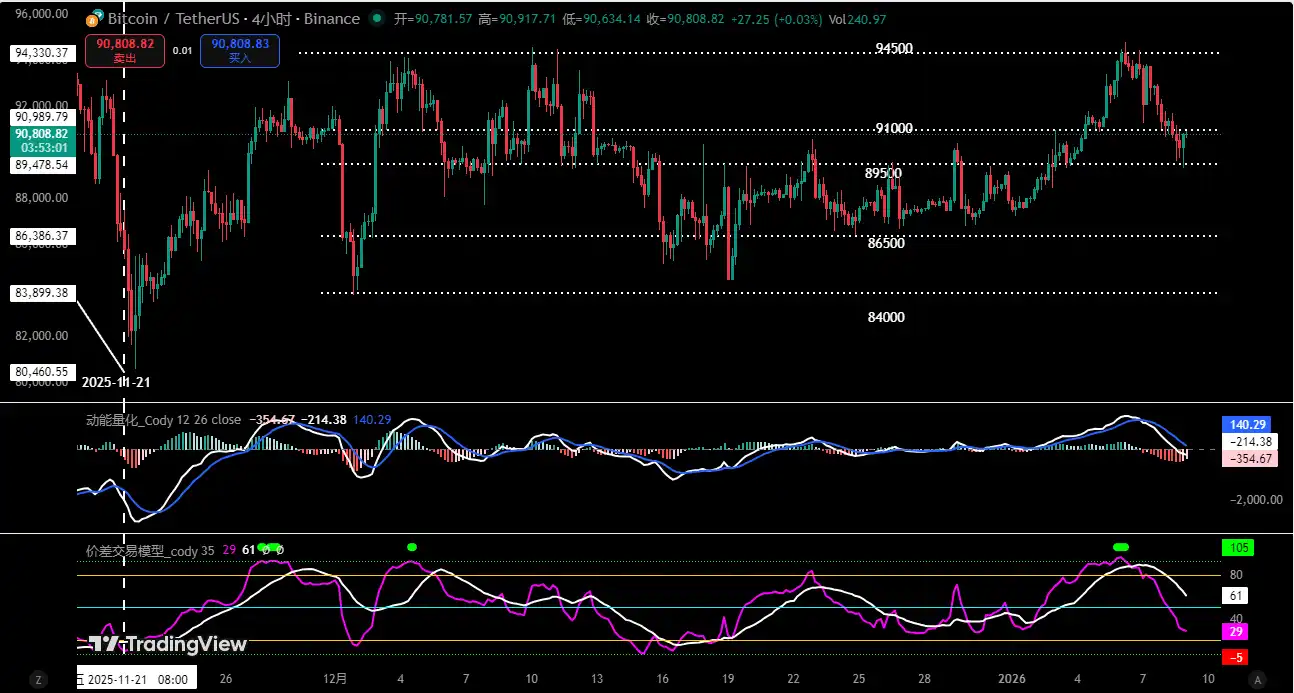
From the 4-hour technical structure (see chart above), Bitcoin has currently found effective support near 86,500 USD. Multiple technical indicators have entered oversold territory, indicating short-term selling pressure has been released. The market has a demand for a technical rebound correction (oscillatory rebound), but this is not yet sufficient to confirm a reversal of the downtrend.

Based on this, we anticipate the price may first rebound to test the 92,000~93,000 USD area. This level also coincides with the middle-upper part of the previous oscillation range and is expected to form resistance again.

For short-term operations, maintain a range-trading mindset: if the price reaches this zone and shows signs of momentum exhaustion or failed breakouts, consider building short positions on rallies; if it effectively breaks above 94,500 USD, stop loss decisively and reassess the market structure.

IV. Summary

Overall, Bitcoin continues to operate within the wide-range oscillation pattern defined at the beginning of the week: lower support provides room for rebounds, while upper resistance limits the upside. At present, rather than betting on a unilateral trend, it is more important to respect the range structure, focus on high-probability levels, and maintain strict risk control.

In ranging markets, formulating flexible response strategies and achieving stable profits is far more important than predicting direction.

Disclaimer: The above content is solely personal market opinion sharing and does not constitute any investment advice. Cryptocurrencies are highly volatile; please make independent judgments and strictly control risks.


Questions liées

QWhat was the price range for Bitcoin's consolidation as predicted by analyst Cody Feng at the beginning of the week?

AThe predicted consolidation range for Bitcoin was between $84,000 and $94,500.

QAt what price level did the analyst establish a short position and what was the profit from this trade?

AA short position was established near $94,000 and closed near $91,000, capturing a profit of approximately 3.4%.

QWhat are the two technical models mentioned that provided signals for the trade execution?

AThe two technical models mentioned are the Momentum Quant Model and the Spread Trading Model.

QAccording to the 4-hour chart analysis, what is the expected next move for Bitcoin's price and the key resistance area to watch?

AA technical rebound or震荡反弹 (oscillatory rebound) is expected to test the $92,000 to $93,000 area.

QWhat is the overarching trading philosophy emphasized for the current market conditions described in the article?

AThe philosophy is to focus on high-probability price points and strict risk control within the range-bound structure, rather than betting on a one-directional trend, as formulating flexible strategies for stable profits is more important than predicting direction.

Lectures associées

Le Bitcoin a-t-il touché le fond, ou une 'secousse' se prépare-t-elle ? Quelle est la situation du XRP ?

La plateforme d'analyse cryptographique Santiment a publié une analyse des marchés du Bitcoin et des altcoins, basée sur les tendances du marché et les données on-chain. L'indicateur 365-jours MVRV du Bitcoin est tombé à -26%, signalant des pertes importantes pour les investisseurs à long terme. Historiquement, de tels niveaux négatifs profonds ont correspondu à la formation de creux de marché et à des opportunités d'achat à long terme. Le MVRV sur 30 jours est neutre (+1.1%), indiquant une absence de signal directionnel clair à court terme. Les données montrent une divergence de comportement : les grands portefeuilles (10 à 10 000 BTC) ont continué à accumuler, ajoutant environ 18 500 BTC en 10 jours. À l'inverse, la forte demande des petits investisseurs individuels pourrait créer un risque de "shakeout" ou correction finale du marché. La situation des altcoins est mitigée. L'Ethereum présente un risque de correction à court terme malgré son MVRV négatif, en raison d'un optimisme excessif sur les réseaux sociaux. Le XRP, en revanche, est en territoire de survente avec des MVRV très négatifs (-57.5% sur 30 jours, -45.5% sur 365 jours), ce qui pourrait signaler un fort rebond à moyen/long terme. L'optimisme est croissant pour Solana, tandis que les sentiments sont plus calmes pour Cardano. La trajectoire future dépendra également de facteurs macroéconomiques (comme les décisions de taux de la Fed) et réglementaires (comme l'incertitude autour du projet de loi sur la clarté cryptographique aux États-Unis), qui pourraient accroître la volatilité. *Ceci n'est pas un conseil en investissement.

cryptonews.ruIl y a 1 h

Le Bitcoin a-t-il touché le fond, ou une 'secousse' se prépare-t-elle ? Quelle est la situation du XRP ?

cryptonews.ruIl y a 1 h

Une file d'attente de 43 jours pour le staking sur Ethereum s'est formée : mais selon un expert, ce n'est pas un véritable signal haussier

La forte augmentation des validateurs souhaitant miser leurs jetons sur Ethereum a créé une file d'attente d'activation d'environ 2,5 millions d'ETH, imposant une attente d'environ 43 jours. Thomas Brunner de Sygnum Bank souligne que cette congestion n'est pas un signal haussier direct, car elle est influencée par des facteurs techniques du protocole, comme la capacité quotidienne limitée à environ 57 600 ETH depuis la mise à jour Dencun, inchangée avec Pectra. L'accumulation dans la file d'attente ne représente pas uniquement une nouvelle demande, mais inclut aussi des réallocations d'ETH déjà misés, des ajouts aux validateurs existants et des processus de capitalisation. Un indicateur plus fort, selon Brunner, est la file de retrait quasi vide, signe que les investisseurs actuels maintiennent leurs positions, ce qui reflète une véritable confiance. Environ 41,2 millions d'ETH sont actuellement misés, soit environ 33,8% de l'offre en circulation. Malgré la faiblesse des prix, les investisseurs institutionnels continuent de considérer les revenus du staking comme une caractéristique fondamentale d'Ethereum. Cependant, les préoccupations concernant la confidentialité des adresses et transactions sur la blockchain restent un obstacle majeur à une adoption institutionnelle plus rapide.

cryptonews.ruIl y a 2 h

Une file d'attente de 43 jours pour le staking sur Ethereum s'est formée : mais selon un expert, ce n'est pas un véritable signal haussier

cryptonews.ruIl y a 2 h

Trading

Spot
活动图片