a16z Crypto: 9 Charts to Understand the Evolution of Stablecoins

marsbitPublié le 2026-04-25Dernière mise à jour le 2026-04-25

Résumé

Stablecoins are evolving from trading instruments to core financial infrastructure, driven by regulatory clarity and increased adoption. Key trends include accelerated growth following the U.S. GENIUS Act and the EU’s MiCA framework, which spurred non-USD stablecoin activity. Consumer-to-business transactions are growing fastest, doubling in 2025, while stablecoin card usage has surged. Velocity has nearly doubled since 2024, indicating active use rather than passive holding. Geographically, Asia dominates volume, led by Singapore, Hong Kong, and Japan. Notably, domestic transactions now account for nearly three-quarters of payments, highlighting stablecoins' role as local payment mediums on global infrastructure. Non-USD stablecoins, like Brazil’s BRLA, are also gaining traction. The data suggests stablecoins are becoming ubiquitous payment tools—global in design but increasingly local in practice.

Author: a16z crypto

Compiled by: Jiahuan, ChainCatcher

Stablecoins have been finding their footing for years.

Initially, they were just a trading tool, a means to transfer dollars across exchanges. Then they evolved into a savings instrument, held rather than spent. Today, the data points in a new direction: stablecoins are increasingly becoming core financial infrastructure.

The following nine charts reveal the factors driving this trend.

Regulation Accelerates Market Growth

For most of their history, regulatory uncertainty limited institutional participation. Later, the GENIUS Act brought regulatory clarity. It didn't create this trend, but it amplified and accelerated it.
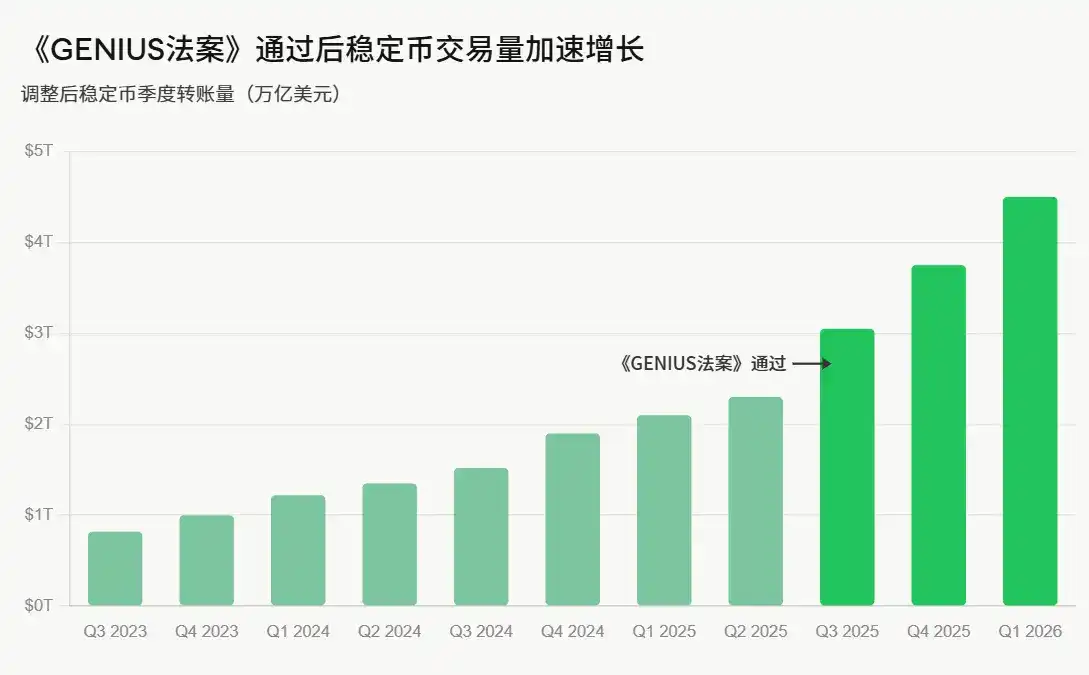
In the United States, the GENIUS Act established the first federal-level framework for stablecoin issuance. This shift is clearly visible in the data: adjusted trading volume had been rising for several quarters before the bill's passage, and growth accelerated further after its passage, reaching approximately $4.5 trillion in Q1 2026.

European regulation—the Markets in Crypto-Assets (MiCA) framework—tells a more complex story. When the法案 fully came into effect at the end of 2024, several major exchanges delisted USDT to comply, leading to a surge in activity for non-dollar stablecoins, which一度 exceeded $40 billion.
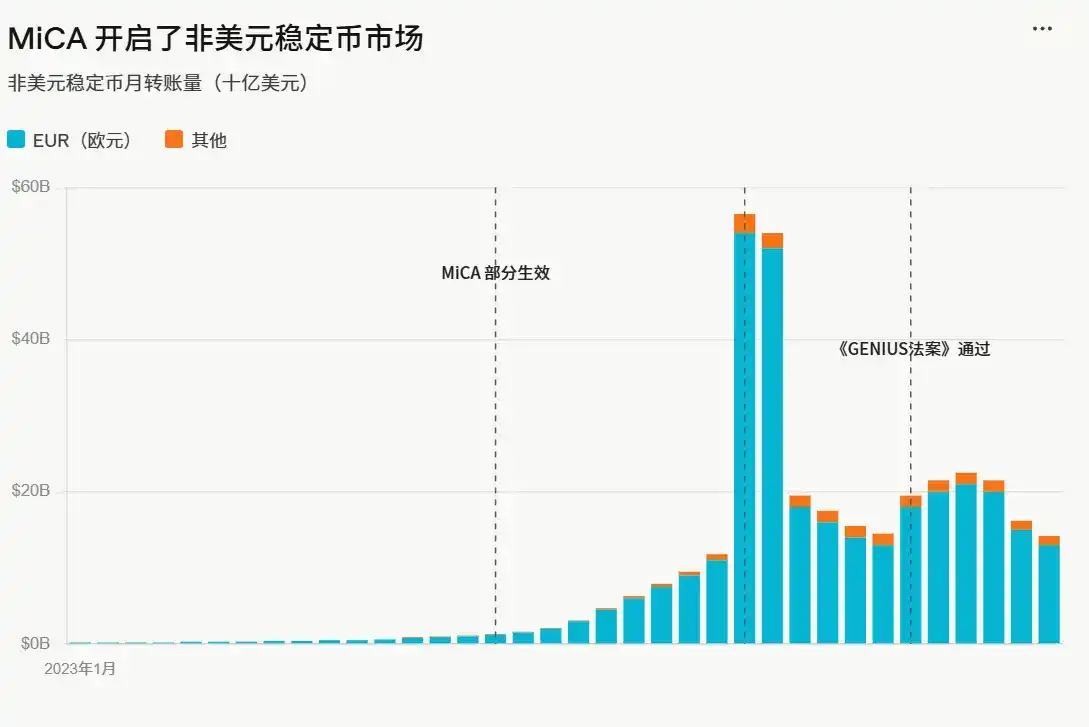
Since then, trading volume has stabilized at levels higher than the pre-MiCA baseline, around $15 billion to $25 billion per month. Regulation created a lasting market for non-dollar stablecoins that previously barely existed.

Stablecoin Commercial Activity is Growing

Perhaps the most noteworthy structural change lies in how people are actually using stablecoins.
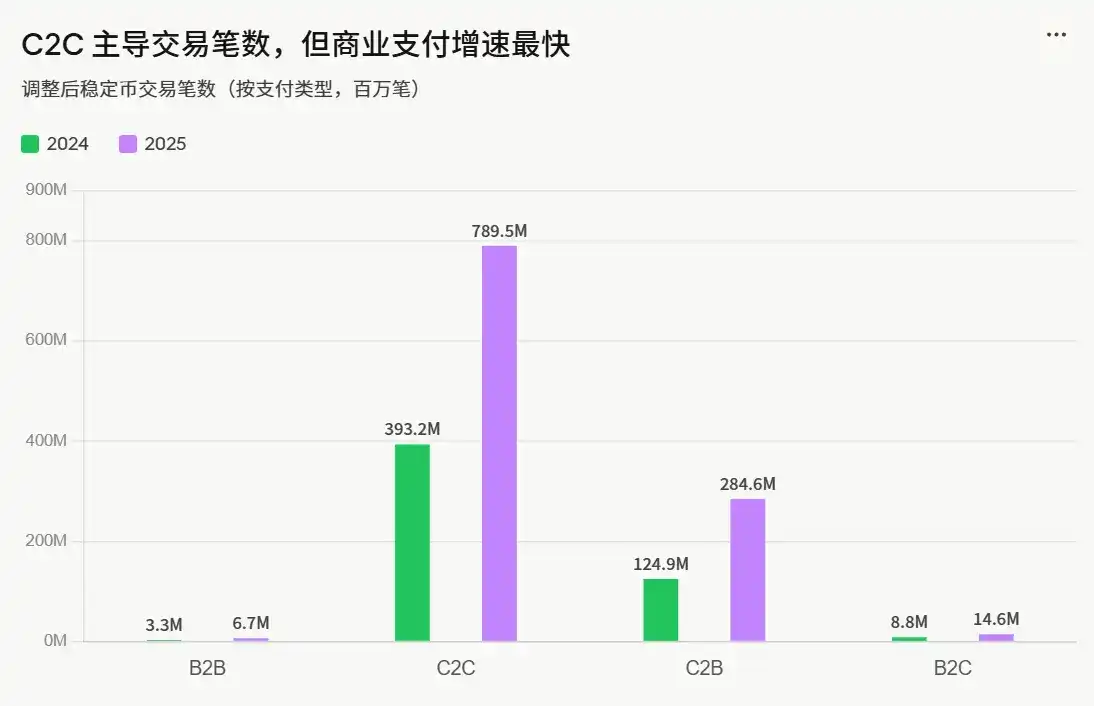
In terms of raw transaction count, the C2C category far surpasses all others: reaching 789.5 million in 2025. But Consumer-to-Business (C2B) stablecoin transactions grew the fastest, reaching 284.6 million in 2025 compared to 124.9 million in 2024, more than doubling year-over-year (+128%).

Data from stablecoin card infrastructure highlights this trend.
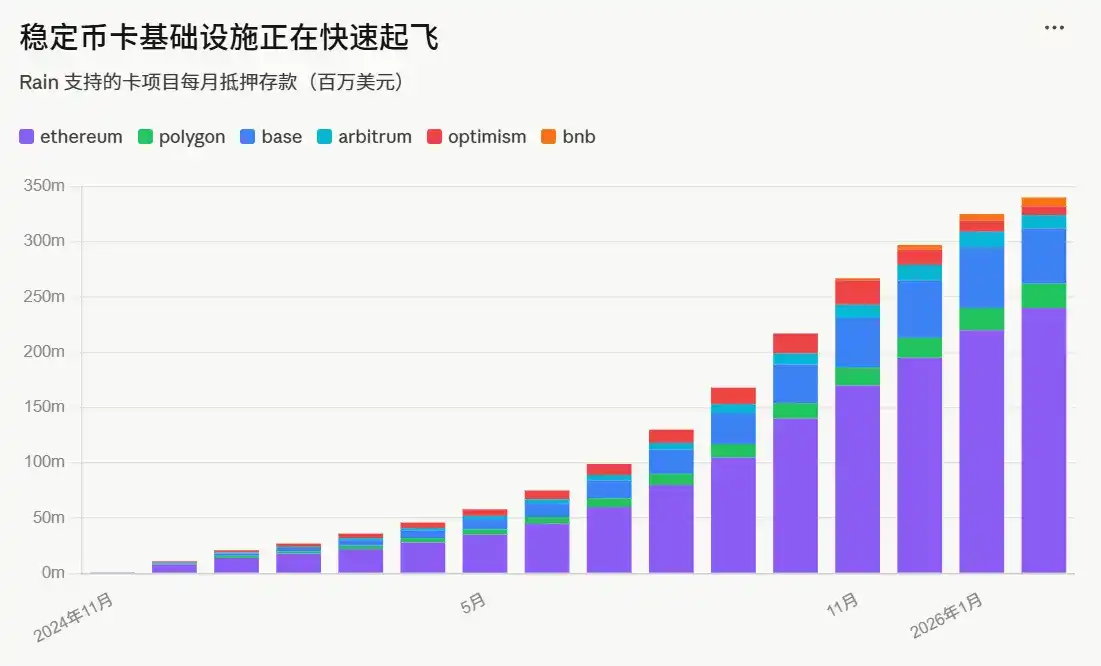
Monthly collateral deposits for stablecoin card programs supported by Rain (including Etherfi Cash, Kast, Wallbit, etc.) grew from nearly zero in November 2024 to over $300 million per month by early 2026. While this is collateral supporting spending, not direct spending of stablecoins, the trajectory is striking: stablecoin commercial activity is on the rise.

Stablecoin Velocity is Increasing

Every dollar of stablecoin supply is turning over more frequently.

Since early 2024, the velocity of stablecoins (the ratio of adjusted monthly transfer volume to circulating supply) has almost doubled, rising from 2.6x to 6x. An increase in velocity means demand for stablecoin transactions is outpacing new issuance, and the existing supply is working harder.
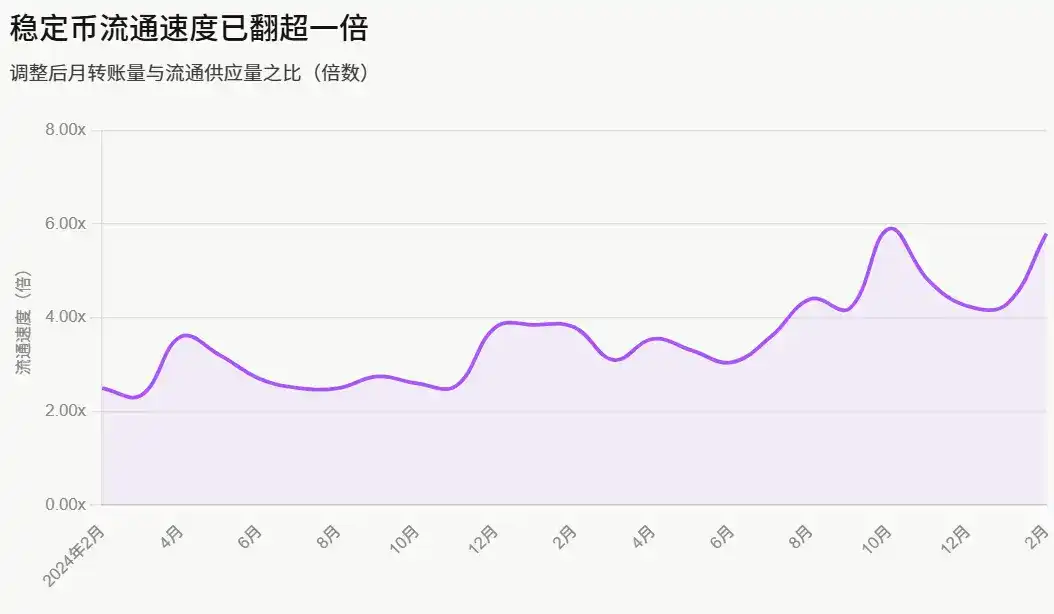
This is a hallmark of a true payment network—the base currency is being actively used, not just held.

Stablecoin Volume Reflects More Payments

If trading, fund flows, and exchange mechanisms—which make up the bulk of stablecoin transactions—are excluded, the estimated total for payments between different entities last year was still between $350 billion and $550 billion.

By volume, the Business-to-Business (B2B) sector dominates stablecoin payments (unsurprising given its scale). But other sectors, such as direct Consumer-to-Consumer (C2C) payments and interactions with merchants, are also expanding rapidly.

Stablecoin Payments are Currently Concentrated in Specific Regions

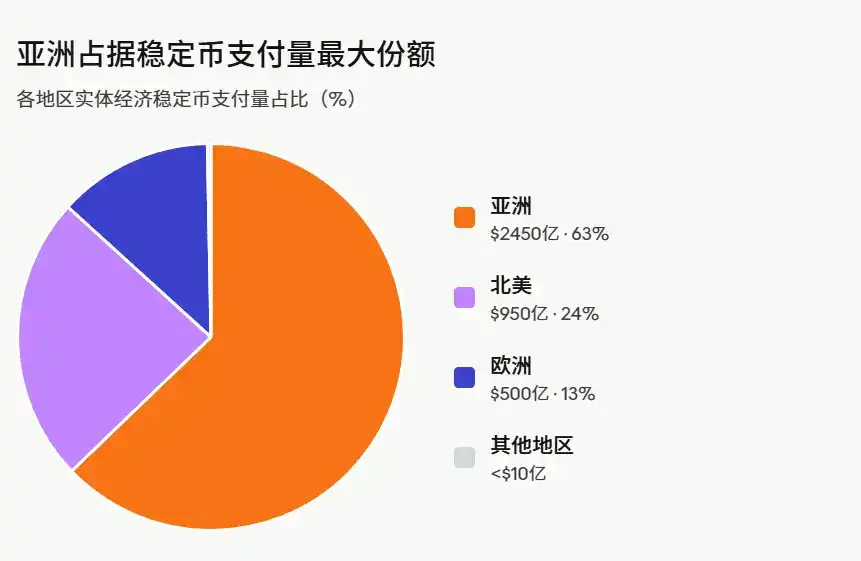
Geographically, stablecoin payment activity is not evenly distributed.

Nearly two-thirds of the transaction volume comes from Asia, primarily concentrated in Singapore, Hong Kong, and Japan.

North America accounts for about a quarter. Europe's share is around 13%. Latin America and Africa together make up only a very small portion, less than $1 billion.
Not Just Cross-Border Payments, But Local Currencies on Global Rails

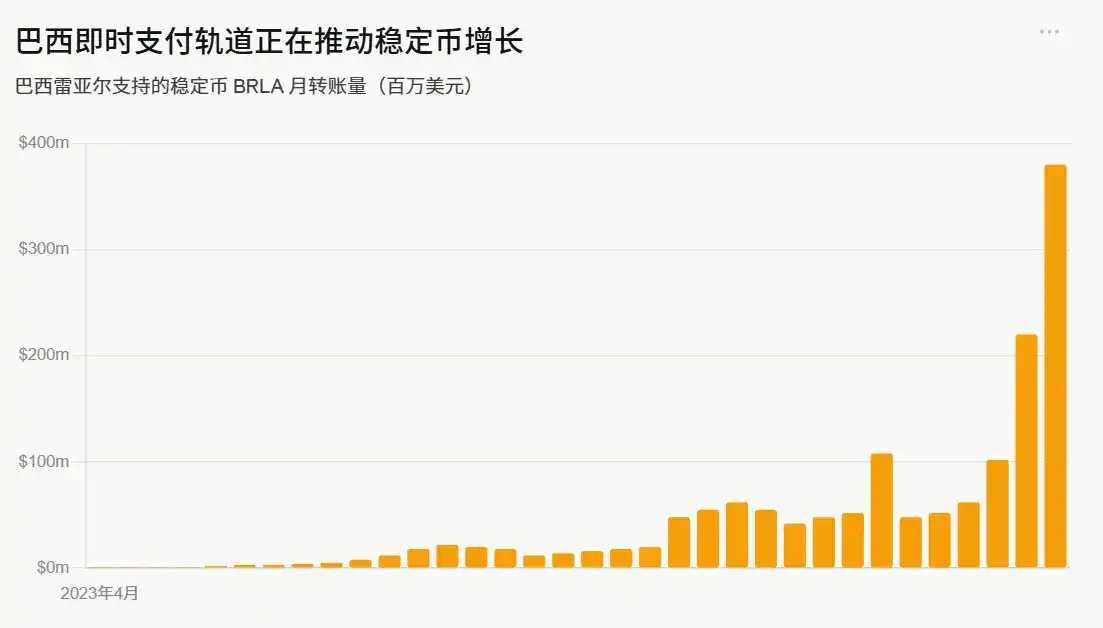
The development of non-dollar stablecoins is not limited to Europe; it is also evident in emerging markets, driven by various factors.

Brazil is a prime example. The monthly transfer volume of BRLA (a stablecoin backed by the Brazilian Real) has grown from nearly zero in early 2023 to about $400 million per month by early 2026. Access to the PIX instant payment network has driven its adoption.
Although stablecoins are often described as cross-border tools, the proportion of cross-border activity has actually been declining, not rising.

Domestic transactions (stablecoin transfers occurring within the same country/region) have grown from about half of the payment volume in early 2024 to nearly three-quarters by early 2026. What does this mean? Stablecoins are not only establishing themselves as remittance or forex tools but also becoming a local payment medium running on global infrastructure.
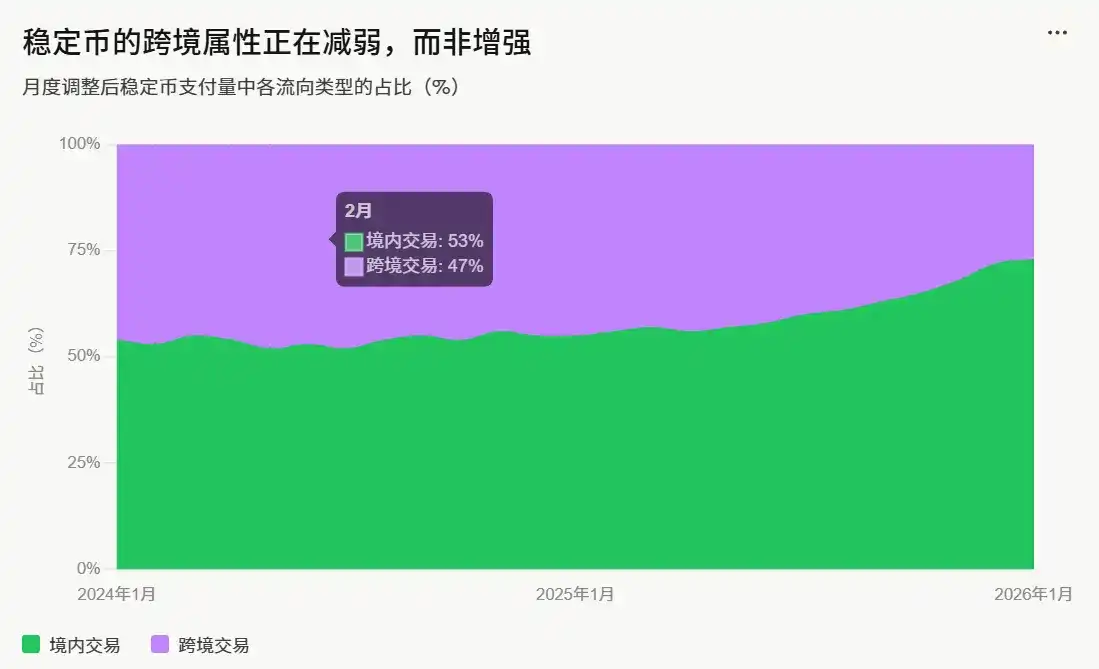
Putting all these factors together, a clear picture emerges, though it's not the one most people expected: many thought stablecoins would be purely focused on cross-border transactions. Instead, they are becoming increasingly localized.

While the US dollar remains the core f币锚定 for the vast majority of stablecoins, stablecoins are by no means simply an export of the dollar. Non-dollar variants, such as euro-backed and Brazilian real-backed local currency stablecoins, are gaining popularity.

Although peer-to-peer (C2C) stablecoin transfers far exceed other types of payment flows in quantity, increasingly usage is flowing towards everyday consumption (C2B).

Each quarter's data provides more evidence that stablecoins are developing into general-purpose payment infrastructure. They are global by design but increasingly local in practice.

It's still early days. But the shape of this system is becoming clearer.

Questions liées

QWhat was the impact of the GENIUS Act on stablecoin trading volume in the US?

AThe GENIUS Act established the first federal-level framework for stablecoin issuance in the US. Before its passage, adjusted trading volume had been increasing for several consecutive quarters. After its enactment, growth accelerated further, reaching approximately $4.5 trillion in Q1 2026.

QWhich region accounts for the largest share of stablecoin payment volume, and which specific areas are the main contributors?

AAsia accounts for nearly two-thirds of the stablecoin payment volume. The main contributors are Singapore, Hong Kong, and Japan.

QWhat is the most significant structural change in how people use stablecoins, as indicated by transaction growth?

AThe most significant structural change is the growth in Consumer-to-Business (C2B) stablecoin transactions. This category saw the fastest growth, more than doubling (+128%) from 124.9 million transactions in 2024 to 284.6 million in 2025.

QWhat does the increasing velocity of stablecoins indicate about their use?

AThe increasing velocity of stablecoins, which nearly doubled from 2.6x to 6x since early 2024, indicates that the demand for stablecoin transactions is outpacing new issuance. It means the existing supply is circulating more frequently, which is a hallmark of a genuine payment network where the base currency is being actively used, not just held.

QContrary to common belief, what trend is observed in the proportion of cross-border stablecoin activity?

AContrary to the common belief that stablecoins are primarily for cross-border transactions, the proportion of cross-border activity has actually been decreasing. Domestic transactions (stablecoin transfers within the same country/region) grew from about half of the payment volume in early 2024 to nearly three-quarters by early 2026.

Lectures associées

Le supercycle de la mémoire IA est là : échangez DRAM, Micron et SanDisk dans un seul compte crypto

L'ère de l'IA se heurte à un goulot d'étranglement critique : la mémoire. Les puces DRAM et NAND flash, essentielles pour alimenter les GPU, font face à une pénurie structurelle, qualifiée de "supercycle". Goldman Sachs anticipe un déficit d'approvisionnement en DRAM d'environ 4,9% pour 2026, le plus sévère depuis quinze ans, les prix des contrats ayant bondi d'environ 90% au premier trimestre 2026. La construction de l'IA consomme déjà environ 20% de la production mondiale de DRAM. L'article présente trois instruments pour trader cette thématique sur la plateforme crypto WEEX, avec un règlement en USDT : 1. **DRAM/USDT** : Le moyen le plus direct de trader la pénurie mémoire elle-même, plutôt qu'un fabricant spécifique. 2. **Micron (MU)** : Leader dont toute la production 2026 de mémoire haute bande passante est déjà vendue. Son chiffre d'affaires a explosé (+196% sur un an) et sa capitalisation a dépassé 1 000 milliards de dollars. 3. **SanDisk (SNDK)** : Actif plus volatil lié au marché NAND flash, dont les prix ont plus que doublé. L'action a progressé d'environ 600% en 2026. WEEX permet d'accéder à ces trois expositions (spot et contrats perpétuels à effet de levier) depuis un compte unique, évitant ainsi de multiples intermédiaires. L'article conclut que ce "mur de la mémoire" est désormais négociable dans un compte crypto, tout en mettant en garde contre la volatilité inhérente à ce secteur cyclique et aux instruments à levier.

TheNewsCryptoIl y a 27 mins

Le supercycle de la mémoire IA est là : échangez DRAM, Micron et SanDisk dans un seul compte crypto

TheNewsCryptoIl y a 27 mins

UNI double en deux mois malgré la tendance : un retour aux valeurs attendu depuis 5 ans

Au cours des mois de juin et juillet, alors que le marché des cryptomonnaies était globalement en berne, le token UNI d'Uniswap a affiché une performance remarquable, son prix doublant presque pour passer de 2,3 à près de 4,6 dollars. Cette hausse trouve son origine dans la mise en œuvre fin décembre 2025 de la fameuse « fee switch », activée après des années de débats. Le mécanisme, baptisé UNIfication, permet désormais au protocole de prélever une partie des frais de transaction sur certaines pools (v2 et v3 sur Ethereum), d'y ajouter les revenus du séquenceur d'Unichain, et de diriger l'ensemble de ces revenus vers un contrat (TokenJar) dont la seule fonction est d'acheter et de brûler des UNI de manière permanente. Si le marché est resté sceptique dans un premier temps en raison de données de revenus modestes (environ 7,3k$ de revenus quotidiens pour le protocole en mai 2026), la dynamique a radicalement changé en juillet. Le déploiement d'Uniswap sur la Robinhood Chain, dédiée aux actions tokenisées, a entraîné une explosion des volumes. En une semaine, cette nouvelle chaîne a généré près de la moitié des frais hebdomadaires totaux d'Uniswap. L'activation simultanée du mécanisme de frais sur les pools v4 a ensuite fait bondir les revenus du protocole, les fonds alloués au brûlage quotidien d'UNI passant d'environ 114k$ début juillet à plus de 325k$ fin juillet. La hausse actuelle ne repose donc plus sur une simple anticipation, mais sur des flux de trésorerie concrets et croissants, transformant UNI d'un token de gouvernance en un actif générateur de revenus. Son avantage structurel réside dans sa distribution ancienne et dispersée, sans gros déblocages à venir, permettant aux rachats de réellement impacter le marché secondaire. La question centrale pour l'avenir est la pérennité des volumes sur la Robinhood Chain une fois ses subventions aux frais de transaction épuisées, ce qui déterminera si cette hausse marque le début d'une véritable valorisation ou un effet d'optique temporaire.

marsbitIl y a 1 h

UNI double en deux mois malgré la tendance : un retour aux valeurs attendu depuis 5 ans

marsbitIl y a 1 h

Soudain, Google Earth retire en urgence la fonctionnalité de génération d'images Nano Banana 2 !

**Google Earth retire d'urgence la fonctionnalité de génération d'image Nano Banana 2** Google a brièvement intégré son dernier modèle de génération d'image, Nano Banana 2, à Google Earth, permettant aux utilisateurs de transformer, via de simples invites textuelles, des vues satellites ou aériennes en scènes historiques, visualisations architecturales ou créations futuristes, le tout ancré dans les contraintes géospatiales réelles (topographie, perspectives 3D). Cette technologie, baptisée « ancrage géospatial » (Geospatial Grounding), s'appuie sur les données cartographiques et les capacités de recherche de Google pour générer des images crédibles intégrées au paysage. Cependant, cette fonctionnalité a été rapidement retirée après son lancement. Bien que Google ait présenté des cas d'usage potentiels en éducation, tourisme ou urbanisme, les utilisateurs s'en sont rapidement emparés pour créer des contenus fantaisistes, comme transformer le Independence Hall de Philadelphie en ruine post-apocalyptique peuplée de zombies et de clowns maléfiques. Cette expérience, qualifiée par certains de « bouillie d'IA » (AI Slop) pour son manque de rigueur géométrique, a révélé des problèmes de modération. Google a indiqué retirer temporairement l'outil pour « renforcer les mesures de protection » avant un éventuel nouveau déploiement. Cette initiative place Google sur un terrain unique face à des concurrents comme Midjourney ou DALL-E : plutôt que de simplement « bien dessiner », il s'agit de « remodeler la Terre » de manière crédible en s'appuyant sur son immense base de données géographiques, créant ainsi un nouveau champ : la visualisation IA géo-an crée.

marsbitIl y a 2 h

Soudain, Google Earth retire en urgence la fonctionnalité de génération d'images Nano Banana 2 !

marsbitIl y a 2 h

Une transformation majeure de la Fed ? Rapport : Walsh envisage de réduire la fréquence des réunions sur les taux, rompant avec une tradition de 40 ans

Le président de la Fed, Walsh, envisage de réduire la fréquence des réunions du Comité fédéral de l'open market (FOMC), ce qui constituerait un changement majeur dans son fonctionnement, en rupture avec la routine établie depuis 1981 de huit réunions par an. Selon des informations du New York Times, Walsh a évoqué cette idée lors de la réunion cette semaine. Un nouvel horaire pourrait être arrêté avant la prochaine réunion de septembre, bien que les changements concrets interviendraient plus tard. Réduire le nombre de réunions diminuerait les opportunités de voter sur les taux et pourrait affaiblir la capacité de réaction de la Fed face à l'évolution de l'économie, tout en réduisant la transparence de sa politique, inversant une tendance de plusieurs décennies. La loi bancaire de 1935 n'exige qu'un minimum de quatre réunions par an. Walsh avait précédemment déclaré au Congrès que quatre réunions étaient insuffisantes, ce qui contraste avec la direction actuelle des discussions. Le système actuel de huit réunions, instauré sous Paul Volcker, fournit un cadre prévisible. Moins de réunions signifierait moins d'occasions pour le marché de comprendre la trajectoire des taux. Cette initiative s'inscrit dans la volonté plus large de Walsh de réformer l'institution depuis sa prise de fonction en mai, notamment en réduisant la longueur des communiqués et en repensant les conférences de presse. Historiquement, la fréquence des réunions a varié, avec jusqu'à 19 réunions en 1956. Une évaluation interne de 1988 avait conclu que le rythme de huit réunions restait approprié. Le projet de Walsh irait à l'encontre de cette conclusion, et son impact potentiel sur la communication de la Fed et la flexibilité de sa politique sera surveillé de près.

marsbitIl y a 2 h

Une transformation majeure de la Fed ? Rapport : Walsh envisage de réduire la fréquence des réunions sur les taux, rompant avec une tradition de 40 ans

marsbitIl y a 2 h

Trading

Spot
活动图片