This article is from: Kyle Soska
Compiled by | Odaily Planet Daily (@OdailyChina); Translator | Azuma (@azuma_eth)
Editor's Note: The market has been oscillating at low levels. Will the future direction be up or down? Ramiel Capital Chief Investment Officer Kyle Soska analyzes the long-short structure of the perpetual futures market in his latest article and attempts to provide an answer by examining changes in market risk appetite.
The highlight of Kyle's analysis method is that by incorporating data disclosures from Ethena, he excludes basis positions and hedging positions, which have some noise impact on the price direction, and focuses only on net long and net short positions, which more directly determine the market's direction. His final conclusion is that the current market's net long vs. net short structure is in a historically rare state. While it's possible this could become the new normal, observing other asset markets reveals that such a trend is generally extremely difficult to sustain long-term. In other words, a turning point may be imminent.
Below is the original content by Kyle Soska, compiled by Odaily Planet Daily.

The cryptocurrency market has been in a risk-off state for several consecutive months. I have been sifting through various forms of market data, hoping to find signs of a potential market turnaround. This article will delve into the market structure of perpetual futures and, combined with data from the Ethena transparency dashboard, explore changes in market risk appetite.
Ethena's currently deployed capital has fallen to its lowest level in years, only 71% of the low point in 2025. This is not a criticism of Ethena, but rather a reflection of the current market state. Directional shorts have nearly equaled directional longs — an extremely rare structure in the crypto market that has historically been difficult to sustain long-term.
The cryptocurrency market has long been characterized by extremely high asset volatility and the widespread use of high leverage by traders. Since the BitMEX era, perpetual futures have become the highest volume product, with trading volumes typically 5 to 20 times that of the spot market. As the core hub providing leverage to retail investors in the market, observing the perpetual futures market can provide a good reflection of the overall risk appetite of the crypto market.
Ethena provides us with a unique window into the crypto derivatives market. As shown in the figure below, Ethena's strategy essentially executes a carry trade in cryptocurrency, and its logic is very simple — when a trader goes long on a crypto asset, Ethena acts as the counterparty and goes short. Simultaneously, Ethena buys an equivalent amount of the asset in the spot market to hedge its short position.
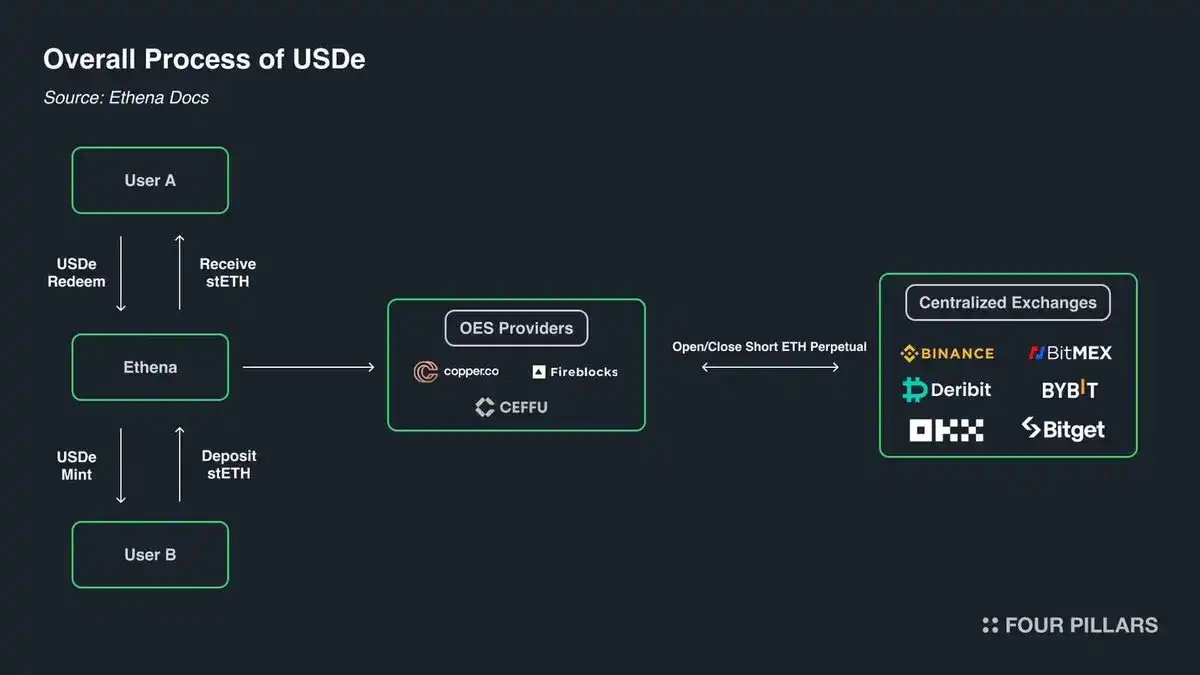
In a sense, Ethena provides "Leverage-as-a-Service":
- Traders want exposure to rising crypto assets but lack sufficient capital;
- Ethena has capital but has a lower risk appetite;
- Therefore, traders borrow capital from Ethena through perpetual futures, and their cost is the "basis" + "perpetual funding rate".
According to the structure of perpetual futures, every long position is matched by a short position; they are always 1:1. Each open interest represents a cash flow agreement between two parties. The exchange's role is to match these contracts, ensuring that every contract always has a sufficiently funded long and short holder. The matrix below shows the four possible outcomes when an exchange matches contracts.
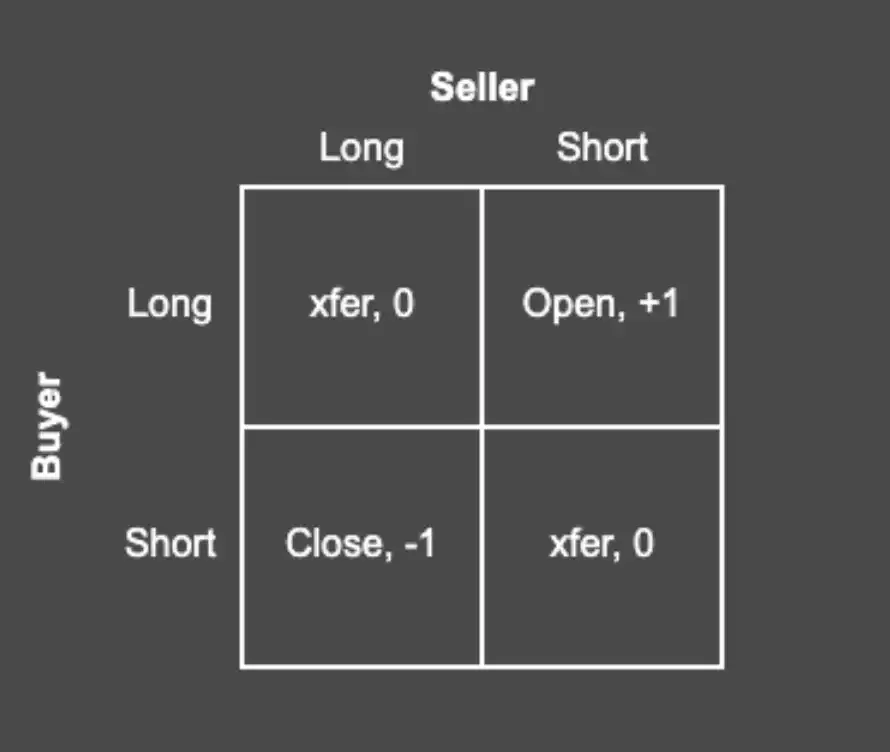
Every trade has a buyer and a seller. When the buyer and seller of a contract are both long or both short, the exchange only needs to transfer the contract ownership between the two parties. This transfer does not create or destroy any contracts. When the buyer is long and the seller is short, a new contract must be created: the buyer gets a long position, the seller gets a short position, thereby increasing the open interest by 1. Conversely, if the seller is long and the buyer is short, the exchange can unbind both parties from a specific contract and delete that contract, thereby reducing the open interest by 1.
So who holds these contracts in a typical market? Essentially, there are four types of contract holders:
- Directional longs want exposure to price increases. They are risk-seeking participants, and their risk demand depends on the strength of market risk appetite.
- Directional shorts comprise two types of participants: those who want exposure to asset price declines, and those who want to hedge their holdings in a more tax-efficient manner. For example, VCs and company employees who receive compensation in tokens often want to hedge future unlockable tokens to lock in the current price. For many altcoins, market liquidity is often too thin to support effective direct hedging, or the relevant market may not even exist. In such cases, companies like Cumberland, Wintermute, FalconX, Flowdesk, Amber, etc., can construct a dynamically managed synthetic position: by shorting a number of highly liquid and correlated assets (like Bitcoin and Ethereum) to hedge an exposure to a less liquid asset (e.g., Monad). This category also includes projects like Neutrl, which use this hedging structure as a yield strategy.
- Basis traders are opportunistic shorts. They are not concerned with price direction but voluntarily match the excess demand from directional longs when market imbalances occur. In most market environments, long demand tends to exceed short demand, and their role is to fill this gap. Their scale is typically highly elastic and can expand or shrink rapidly.
- Perp-Perp arbitrageurs hold both long and short positions in perpetual futures simultaneously. Their role is to connect prices between different perpetual futures markets and eliminate any slight price differences after deducting transaction fees. Their long and short positions are perfectly matched at any given moment.
According to the structure of perpetual futures, every contract must be 1:1 long-short matched, so we know that "Directional longs + Arbitrage longs = Directional shorts + Basis shorts + Arbitrage shorts"; furthermore, due to the arbitrage structure, we also know that "Arbitrage longs = Arbitrage shorts"; canceling this relationship out from the first equation gives us "Directional longs = Directional shorts + Basis shorts".
Ethena provides us with a proxy metric for all basis shorts, thereby helping us observe the structural comparison between directional longs and directional shorts.
The chart below shows the balance sheet disclosed by Ethena, which divides assets into cash and deployed capital, for the time range from December 27, 2024, to March 7, 2026.
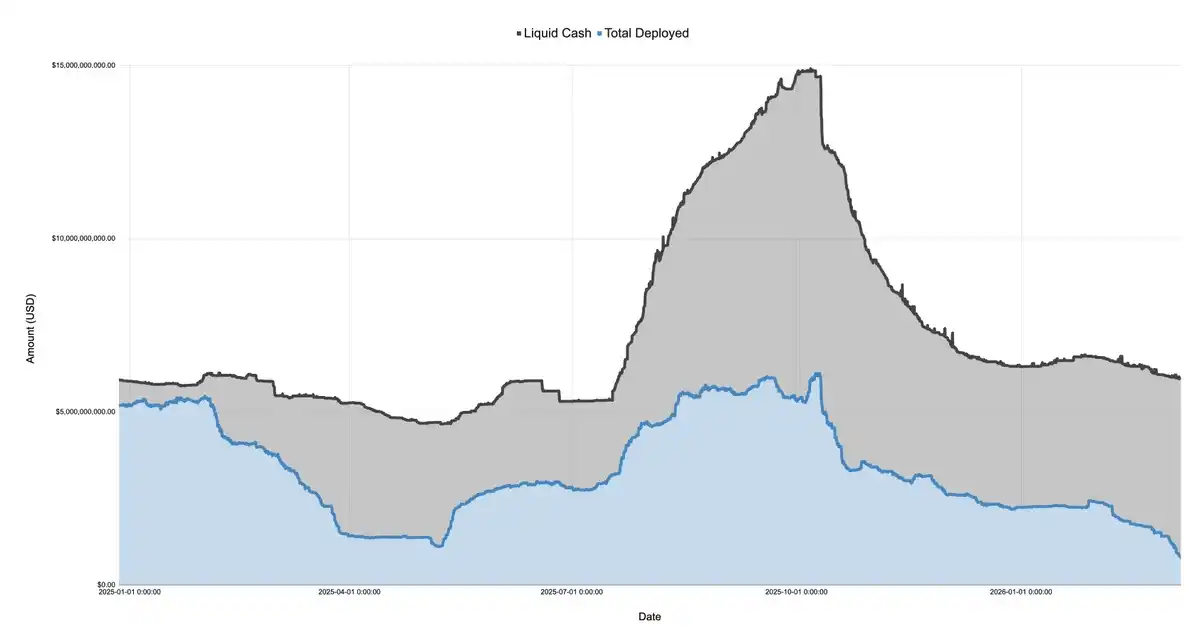
In 2025, following the launch of the TRUMP token in January, the market quickly entered a risk-off state, continuing to decline during the initial tariff discussions and the "Liberation Day" event in April. During this period, Ethena's deployed capital plummeted from over $5 billion to about $1.1 billion, a drop of more than 75%.
Remember, Ethena's deployed capital can be seen as a proxy for excess long demand in the market. Although Ethena is not the only institution executing this trade, its scale is very large (at times accounting for about 25% of the total size on Binance and Bybit). As long as Ethena has excess cash, it would theoretically expand its positions to fill the unmet long demand in the market. This means that while overall long demand may not have fallen by 75%, the excess long demand not absorbed by directional shorts did indeed decrease by that much.
The chart below shows the change in deployed capital in Ethena's balance sheet relative to its total size, the 2025 low, and the 2025 high.
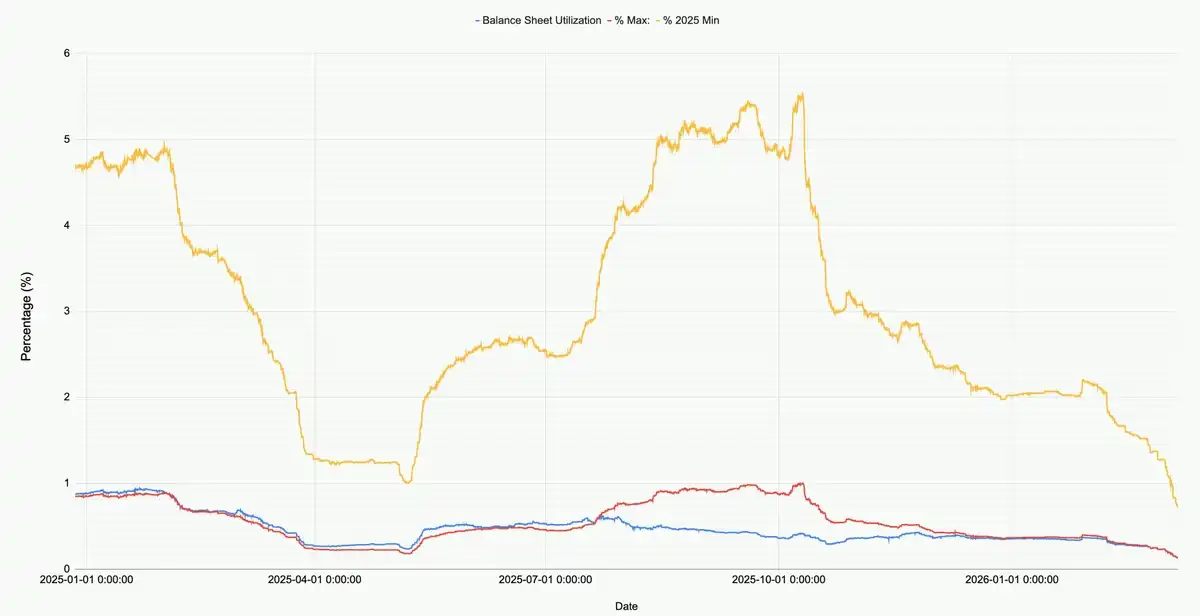
Looking at the current market, Ethena's deployed capital across all markets (BTC, ETH, SOL, BNB, XRP, HYPE) is $790 million. This figure is only 71% of the 2025 low and 12.9% of the pre-October 10th high. This number is not a criticism of Ethena but a reflection of the overall market state — net long demand in the current market is at a historically low level.
It is worth noting that during the market crash when Bitcoin fell to $60,000, Ethena still deployed over $2 billion in capital. Yet, just one month later, after February 8, 2026, deployed capital plummeted by 60%.
The chart below zooms in on Ethena's deployed capital and Bitcoin's price movement since January of this year.
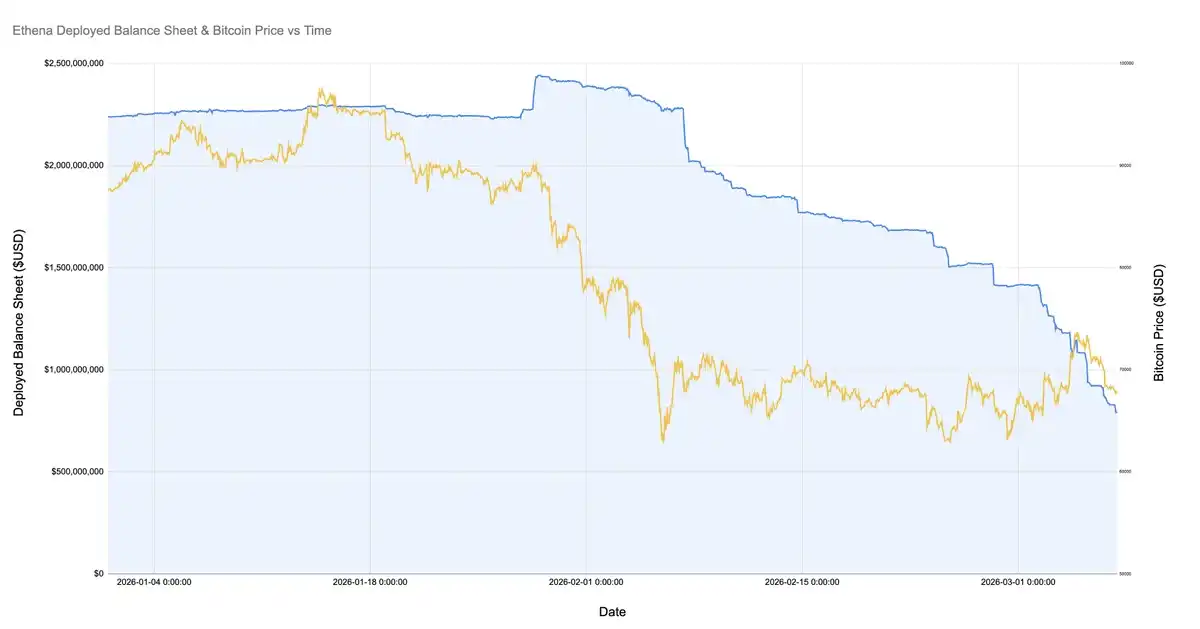
Since BTC fell to $60,000, Ethena's basis positions have shrunk from over $2 billion to less than $800 million. This change is quite intriguing because the overall market price has been relatively stable during this period. There are three possible explanations for this situation:
- Basis trades from the February crash are gradually being closed. These trades were profitable but unsustainable (the basis became more negative, but the funding rate was also negative);
- Directional short and hedging demand has increased, squeezing out opportunistic basis traders;
- Insufficient demand for leveraged long exposure.
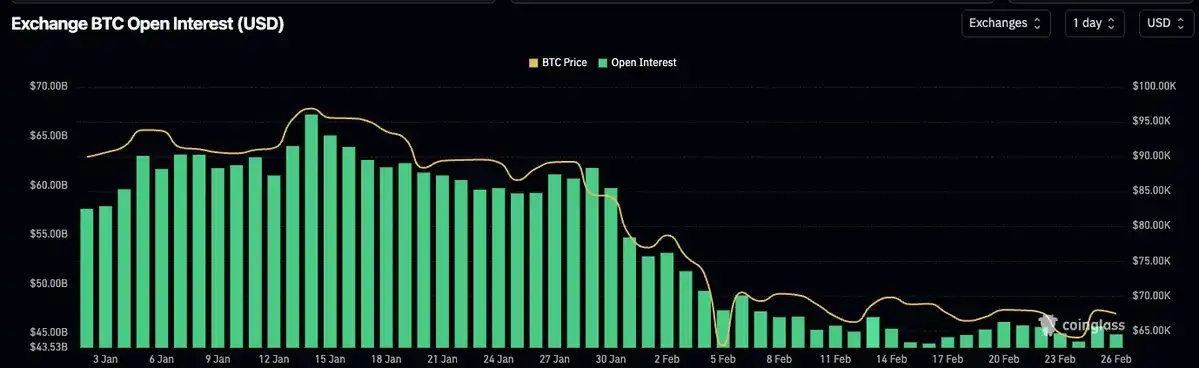
In my opinion, the reality is mainly a combination of the first two possibilities, with the third having a smaller impact. As shown in the figure above, during the period when Ethena was gradually closing positions, the open interest for Bitcoin and other major assets remained generally stable. At the same time, funding rates were negative for a considerable period, and coins like SOL had cumulative negative funding rates on multiple exchanges. This indicates that market demand for directional shorting or hedging exposure is rising.
If I had to guess, I think many small and medium-sized crypto companies and VCs are going through a crisis. Think of those small-cap projects (like Eigen, Grass, Monad, etc.). There could be hundreds of such tokens, and each project corresponds to multiple VCs, a project team, a company treasury, and a large number of employees. VCs need to limit losses and lock in profits to meet fund investment requirements, and project companies need to protect their operational capital reserves and employee size. This creates a situation where all participants must squeeze as much yield as possible from limited resources, and the solution is often a "crowded trade," namely actively managed structured products that short a basket of correlated assets.
We can see some signs of these structured products in some of ETH's short-term spikes, as these rallies often trigger short covering and drive synchronous increases in many small and mid-cap crypto assets. Another piece of evidence is the noticeable crowding out of opportunistic basis trading (e.g., Ethena) from the market.
Whatever the reason, we can be sure that for almost the first time in crypto market history, directional longs and directional shorts have nearly reached complete parity.
Theoretically, there is no reason why this state cannot become the new normal, or that this structure must change. But if we look at markets in other asset classes, we find that such a trend is very rare to sustain long-term.







