The digital asset market has opened the new year...by staying asleep. Since our final newsletter edition on 12-December (WoC 50, 2022), the markets are almost exactly where we left them.
With that as context, and from the whole Glassnode team, we hope you had a refreshing, and low voilatility break, and welcome you back to the 2023 series of The Week, On-chain.
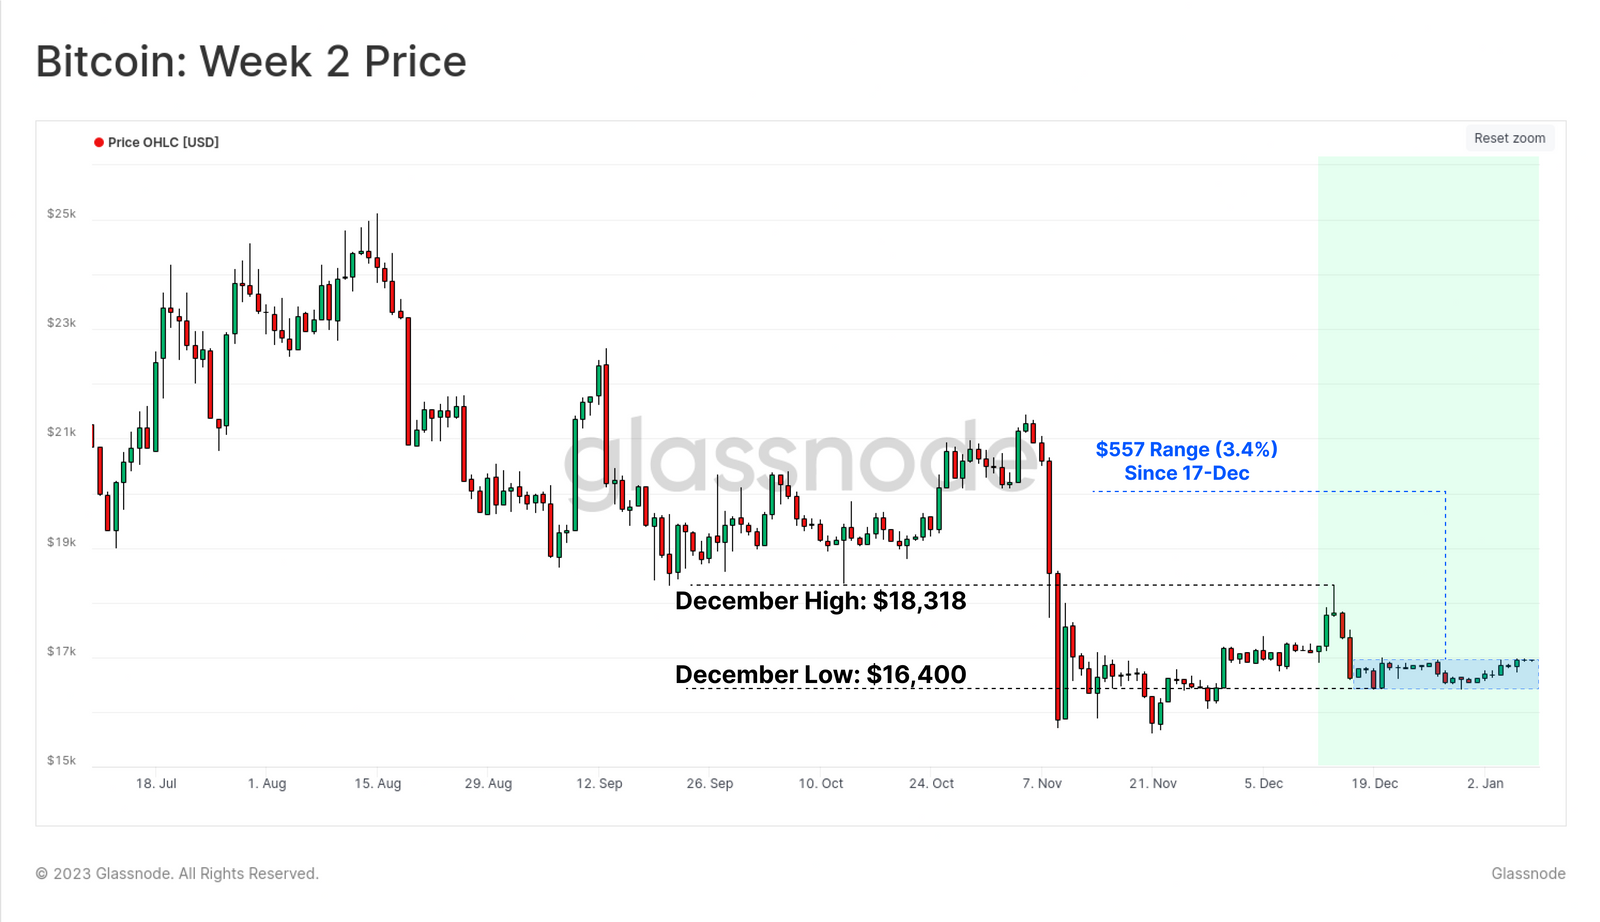
In a rarely seen feat, Bitcoin managed to trade within a price range of just $557 for over three weeks, with the highest price ($16.9k) just 3.4% above the range low of $16.4k. The end of year period is typically a quiet one for all markets, and in this instance, the digital asset space was no exception.
In this first edition of the year, we will cover the following topics:
1.Extremely low realized volatility, which historically precedes explosive market moves (in both directions), with latest examples of Nov 2018, and Apr-2019.
2.Softness in on-chain activity for BTC and ETH, coincident with low overall market volatility, and setting up weak a baseline for the new year.
Drawdowns in the Realized Cap indicating 2022 is comfortably one of the deepest bear markets to date with respect to capital losses.
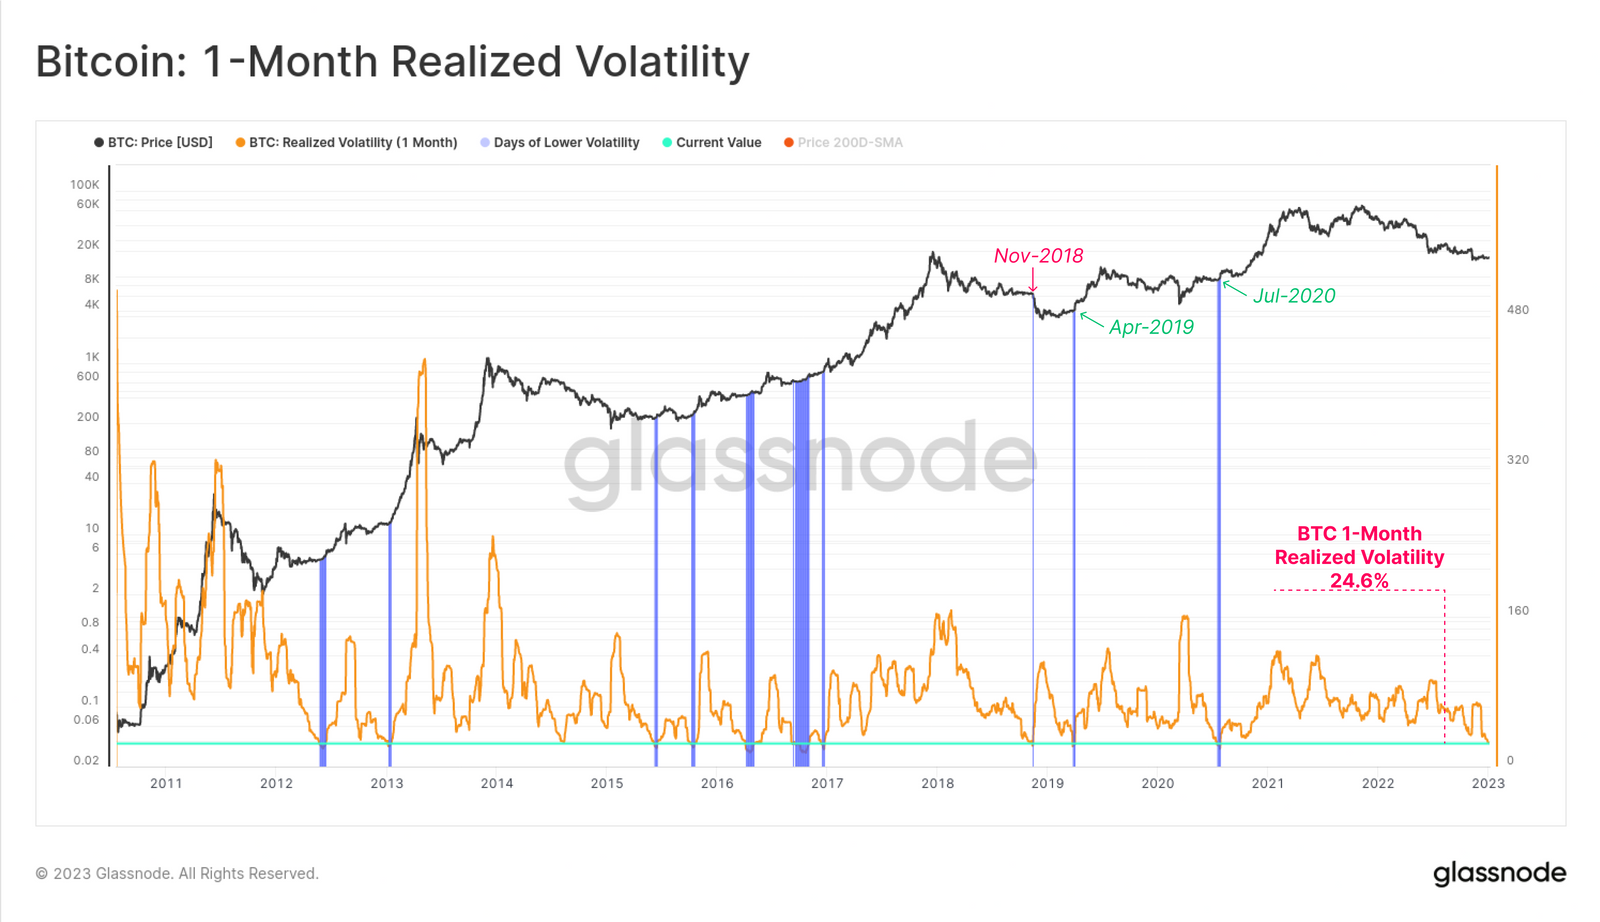
Bitcoin markets are infamous for their volatility, however in spite of this, the holiday break was exceptionally quiet. Realized volatility over the last month for BTC declined to multi-year lows of 24.6%, of which there are very few instances with similar levels (marked in 🟦). However, all prior examples preceded much higher volatility environments on the road ahead, with most trading higher, and just one (Nov 2018) trading dramatically lower.
1.Early bull market in 2012-13 where BTC prices were between $5 and $14.
2.Late bear market in 2015 and at several stages through the bull run 2016.
3.Nov-2018 immediately preceding a -50% drawdown in 1-month.
4.Apr-2019 prior to a rally from $4.2k to a peak of $14k in July-2019.
5.Jul-2020 in the lead up to what became the 2020-21 bull run to $64k.
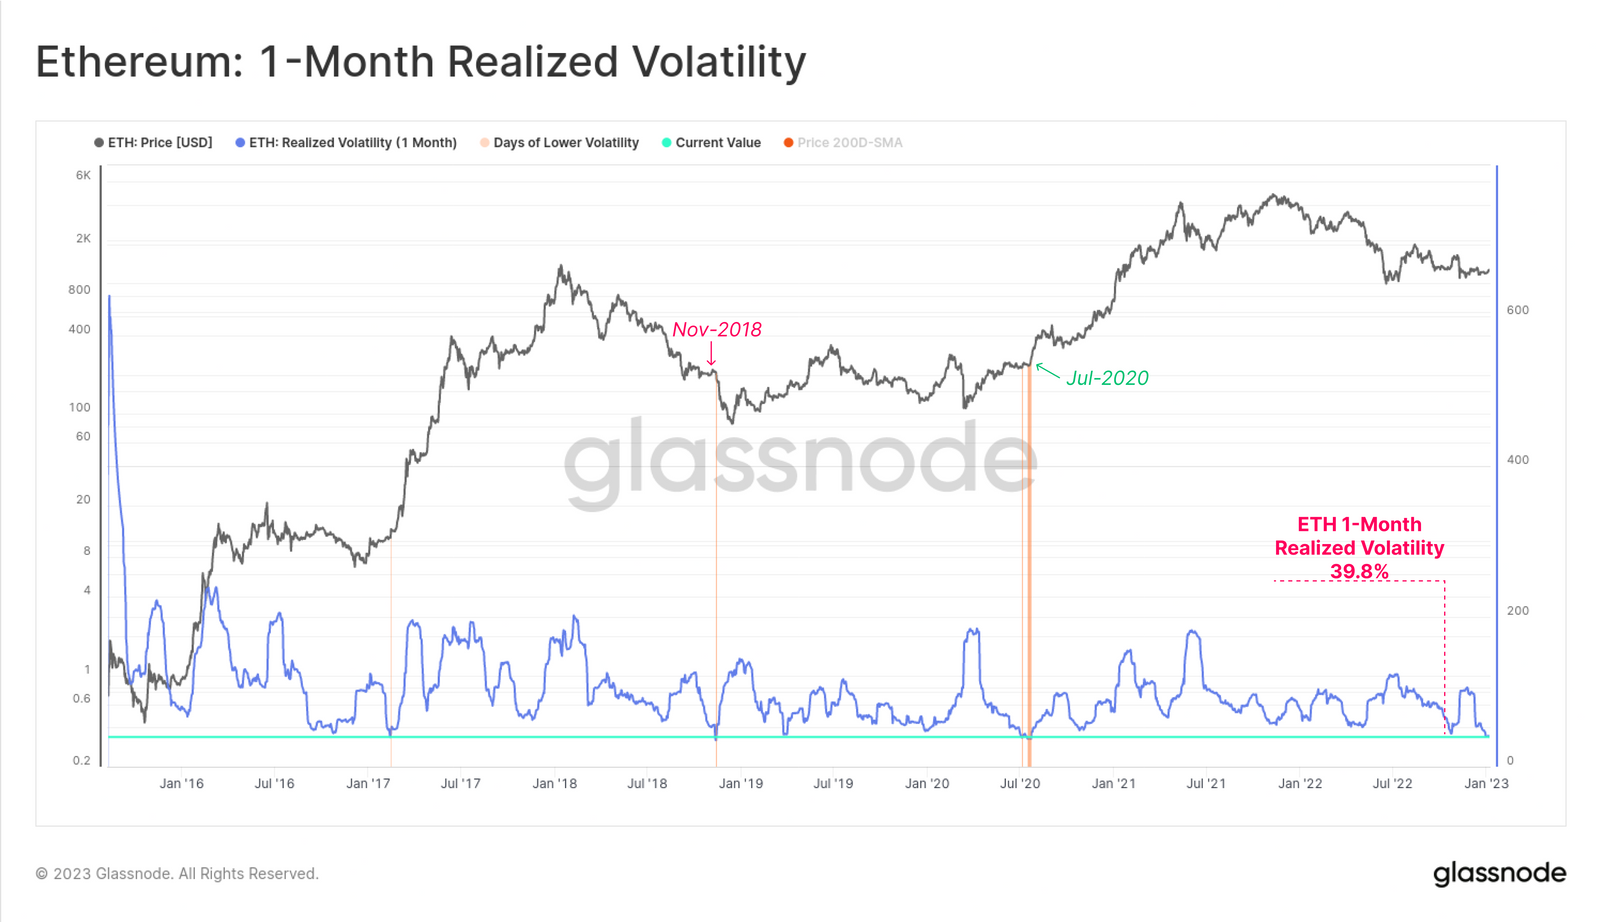
There are even fewer historically quiet periods for ETH, which has seen monthly realized volatility collapse to 39.8%. All primary instances of similarly low market volatility also preceded extreme volatility, with Nov-2018 (-58% sell-off) and Jul-2020 (2020-21 bull) being the primary examples.
A Weak Bitcoin Baseline
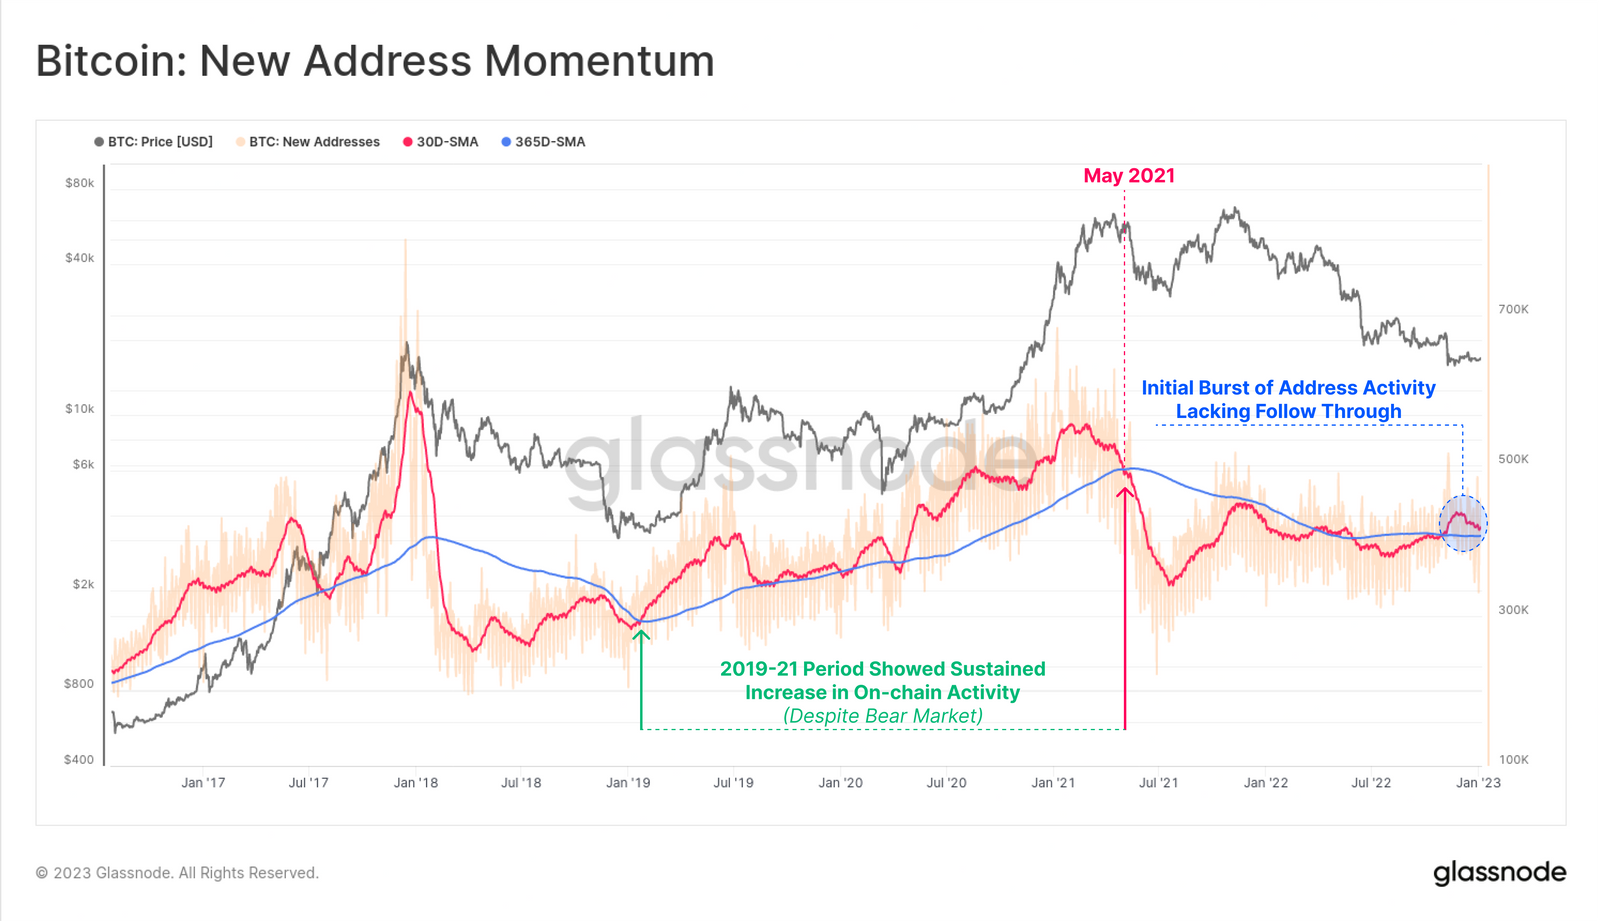
Shifting our focus into the on-chain activity space, we can see that a short-term burst of Bitcoin new addresses occurred followed the FTX fiasco, but has since cooled off noticeably. The monthly average 🔴 of New Addresses is returning towards the yearly average baseline 🔵, indicating that network usage is yet to establish a convincing and sustained recovery.
The momentum of on-chain activity metrics is a powerful tool to monitor a recovery in network fundamentals, with the 2019-20 period being a key example from the past.
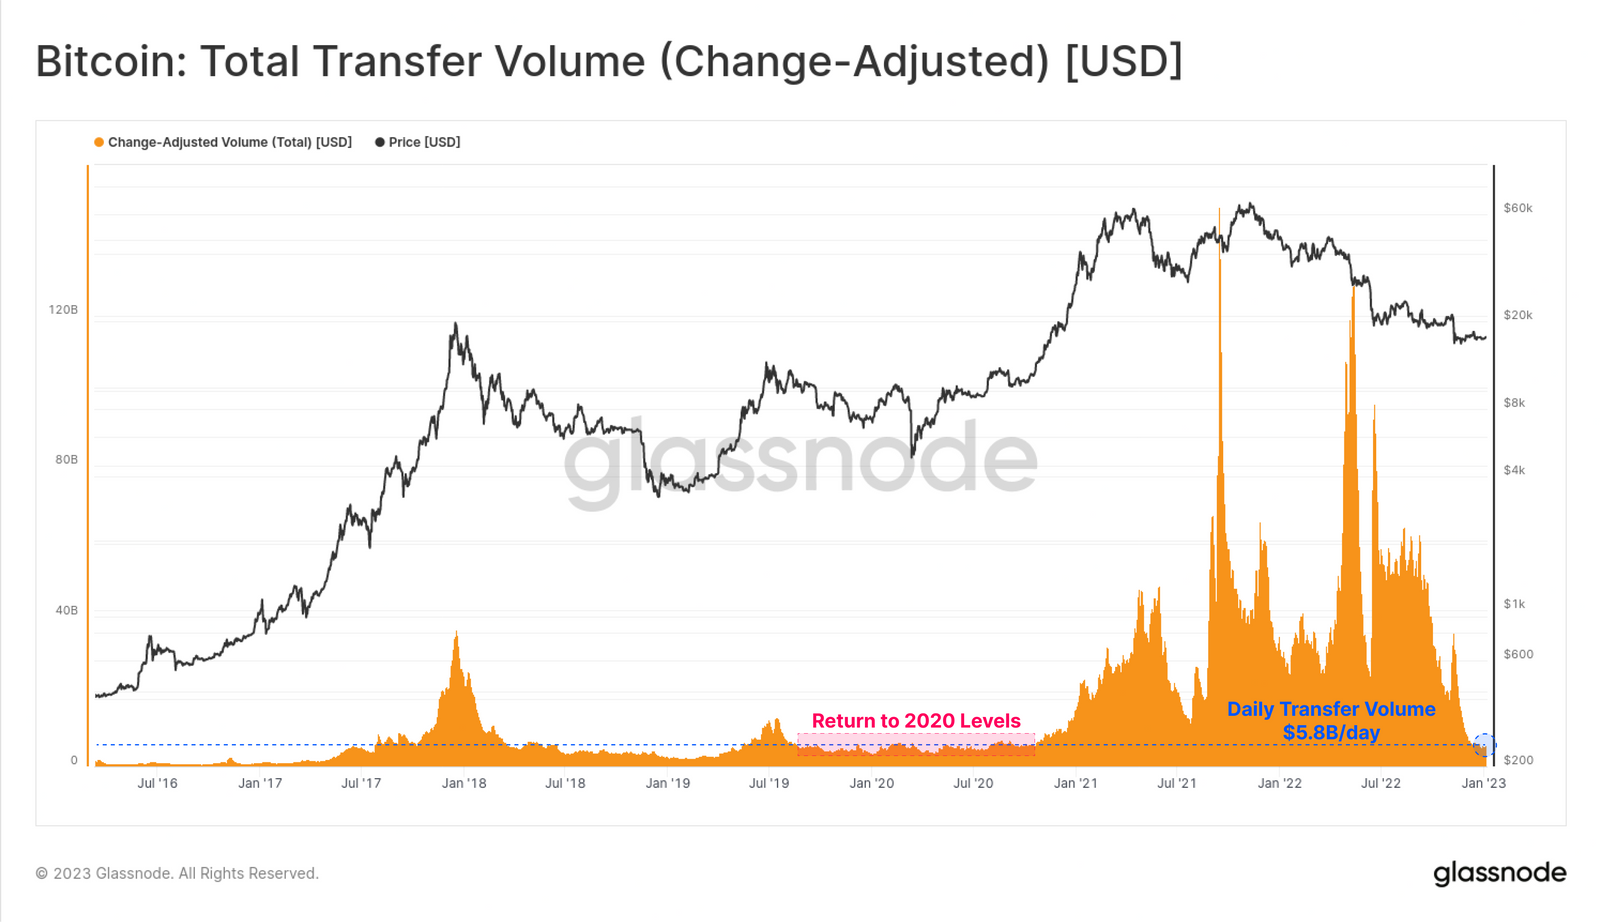
Despite this short burst of address activity, the total USD value processed by the Bitcoin network has been in free-fall. Daily transfer volume has collapsed from the ~$40B heights in Q3-2022, to just $5.8B/day today.
This returns daily settlement volumes to pre-bull 2020 levels, and largely indicates an expulsion of institutional sized capital flowing across the network.
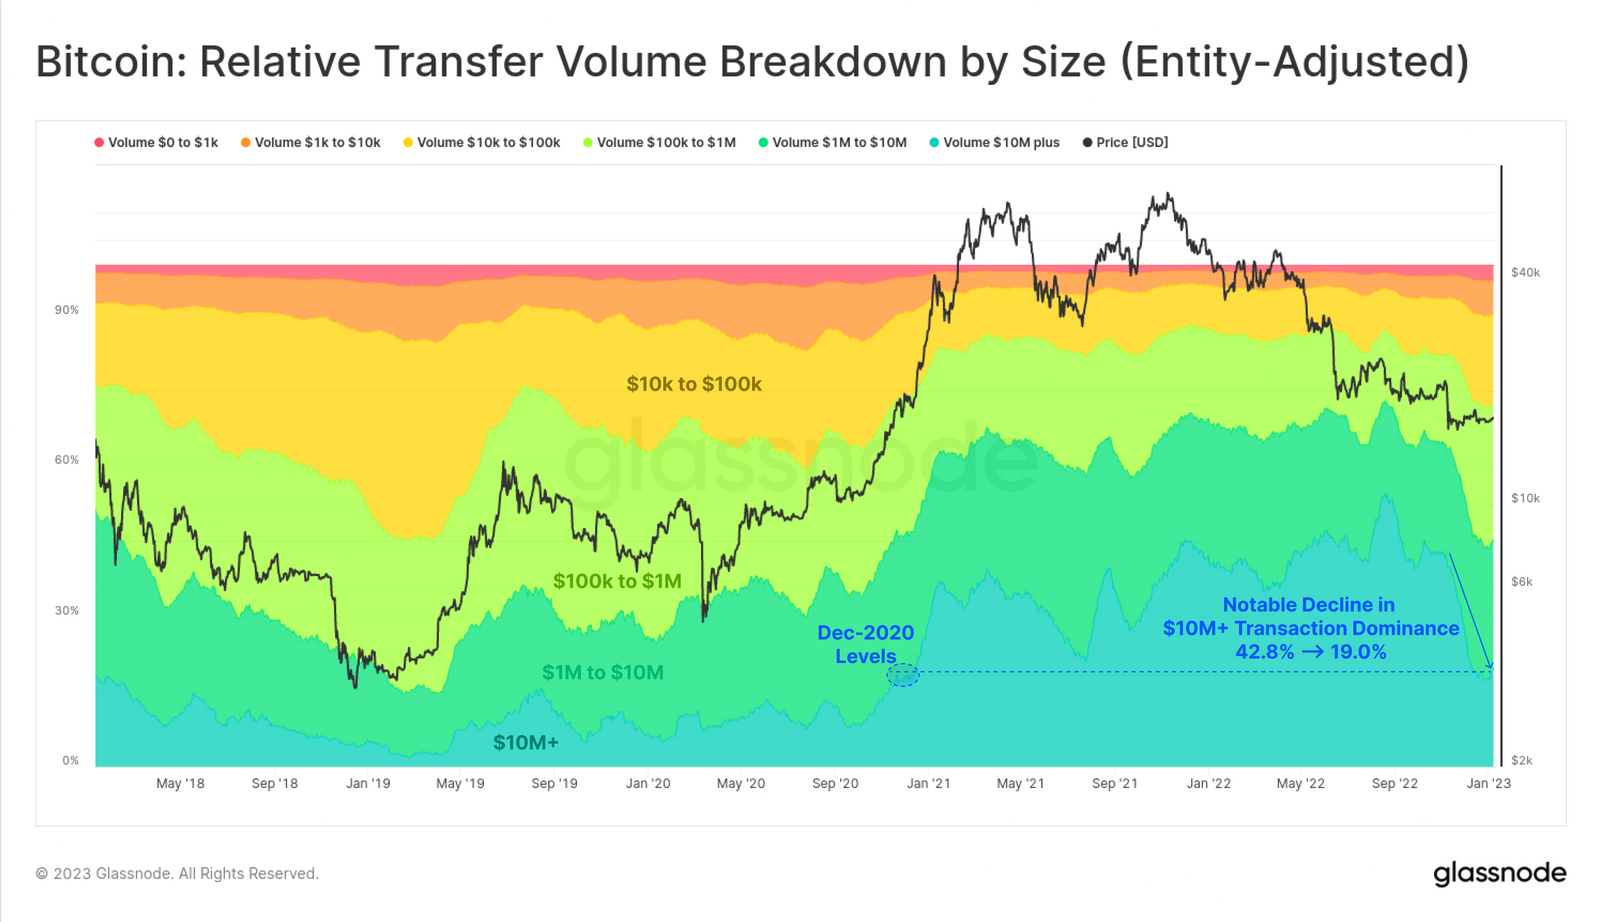
We can see this in the relative breakdown of transfer volume, where the dominance of $10M+ sized transactions has been a primary contributor to this decline. Large size transfers have fallen from 42.8% dominance prior to the FTX collapse, to just 19.0% today.
This suggests a significant lull in institutional sized capital flows, and perhaps a serious shaking of confidence occurring amongst this cohort. It may also reflect, in part, and sadly, an expulsion of the questionable capital flows associated with the FTX/Alameda entities.
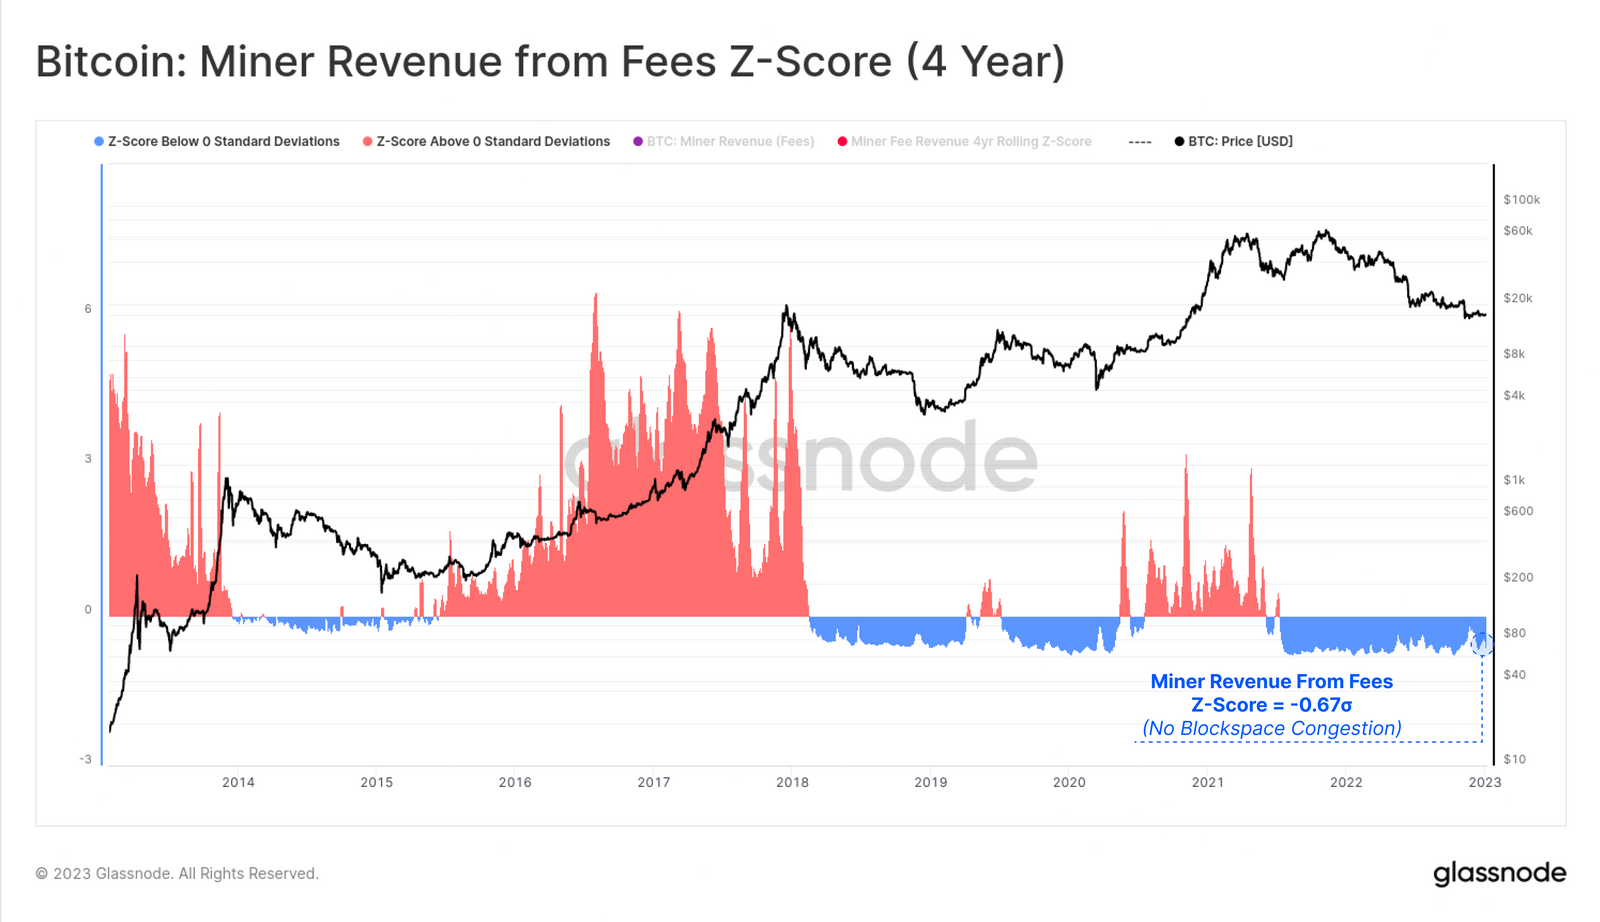
Demand for Bitcoin blockspace continues to remain weak, with negligible upwards pressure on the Bitcoin fee market. The 4-yr Z-Score of miner revenues is yet to make any noteworthy progress back towards positive territory, and remains -0.67 standard deviations below the mean.
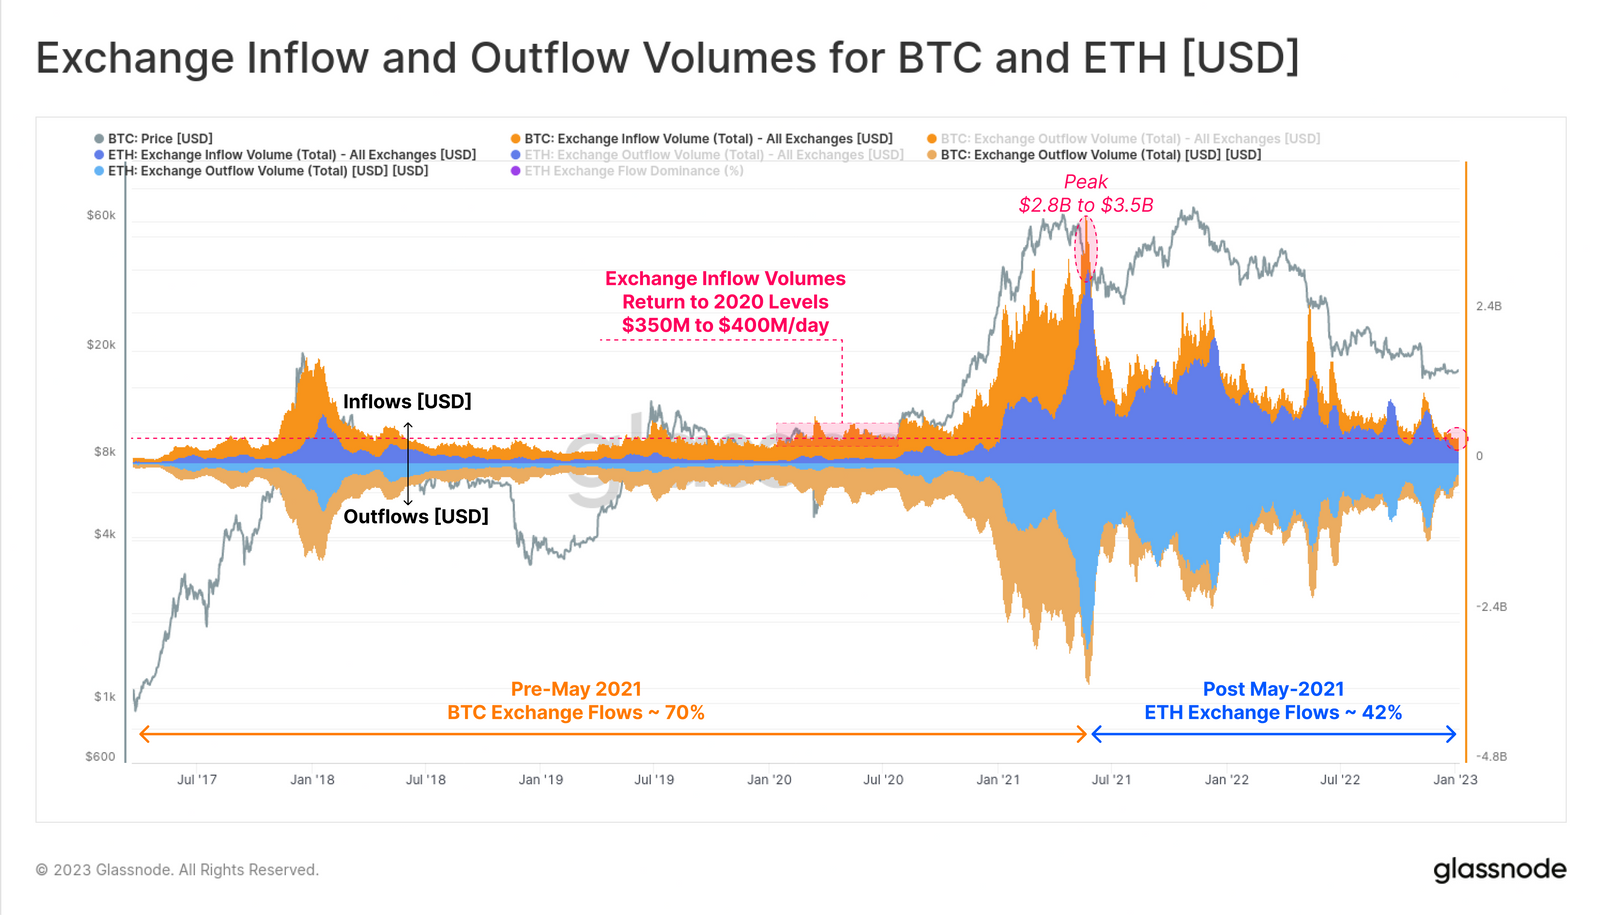
This quiet on-chain activity can also be seen in the compressing USD denominated exchange flows for both BTC and ETH. The chart below presents Inflows (+ve) and Outflows (-ve) for Bitcoin 🟠 and Ether 🔵 related to exchange entities we monitor.
Bitcoin inflow volumes are currently between $350M and $400M/day, which are a far cry from the multi-billion dollar levels seen throughout in 2021-22. Also of note is the expanded scale of ETH exchange flows, which have grown from just 30% dominance up to May-2021, to 42% today. Note ETH dominance here considers the total USD exchange flows (in and out), and calculated as ETH / (BTC+ETH).
Ethereum Remains Quiet
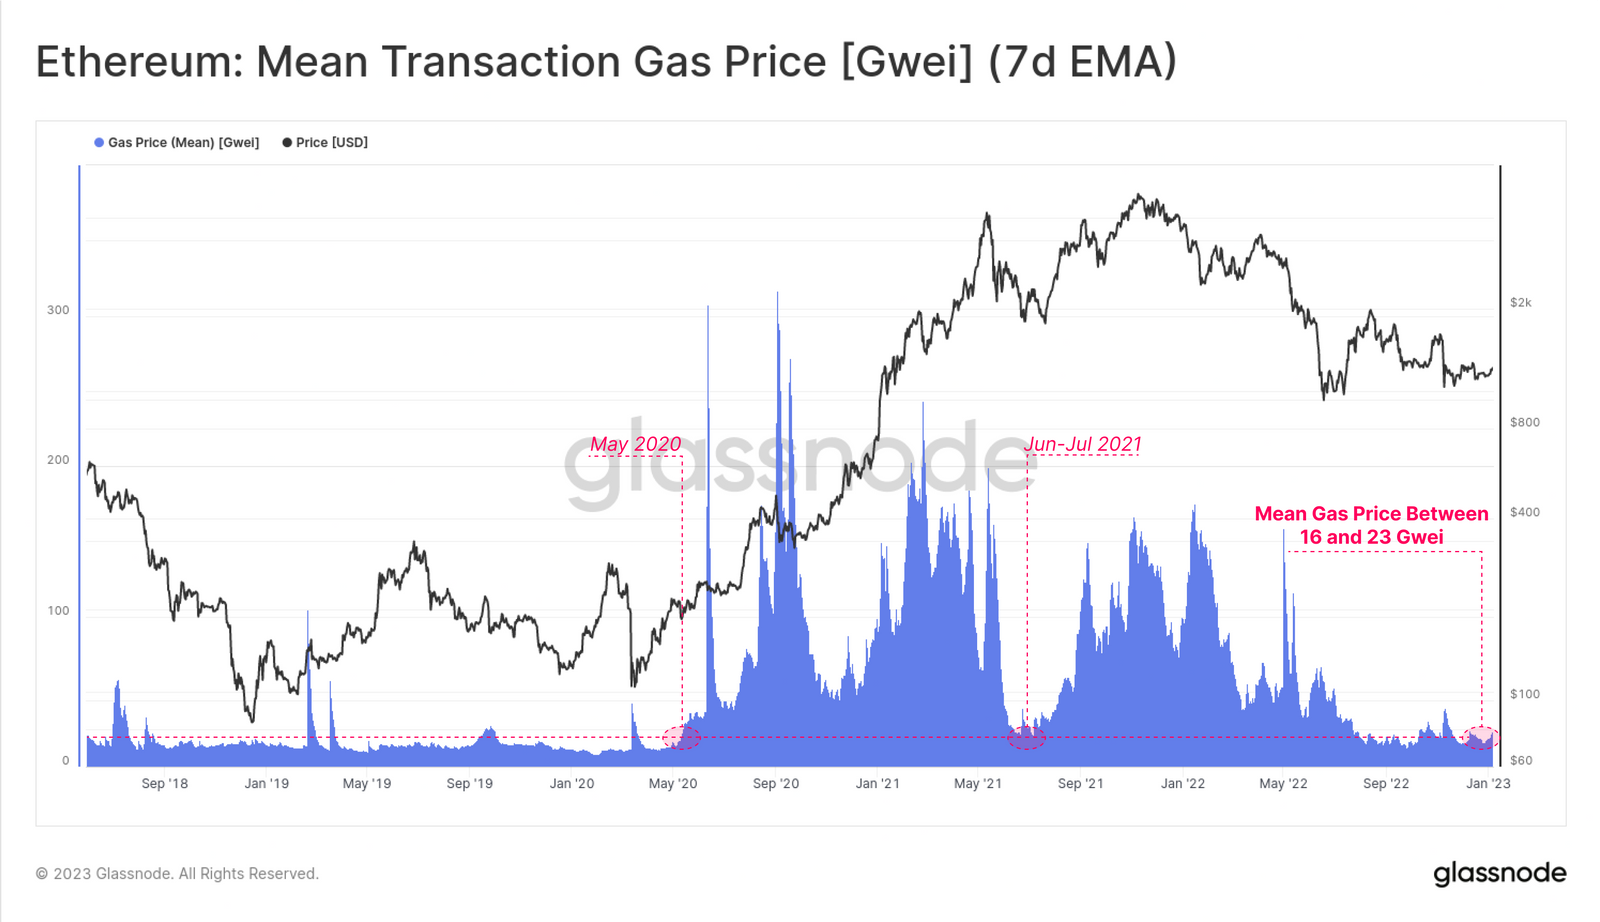
The Bitcoin network is not alone in experiencing this extremely light on-chain utilization, with the average gas price paid on the Ethereum chain remaining near cycle lows. The mean gas price since September has ranged between 16 and 23 Gwei, levels last seen during in the June-July 2021 consolidation, and in May 2020 shortly after the COVID market panic.
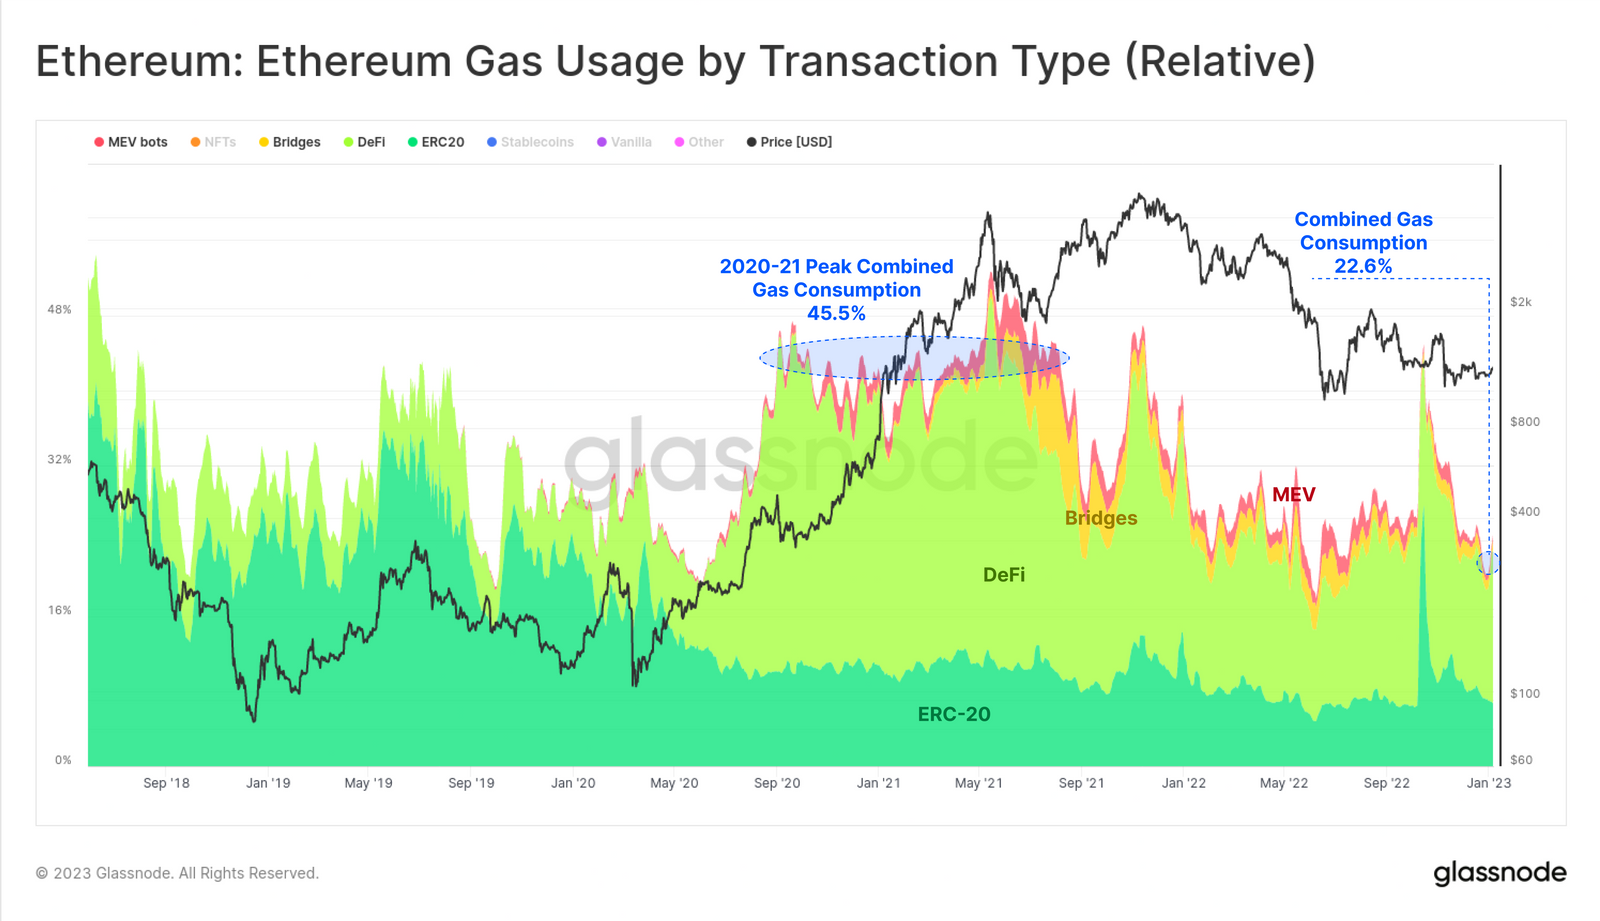
Breaking down gas consumption by sector, we can see that several domains are declining in their relative gas consumption dominance: MEV bots, Bridges, DeFi protocols, and ERC-20 tokens. Between Sept-2020 and Sept-2021, these four sectors represented a combined 45.5% of gas consumption, with DeFi protocols commanding the majority of this.
Today however, these four sectors represent for less than half of their peak dominance, and account for 22.6% of network gas consumption.
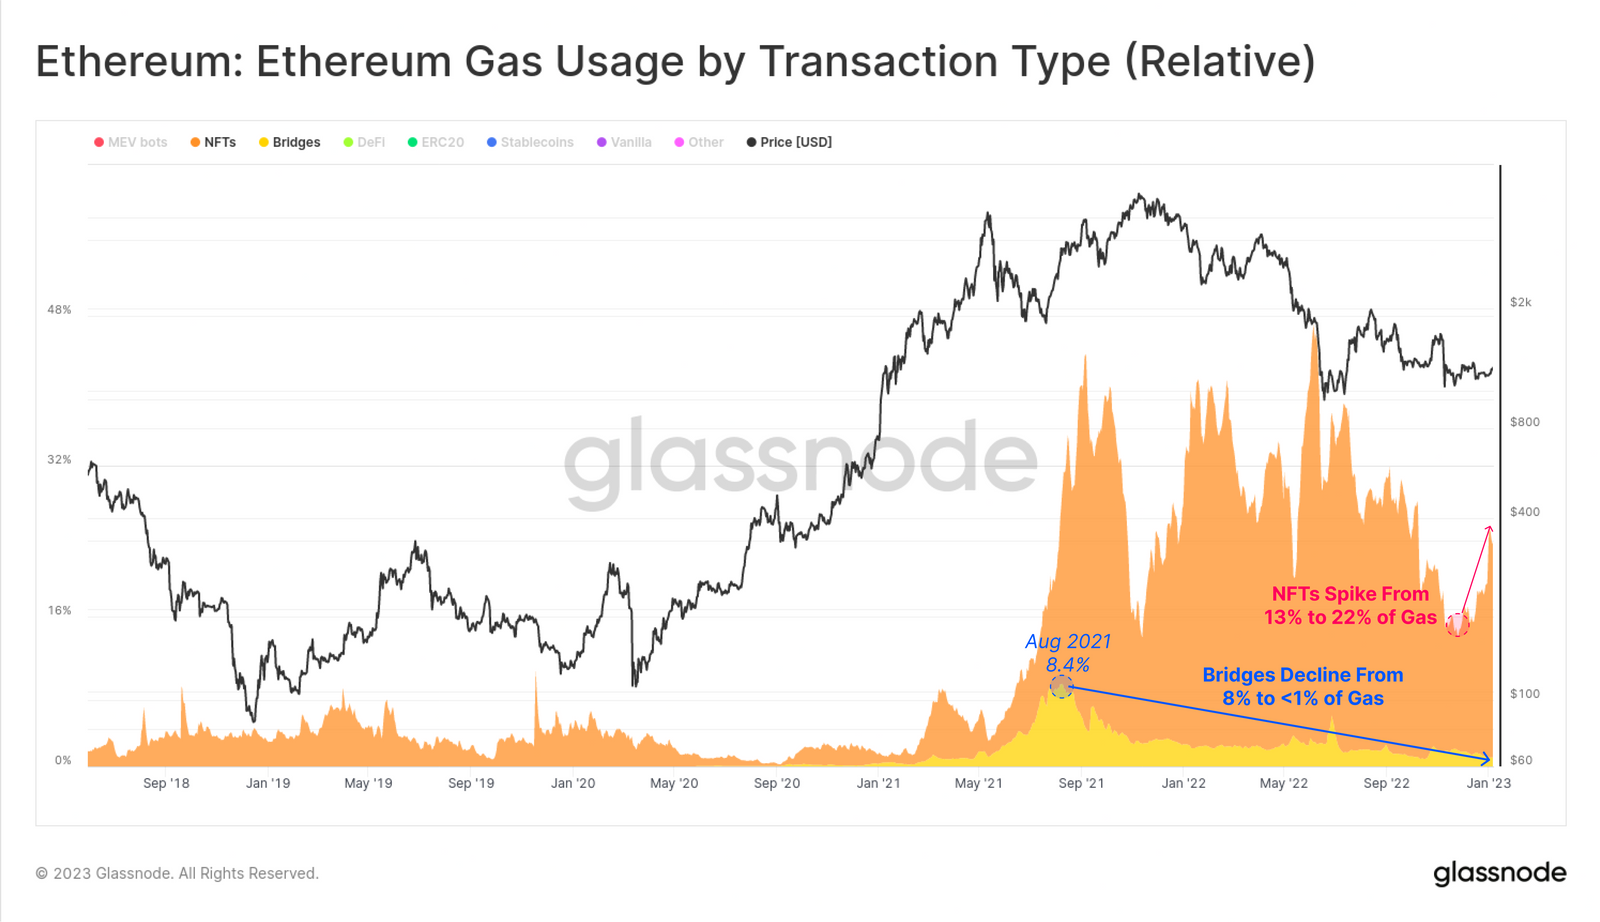
The sector which has seen a recent influx of activity and attention are NFTs, which dominated gas consumption throughout 2022, and have recently increased from 13% to 22% dominance.
By and large, the leading NFT markets and projects have maintained a primary foothold on the Ethereum main-chain, and as yet, there has not been a notable migration of existing NFTs towards bridges and other chains. This is potentially a result of several high profile bridge hacks throughout 2022, as well as lower gas fees on main-chain at present.
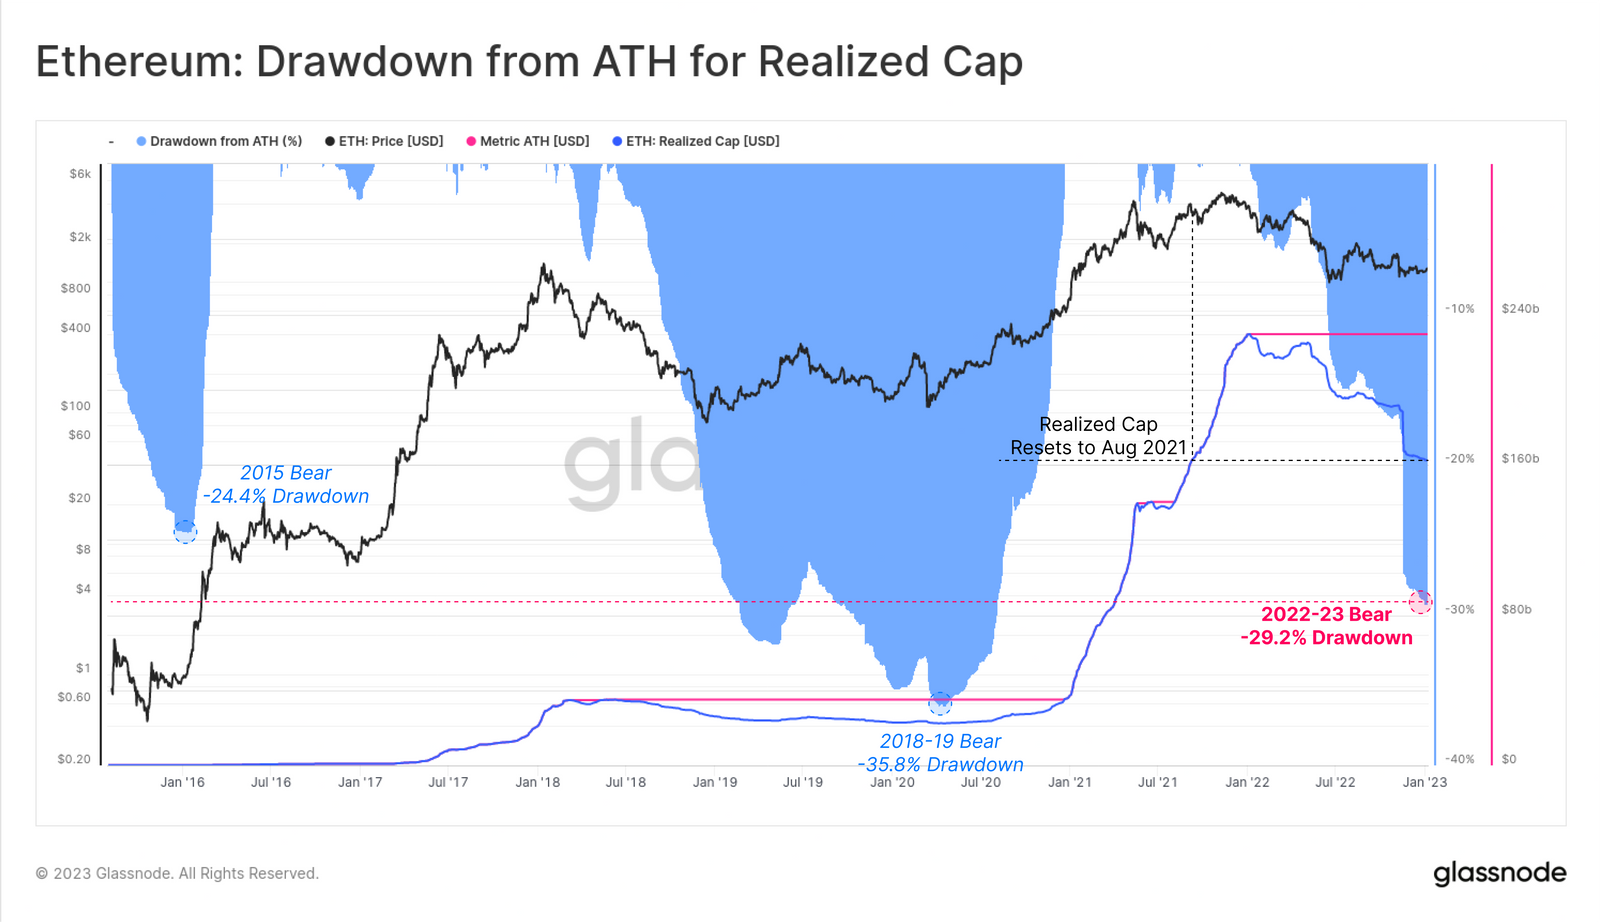
A Realized Drawdown
The Realized Cap remains one of the most important metrics in on-chain analysis, providing an elegant tool to monitor capital inflows and outflows from digital assets. The underlying assumption being that when coins transact, their value is pricestamped, and thus avoids valuing long lost coins (like Satoshi's) at the spot price, as it is via Market Cap.
Whilst not perfect, the Realized Cap is arguably one of the better tools available to measure true capital inflows, to compare valuations between assets. It acts to both filter out lost coins, partially account for volume churn (where the same coins constantly transact), and better reflects the true invested value by the market.
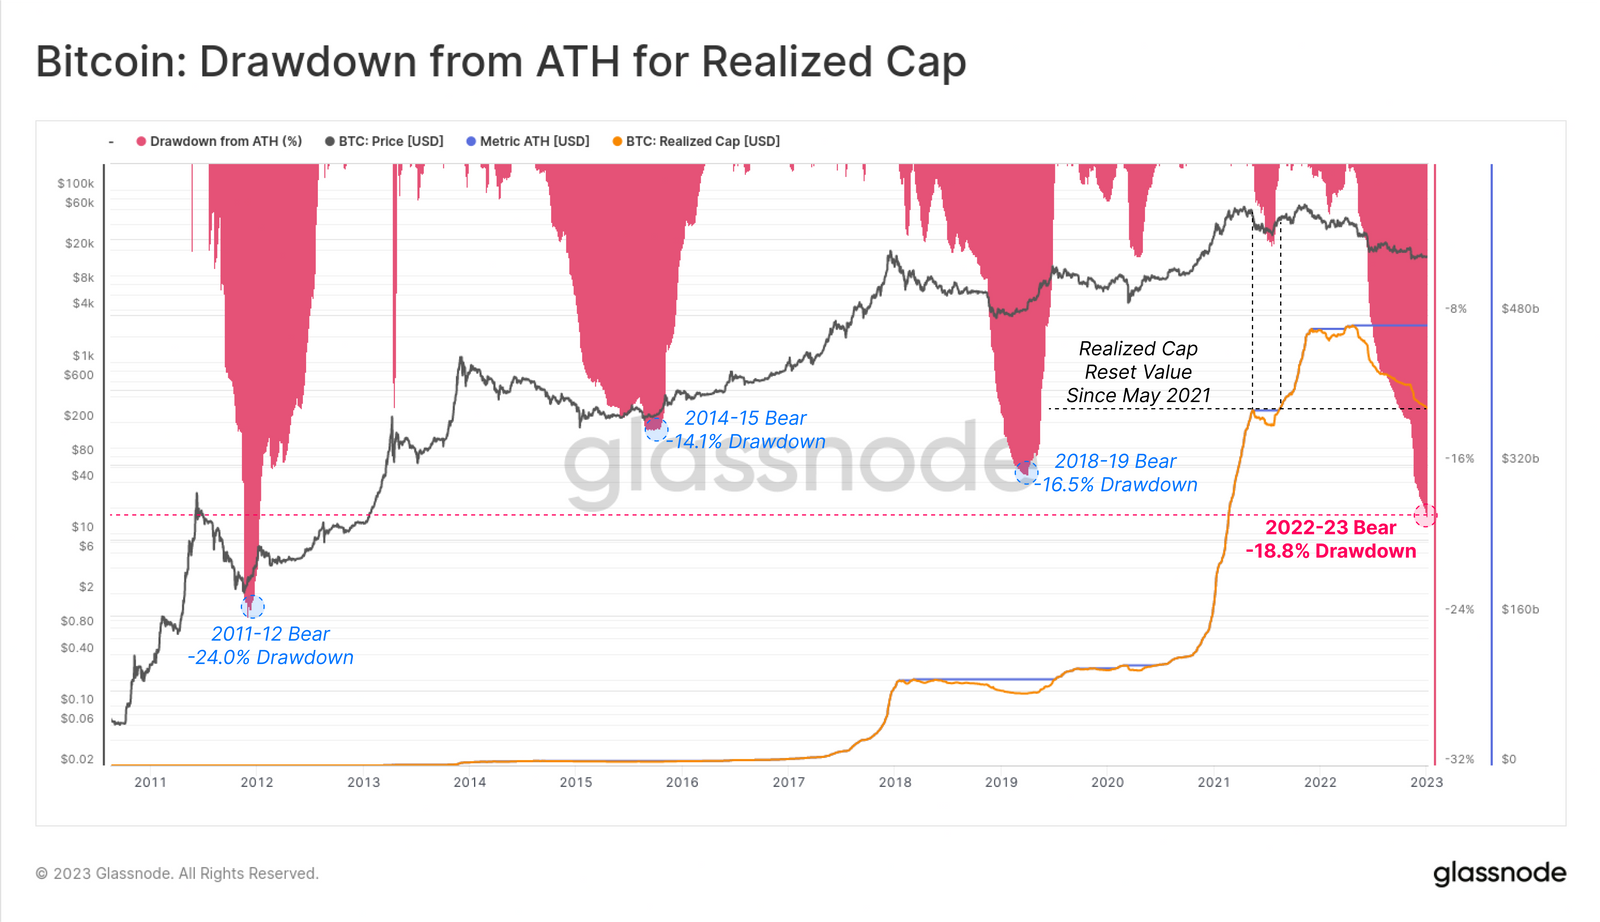
With this as context, the Bitcoin Realized Cap has declined by -18.8% since the ATH, representing a net capital outflow of -$88.4B from the network. This makes for the second largest relative decline in history, and the largest in terms of USD realized losses. This resets the Realized cap to May 2021 levels, expelling all invested value throughout the second peak of H2-2021.
The Ethereum Realized Cap has drawndown by an even larger relative scale, declining by -29.2% since the ATH set in Jan-2022. Ether investors have locked in a total of -$67.1B in net realized losses over the course of 2022.
This also puts the prevailing bear market as the worst in history on a USD denominated realized loss basis, but not yet on a relative scale, eclipsed by the 2018-19 bear market at a 35.8% drawdown.
Live Advanced Chart
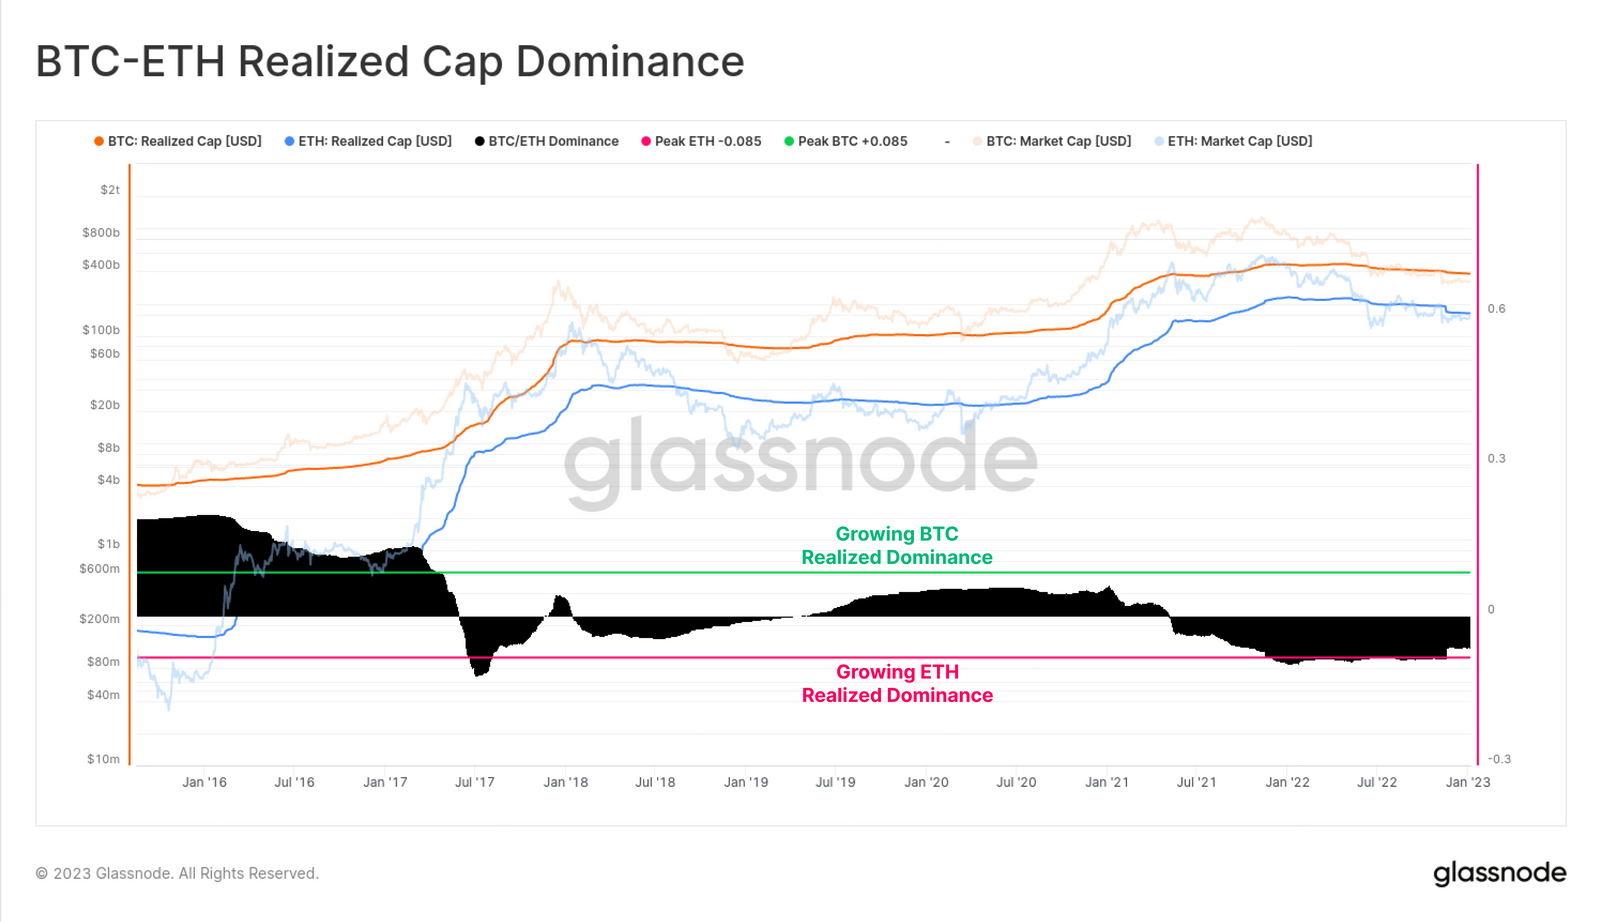
Finally, we close with a new interpretation of market dominance, aimed at addressing some of the aforementioned shortcomings associated with Market Cap dominance. The principle issue with the widely used 'Bitcoin dominance' metric is that the market cap of relatively illiquid tokens are prone to manipulation (such as FTT and others supported by the FTX entity). As such, entities with large and often illiquid stakes can support inflated valuations on paper, but which diverge significantly from underlying market realities.
The model below presents the simplest implementation of Realized Cap Dominance, which is a counterpart to the the more traditional Market Cap Dominance. It is designed to track the relative structural capital inflow/outflows across the two major and most liquid digital assets, BTC and ETH.
This tool, and principle can be applied to any basket of coins and tokens to track structural changes in dominance, better reflecting real capital flows, and discounting illiquid supply (such as un-vested token allocations, protocol treasuries, or lost supply).
Summary and Conclusions
The 2022-23 holiday period has been historically quiet, and it is rare for such conditions to stick around for long. Past occasions where BTC and ETH volatility was this low have preceded extremely volatile market environments, with past examples trading both higher and lower.
On-chain activity for the two majors remains extremely weak, despite a short-term bump following FTX. Using both on-chain activity, and realized cap drawdowns, it is safe to say that the excesses of H2-2021 has been largely expelled from the system. This process has been painful for investors, however has brought market valuations closer to their underlying fundamentals.
Thank you for returning as a reader of The Week On-chain, and we look forward to documenting all that 2023 holds in store for us.