1. BTC continued its decline
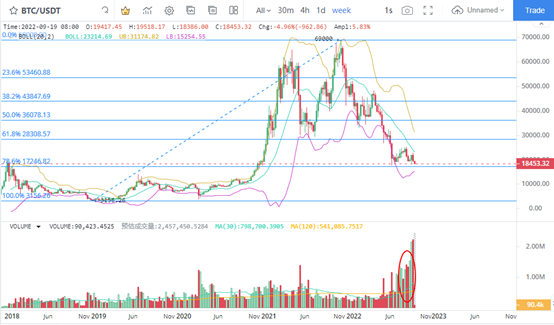
BTC showed signs of falling at the weekly K line level. The price not only continued to weaken at the interval low, but also showed signs of further falling below the previous lowest price. In terms of trading volume, the recent weekly K line shows a very obvious sign of turnover recovery, which makes BTC have fallen below the transaction cost price of more investors unconsciously, which means that the possibility of accelerating the price decline trend is high. Considering that the previous low is 17622 dollars, the BT price may easily reach the price platform of 10000 to 14000 dollars in 2020 if there is any sign of breaking.
2. Increase of BTC clamping disc
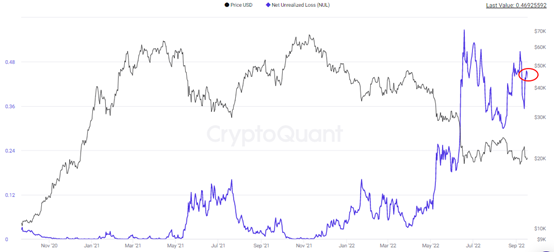
The unconfirmed BTC hold up rose to a high level, very close to the loss value of 0.5. On September 18, the value rebounded to a short-term high of 0.469. Although the unconfirmed loss of BTC once reached 0.566 on June 18, the average value remained above 0.5. Therefore, if the BTC price can continue to retreat this time, its unconfirmed loss will increase significantly, which will continue to push the BTC price down.
3. BTC average selling pressure increases
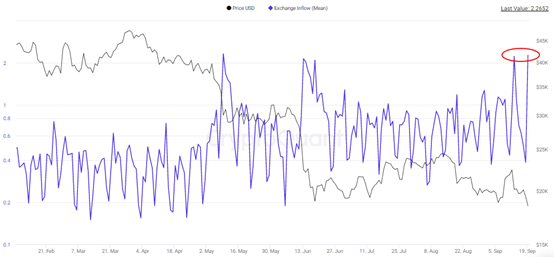
From the average inflow of BTC into the exchange, the recent value has been rising to the peak of the year, which means that the growth of BTC selling pressure has not been formed in a short time, but the result of continuous growth in the past two months. On the peak, the average number of BTCs flowing into the exchange on September 13 increased to 2.23 BTCs, and it continued to rise to around 2.26 on September 19. From the performance of the average number of BTCs flowing into the exchange, it is rare for the number to reach two BTCs in two trading days. This means that BTC is putting pressure on growth in the near future, and the decline is expected to gradually strengthen.
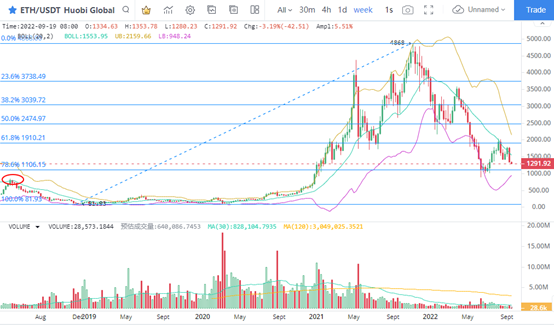
4. ETH price is expected to reach a new low
The ETH price has fallen rapidly in recent years, and the cumulative decline of the K line last week reached 24%. From the confirmation of the support point, in addition to the lowest USD 881 confirmed by ETH recently, the continuous peak of USD 800 in April 2018 is also a relatively strong support point. Nevertheless, the recent price trend of ETH is weak, and the confirmation of the support line needs to be tested by the price rebound.
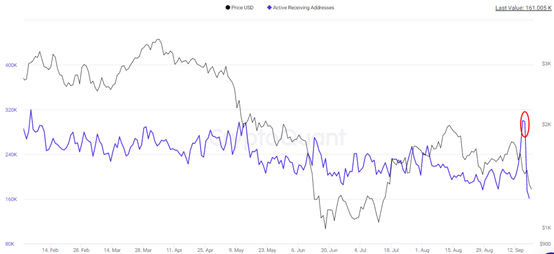
5. The number of ETH receiving addresses rebounded
The number of receiving addresses of ETH rebounded to that of the short line. On September 15 and September 16, the number of receiving addresses reached 300000 and 298000, a significant increase compared with the average value of 210000 in recent March. Accordingly, the price of ETH fell by 10% and 2.54% on the two trading days. That is to say, more small and medium-sized investors obtained the seemingly cheap ETH during the decline of ETH, and the corresponding transaction cost price was between 1434 and 1638 dollars. Therefore, as the decline of ETH price continues to expand and falls below the cost price of short-term small and medium-sized investors, the pace of decline is accelerating.