Solana Price shot up by 8% over the last 24 hours, painting a bullish chart. Over the past week, the altcoin soared almost 17%.
This made Solana one of the top gainers in the past week. Solana has been able to break past its $33 mark and has turned bullish on its chart.
It also formed a bullish pattern, thereby giving hope to traders. Solana might encounter rigid resistance at the $41 price zone.
Many altcoins have managed to flash signs of optimism as Bitcoin started to trot up on its chart.
The technical outlook pointed toward the bulls taking over as demand for Solana shot up. Traders have decided to go long given the price trajectory of Solana.
Solana has been one of the most high-performing crypto assets in recent times.
Despite high demand, if Solana doesn’t move past the $41 price mark, a fall to its closest support level is inevitable over the next trading sessions.
The global cryptocurrency market cap today is $1.12 trillion, with a 1.4% positive change in the last 24 hours.
Solana Price Analysis: One Day Chart
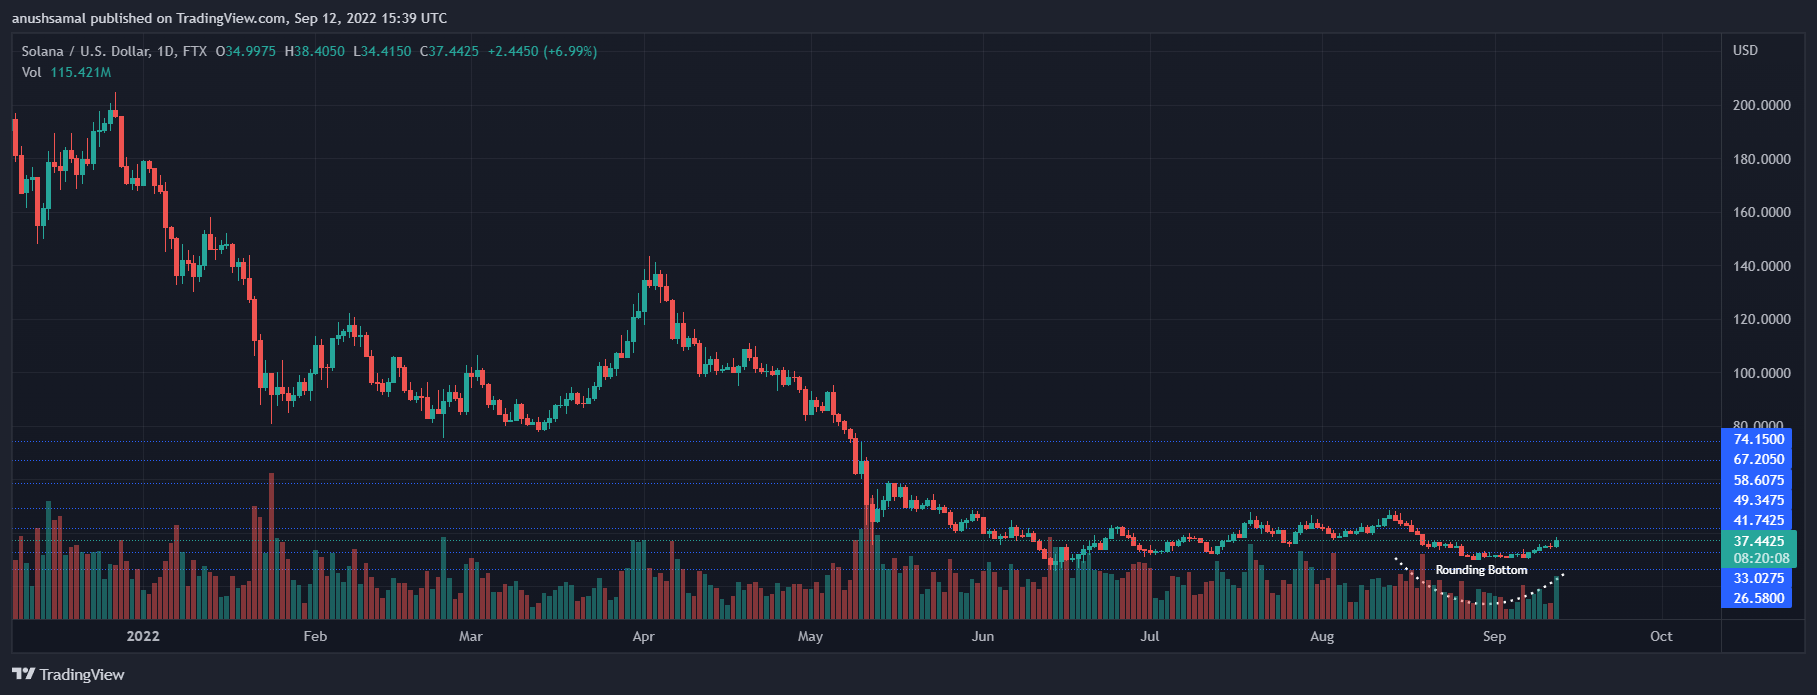
Solana was priced at $37 on the one-day chart | Source: SOLUSD on TradingView SOL was trading at $37 at the time of writing. Over the past few months, SOL has mostly oscillated between $33 and $49, respectively.
In the past 24 hours, Solana propelled 8% and also formed a rounding bottom pattern.
This pattern is tied to bullishness and a continuation of an upward price movement.
Overhead resistance was at $41, and a break above that would put Solana at $49.
A move above $49 could help Solana secure a multi-month high.
The immediate support line was at $33 and a fall below that would bring SOL to $26. The amount of Solana traded increased in the last session, signifying increased buying strength.
Technical Analysis
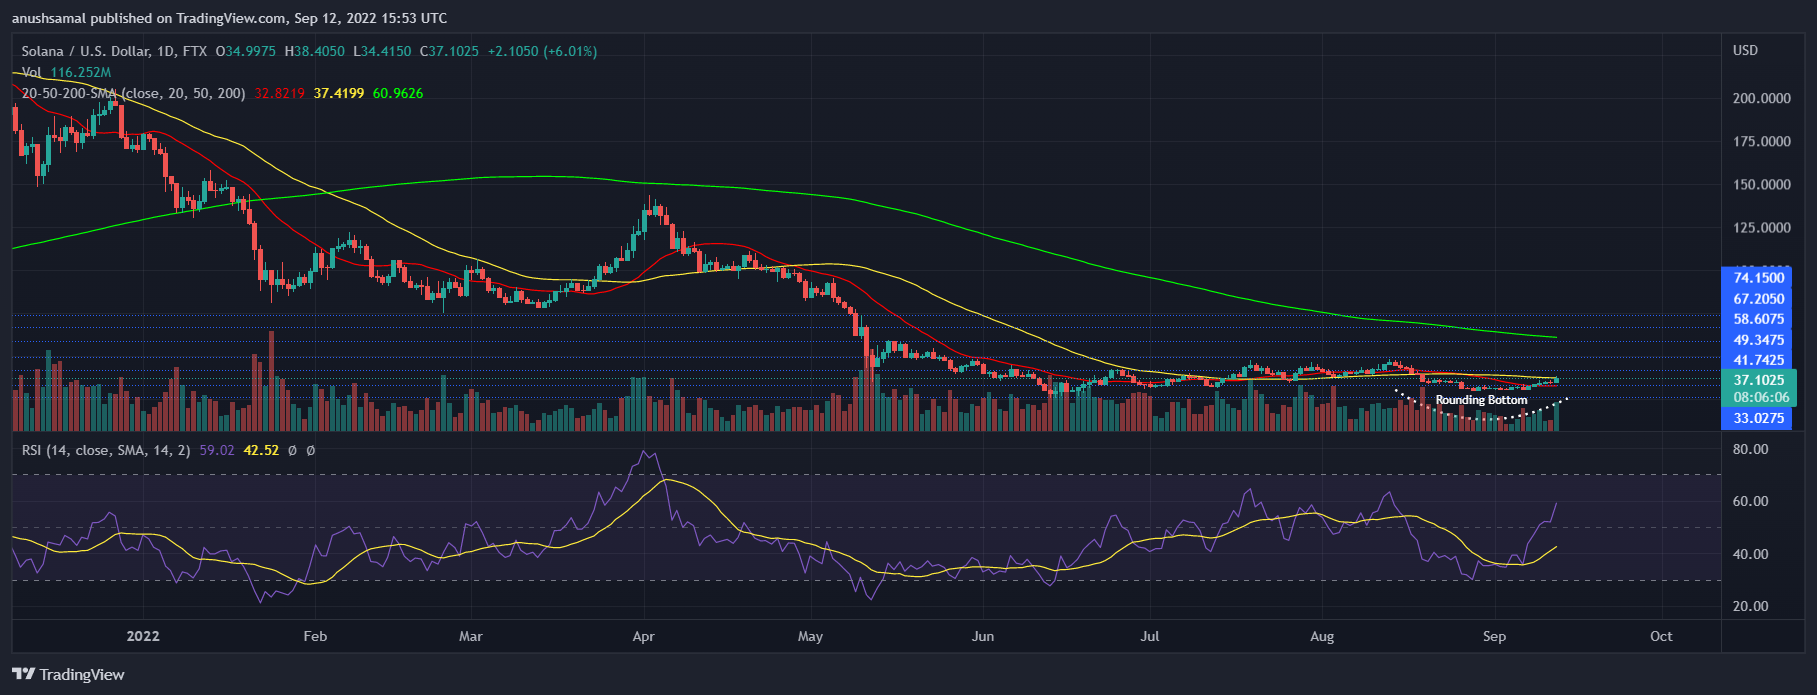
Solana depicted high buying strength on the one-day chart | Source: SOLUSD on TradingView The rounding bottom signifies that the asset has turned bullish and could also remain that way over the next trading sessions.
The technical outlook of Solana price was also on the side of the bulls. The Relative Strength Index shot up above the half-line, which signalled increased buyers compared to sellers.
The increase in demand also made the Solana price move above the 20-SMA. This reading meant that the buyers were driving the price momentum in the market.
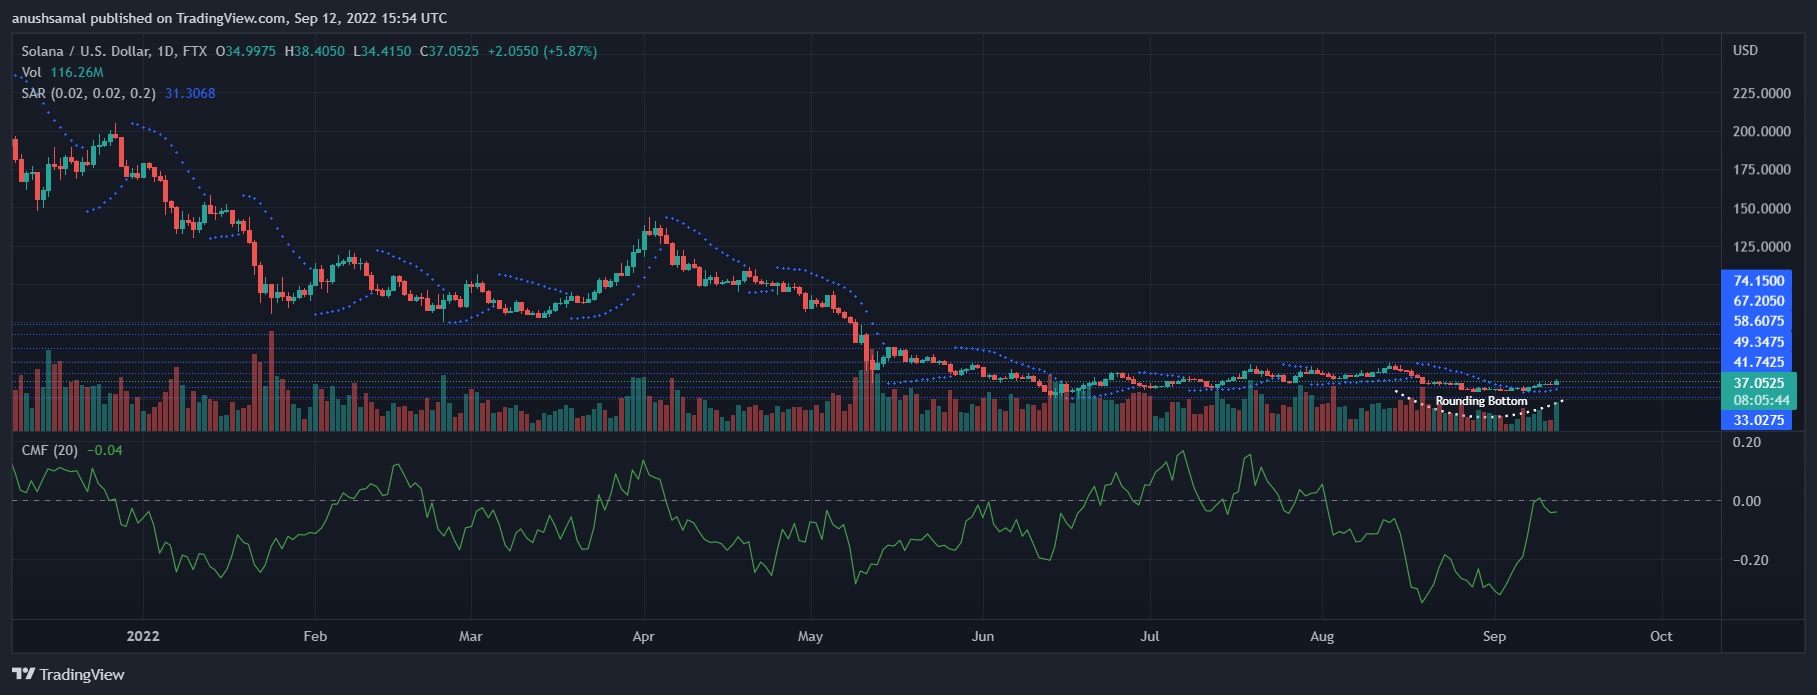
Solana registered a fall in capital inflows on the one-day chart | Source: SOLUSD on TradingView SOL’s other indicators have also indicated that there has been an increased demand over the past week. The Parabolic SAR, which measures the price momentum and direction, was positive.
The dotted lines below the candlesticks meant that Solana price would increase over the next trading sessions.
On the other hand, Chaikin Money Flow, which demonstrates capital inflows compared to outflows, was negative.
CMF was below the half-line, meaning that capital inflows were less than outflows at the time of writing.