Why Chainlink’s $32.6M whale move could shape LINK’s push toward $9

ambcryptoPublié le 2026-07-20Dernière mise à jour le 2026-07-20

Résumé

A transfer of 3.89 million Chainlink (LINK) tokens worth $32.58 million from a Coinbase Institutional wallet to an unknown address drew significant attention, sparking speculation about strategic accumulation by large holders. This coincided with Chainlink's spot exchange netflows turning positive after a prolonged period of outflows, indicating a slight increase in tokens moving to exchanges. However, the overall selling pressure remained limited. Despite improving spot market activity and a price recovery to around $8.35, derivatives data revealed persistent bearish sentiment among futures traders, creating uncertainty. Technically, LINK faces resistance near $8.35. A successful break above this level could target $9, while a rejection might lead to a retest of support near $8.18. The article concludes that while institutional activity and spot buying are supportive, cautious futures positioning continues to challenge the recovery.

A transfer involving 3.89 million Chainlink [LINK] worth $32.58 million drew fresh attention to Chainlink after Whale Alert flagged the transaction. The tokens moved from a Coinbase Institutional wallet to an unknown wallet, encouraging speculation about strategic positioning among large holders rather than immediate exchange selling.

Such transfers often reflect changes in custody or portfolio management rather than outright distribution. However, the movement still highlighted growing institutional participation around LINK.

Large transactions frequently influence market sentiment because traders monitor them for signs of accumulation or distribution. As a result, the transfer placed Chainlink back on investors’ watchlists while the market assessed whether whale activity would support the ongoing recovery.

Exchange inflows returned after months of out flows

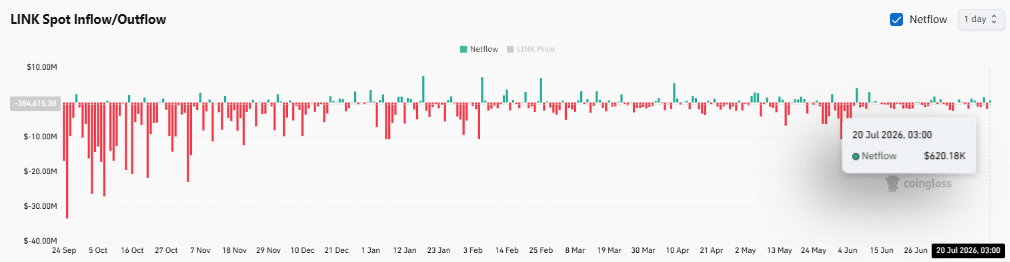
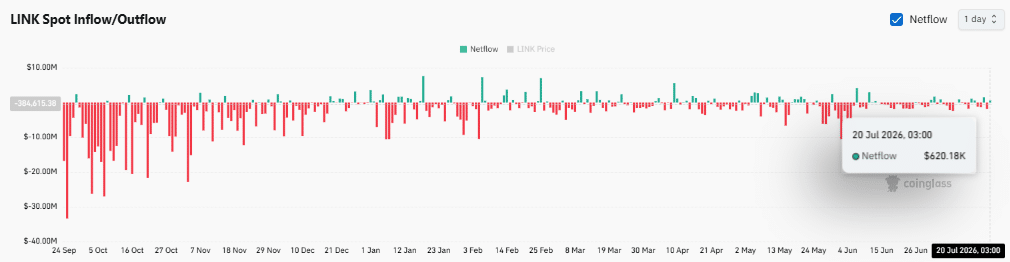
Chainlink’s spot netflows shifted into positive territory after recording an inflow of approximately $620.18K.

The change marked a notable departure from the prolonged period of exchange outflows that had previously reduced available selling supply. Positive netflows indicate that more tokens reached exchanges than left them during the latest session.

However, the relatively modest inflow suggested that exchange-bound supply remained limited instead of overwhelming the market. Even so, the latest reading reflected a change in short-term market behavior, making exchange activity an important metric for assessing LINK’s next directional move.
Source: CoinGlass

Can bearish futures sentiment derail LINK’s recovery?

Derivatives traders maintained a cautious stance despite improving activity in the spot market.

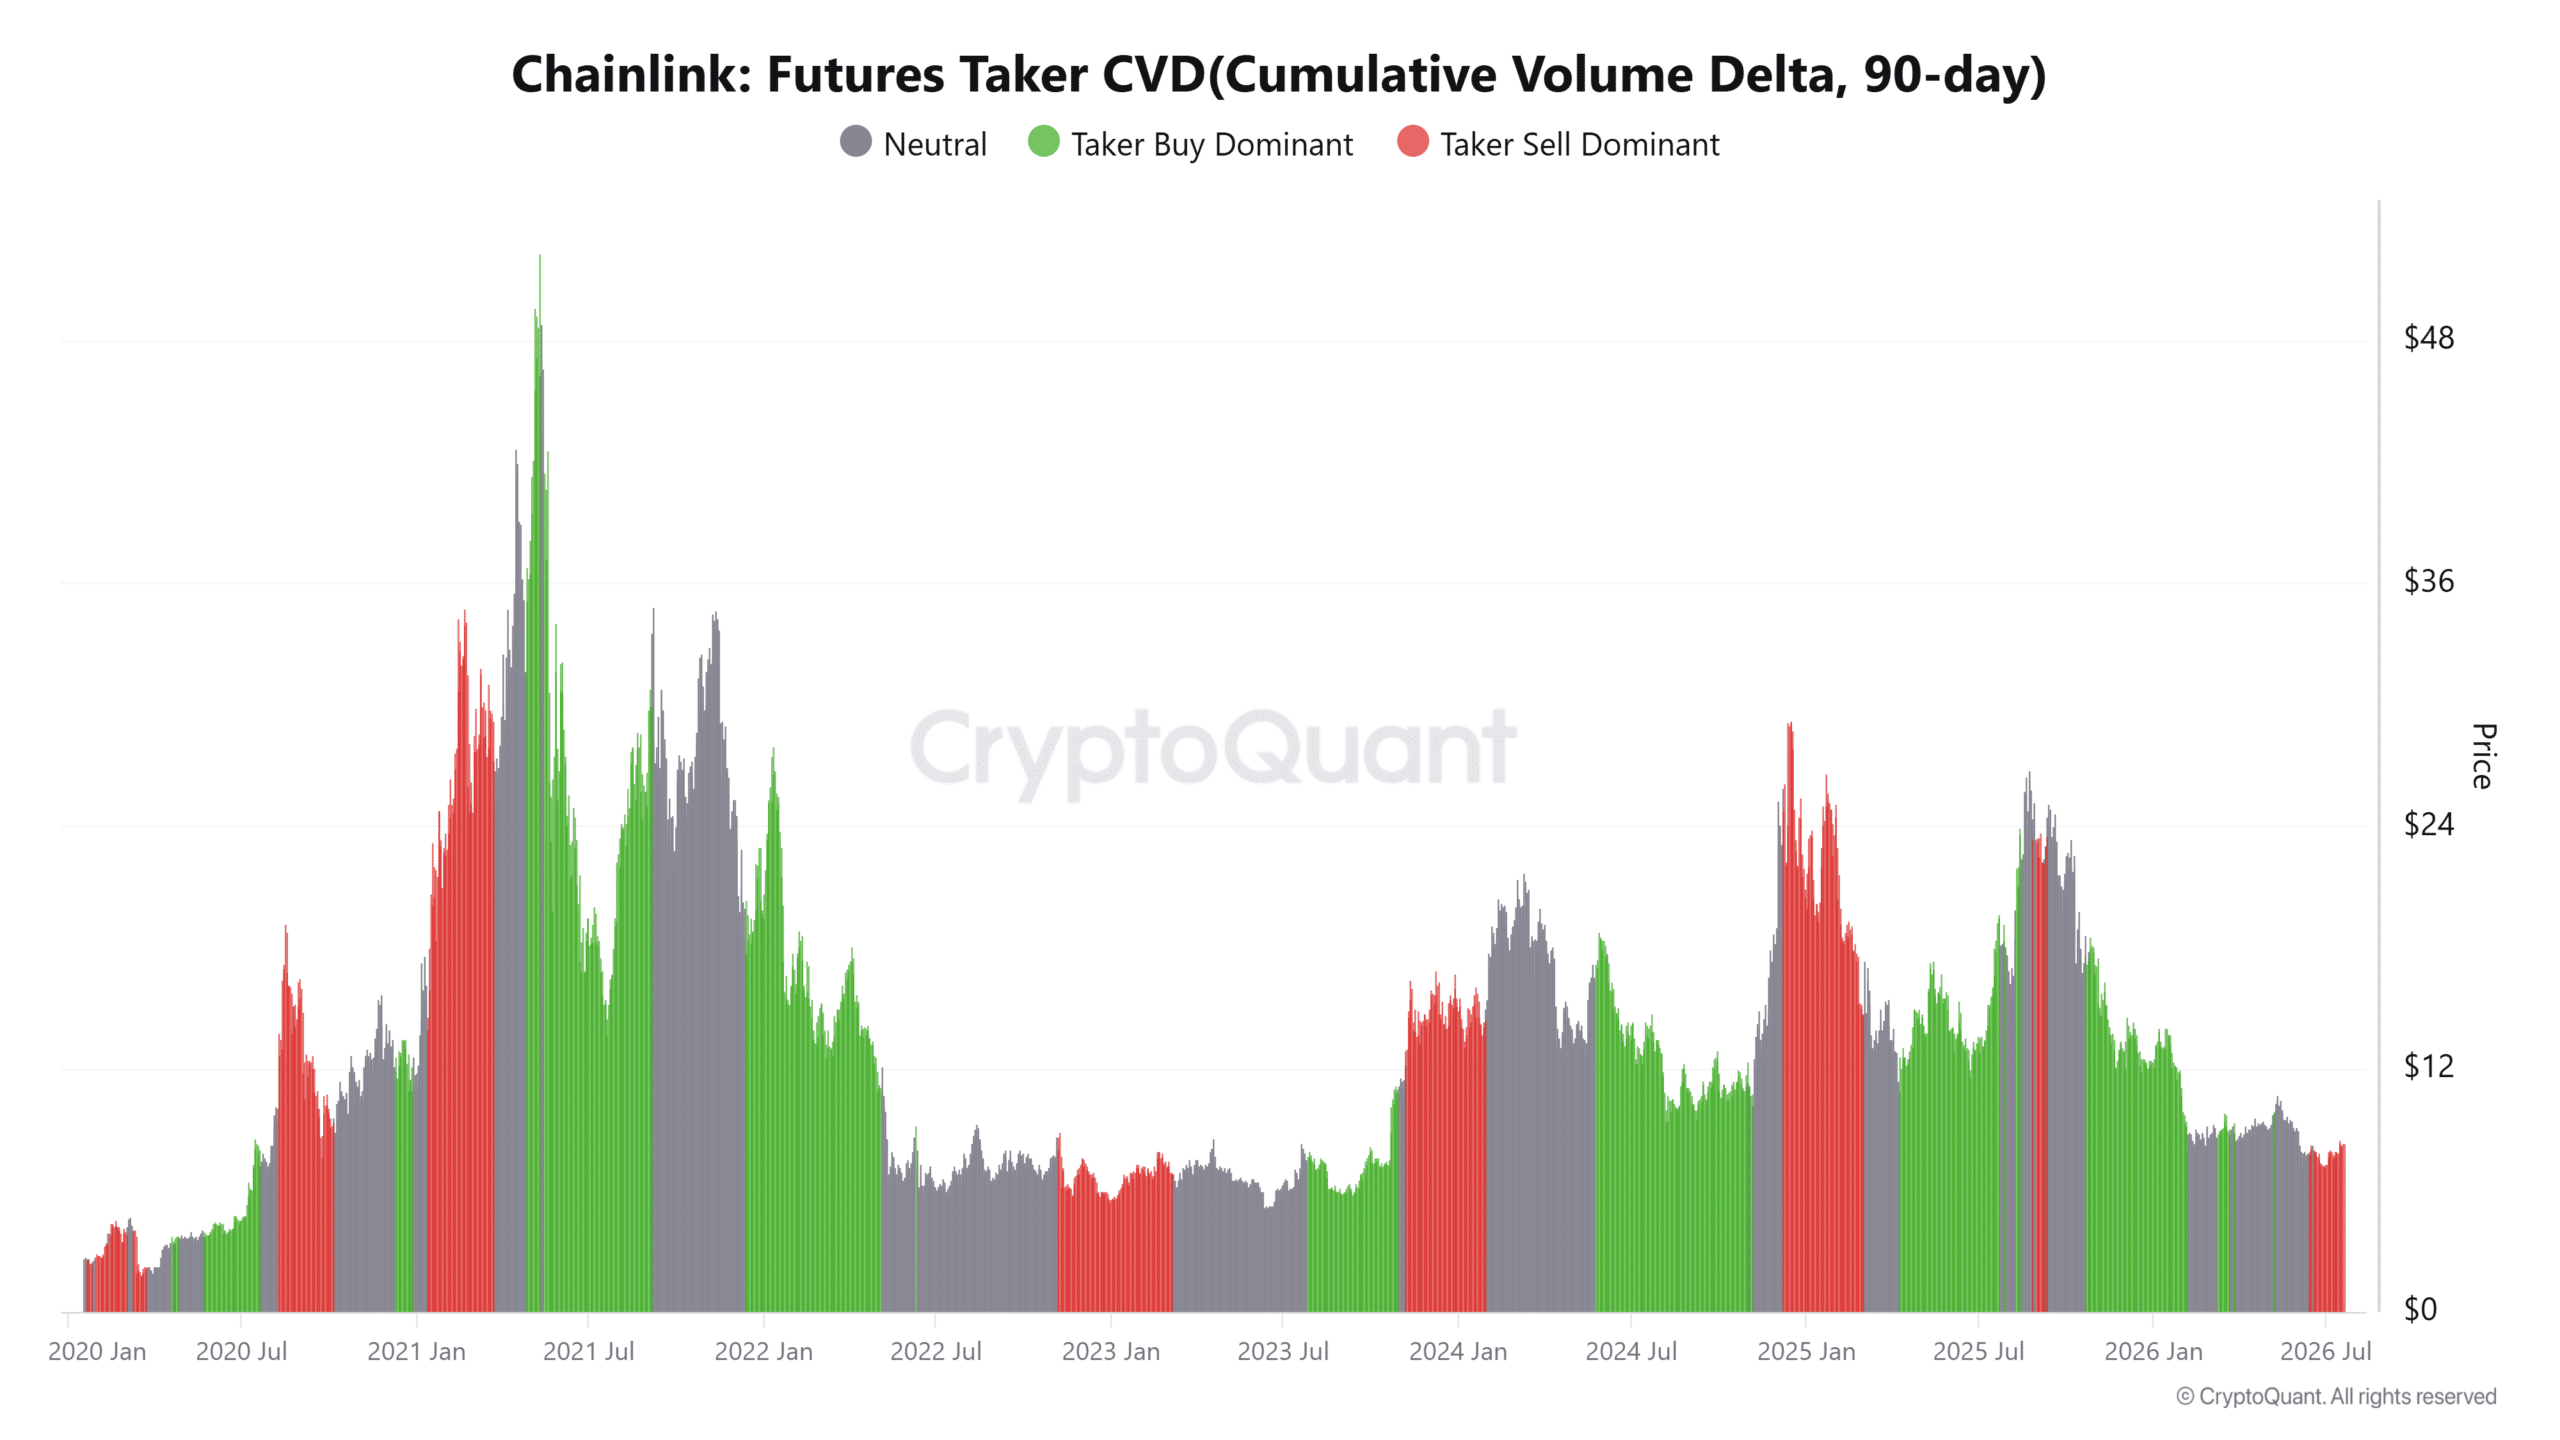
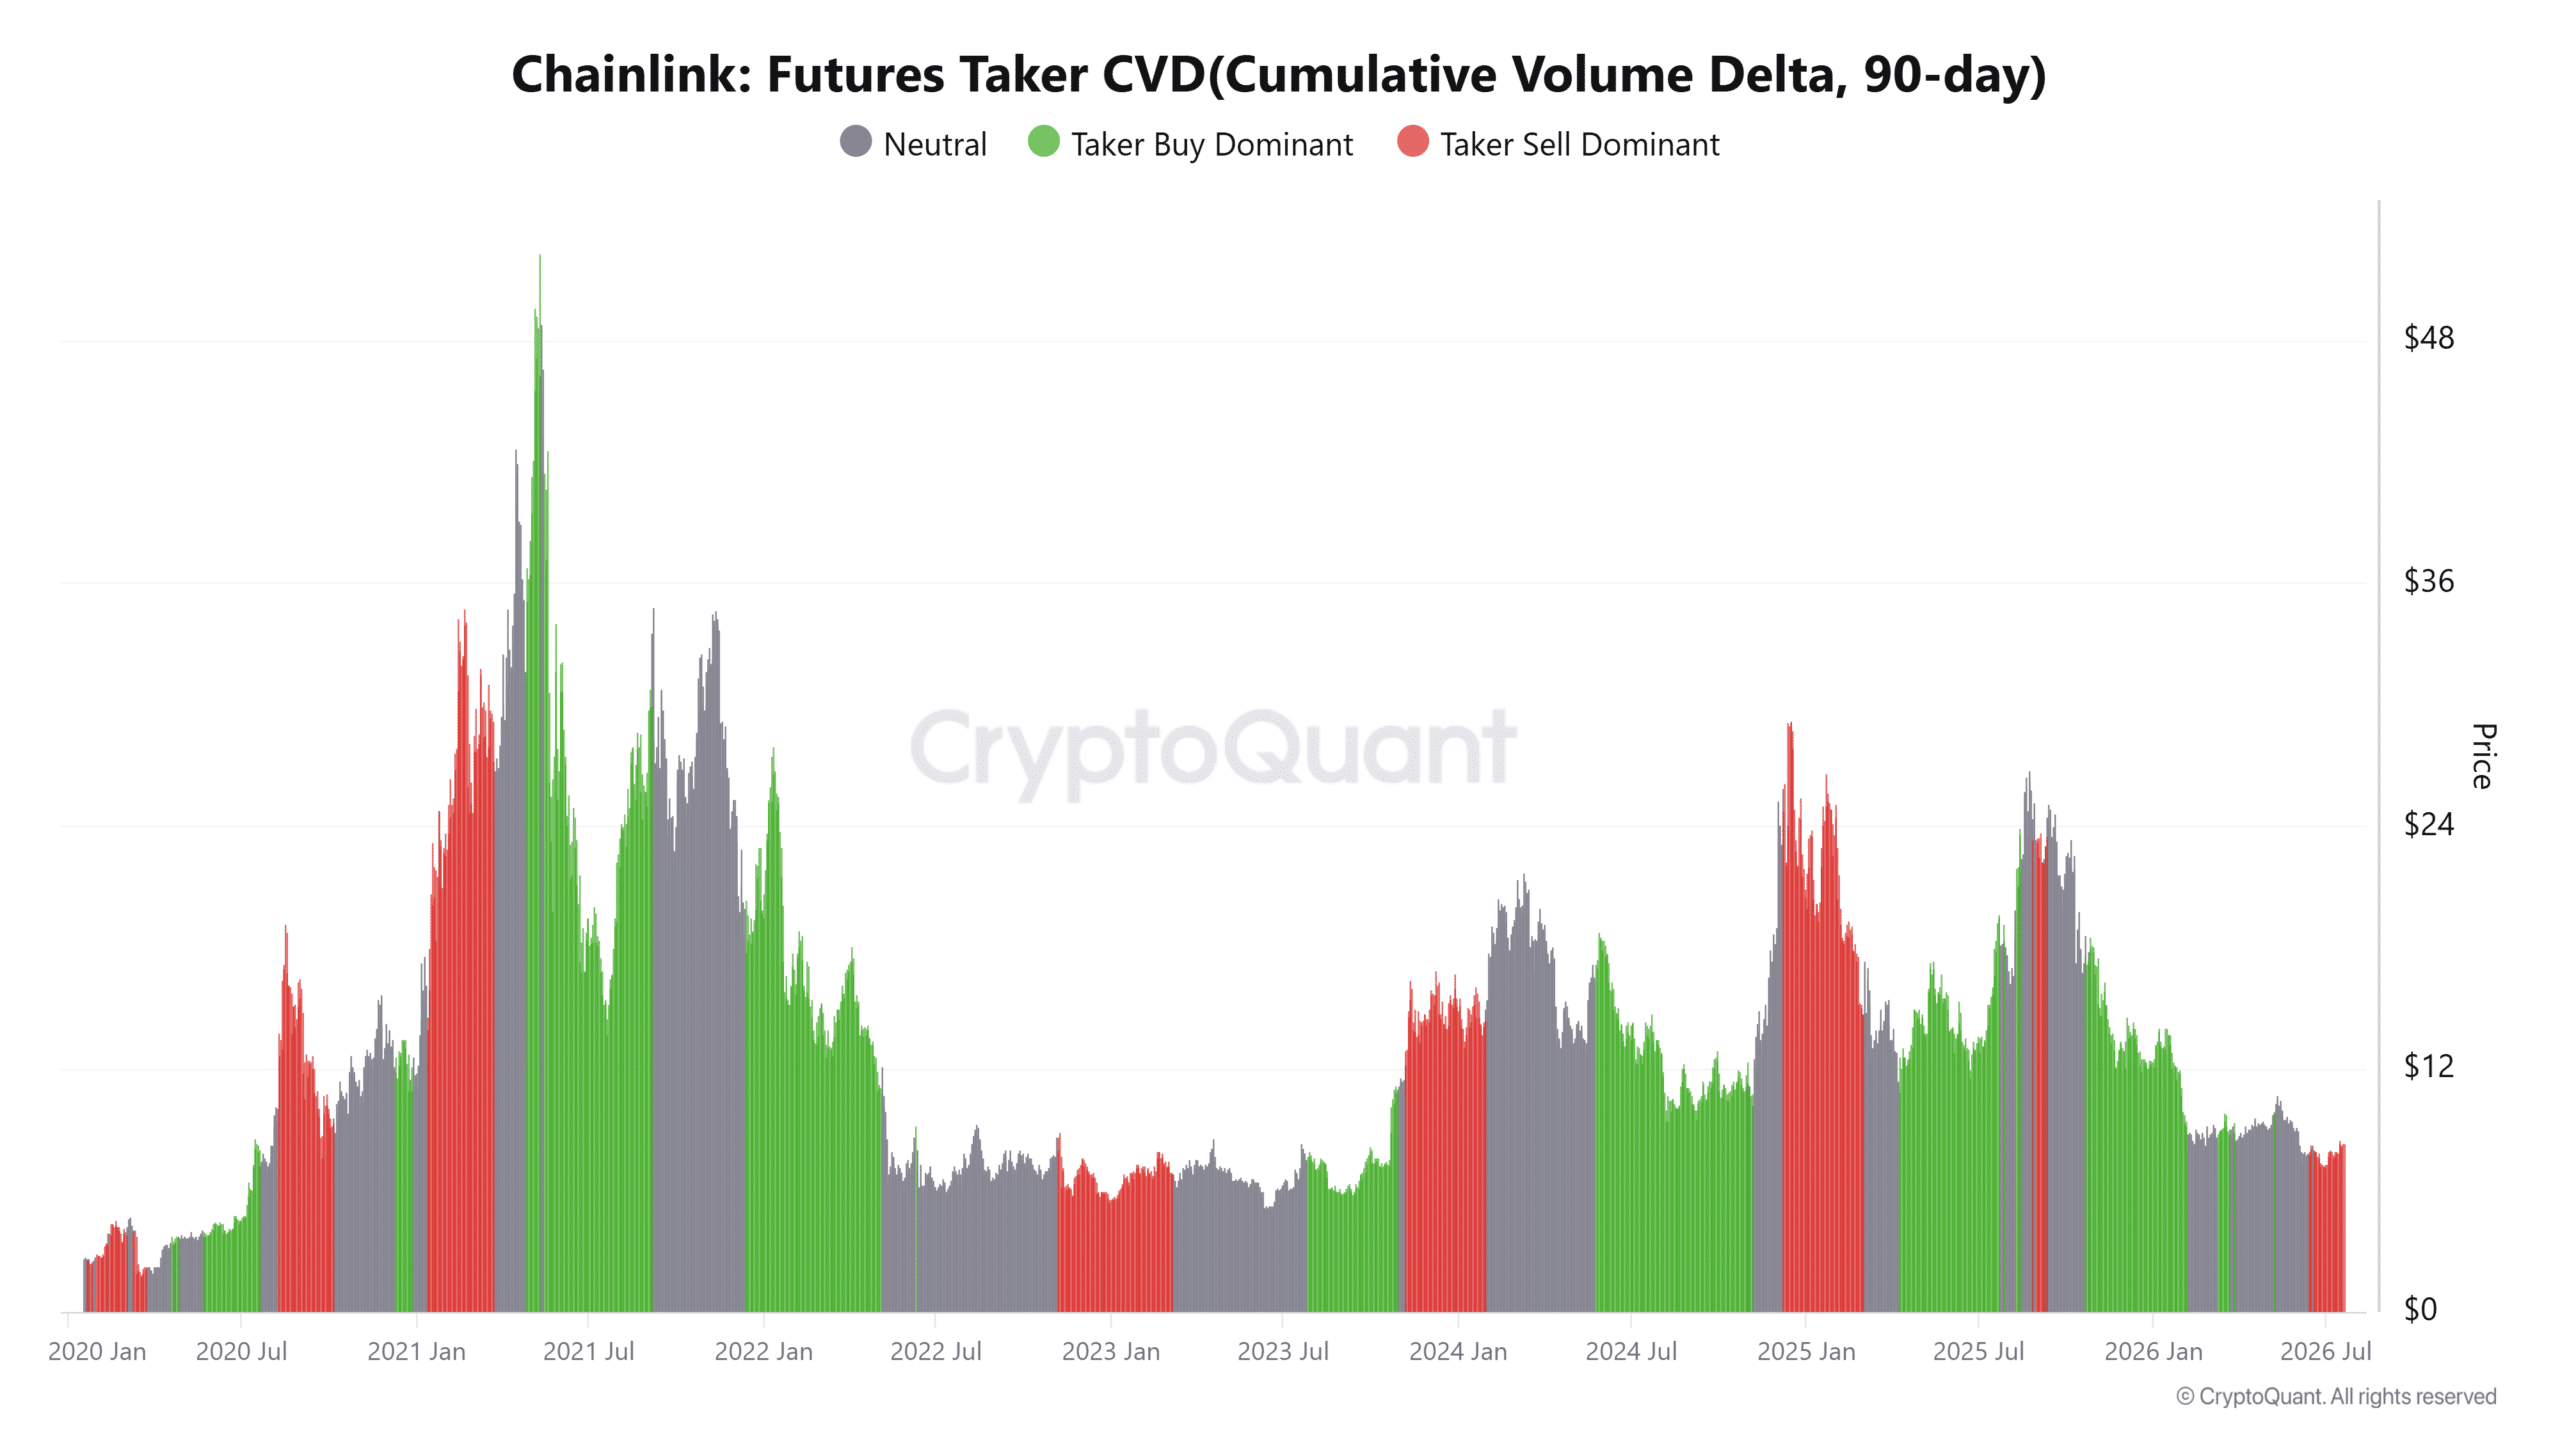
At press time, the 90-day Futures Taker CVD remained seller-dominant, indicating that aggressive market participants continued executing more sell orders than buy orders.

This imbalance suggested bearish conviction persisted among leveraged traders even as institutional wallet activity attracted attention. However, the divergence between spot positioning and futures activity created uncertainty around LINK’s short-term outlook.

Spot participants appeared willing to absorb supply, while futures traders continued favoring downside exposure. Such contrasting behavior often preceded stronger volatility because either buyers eventually overwhelmed sellers or derivatives sentiment pulled prices lower.
Source: CryptoQuant

Chainlink tests resistance as RSI continues improving

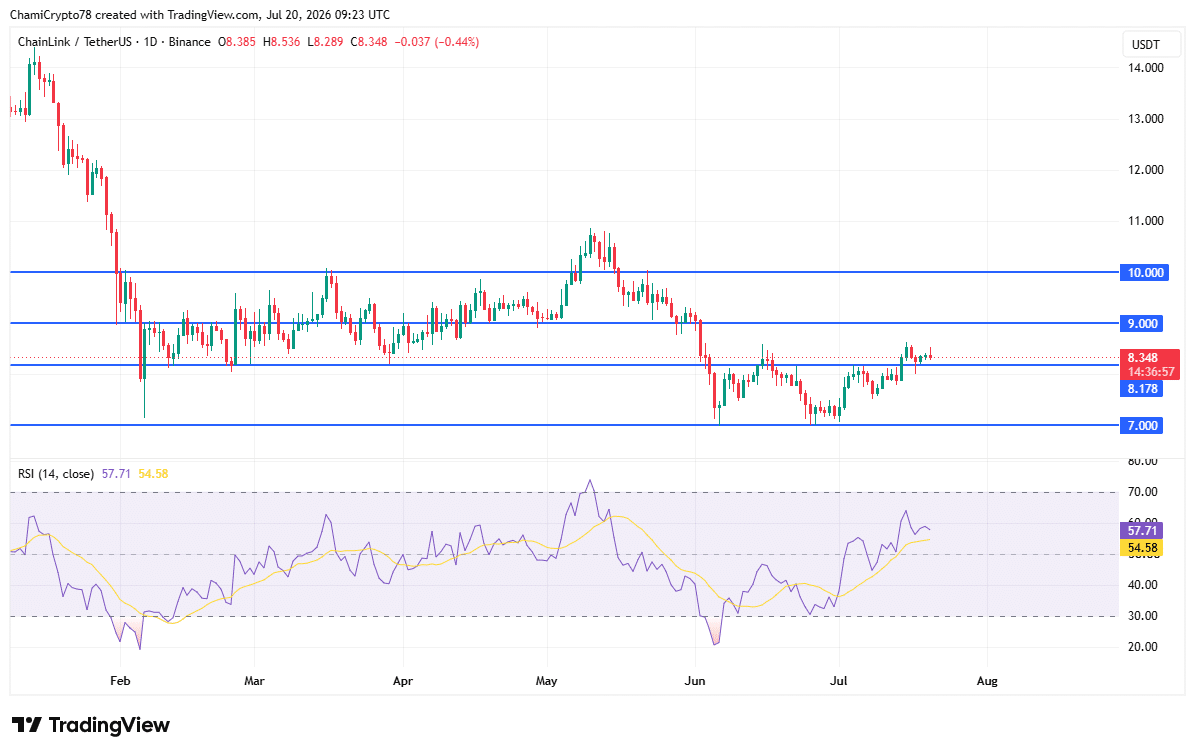
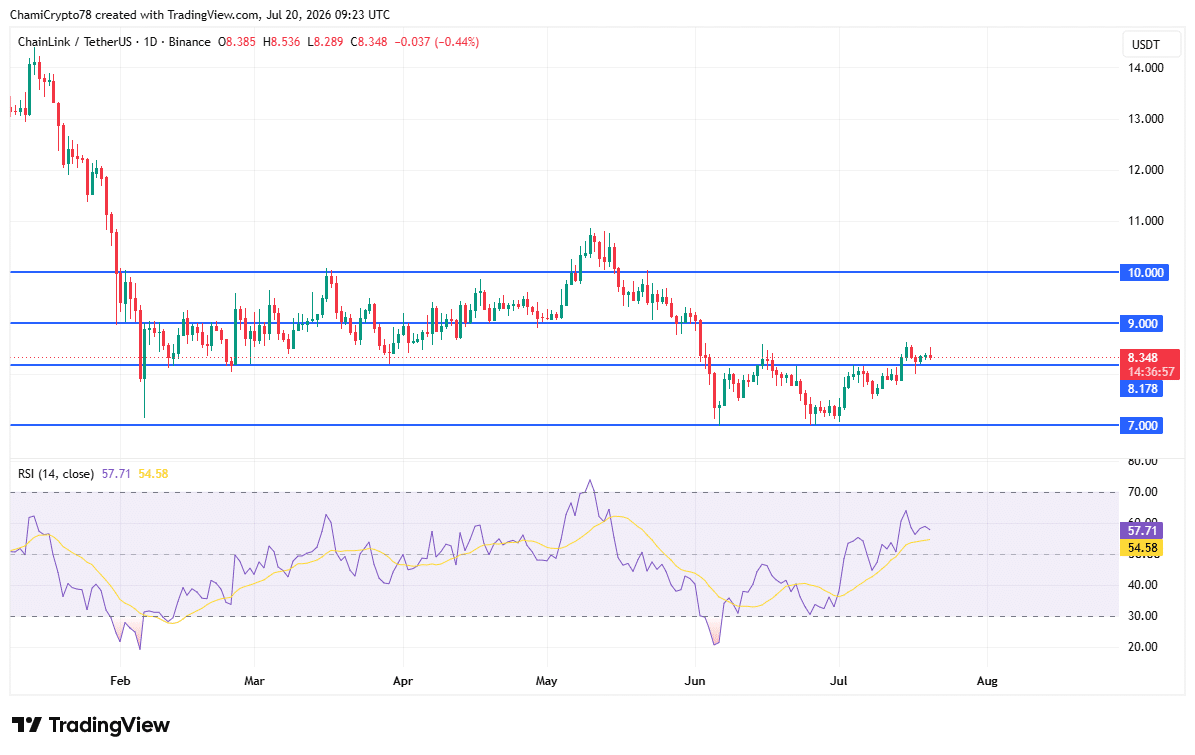
At the time of press, Chainlink [LINK] traded around $8.35 after extending its recovery from the $7.00 support region.

Buyers reclaimed the $8.18 level and pushed the price toward immediate resistance near $8.35, although that area continued limiting further advances.

A successful break above this zone would likely expose $9.00, while sustained buying could later bring $10.00 into focus. However, rejection at current levels could encourage another retest of $8.18 before buyers attempted another advance.

Meanwhile, the Relative Strength Index (RSI) climbed to 57.71 as of writing, remaining above its Moving Average near 54.58. The indicator reflected strengthening buying pressure without entering overbought territory.

As a result, the technical structure favored continued recovery, provided buyers reclaim nearby resistance with stronger participation.
Source: TradingView

To conclude, institutional wallet activity increased attention around Chainlink, while spot netflows shifted back into positive territory. However, seller-dominant futures positioning continued to signal caution.

If buyers clear the $8.35 resistance, LINK would likely challenge $9.00 next. Otherwise, another pullback toward $8.18 would remain the more likely short-term outcome.


Final Summary

  • Institutional wallet activity increased, while positive netflows reflected more LINK returning to exchanges.
  • LINK approached a key resistance, but bearish futures traders continued limiting the recovery.

Cryptos en tendance

Questions liées

QWhat was the significance of the $32.58 million Chainlink (LINK) transfer flagged by Whale Alert?

AThe transfer of 3.89 million LINK from a Coinbase Institutional wallet to an unknown wallet drew attention to growing institutional participation. It encouraged speculation about strategic positioning by large holders rather than immediate selling pressure, influencing market sentiment.

QHow did Chainlink's spot netflows change according to the article, and what does it indicate?

AChainlink's spot netflows shifted into positive territory with an inflow of approximately $620.18K. This marked a departure from a prolonged period of outflows. While positive netflows indicate more tokens reached exchanges than left them, the modest size suggests the supply increase was limited and not overwhelming the market.

QWhat does the seller-dominant 90-day Futures Taker CVD indicate about market sentiment?

AThe seller-dominant 90-day Futures Taker CVD indicates that aggressive leveraged traders executed more sell orders than buy orders. This shows bearish conviction persisted among futures traders, creating uncertainty and contrasting with more positive spot market activity.

QWhat key price levels are discussed for Chainlink (LINK) in the technical analysis?

ALINK was trading around $8.35, having reclaimed the $8.18 support. Immediate resistance was near $8.35. A break above this zone could expose $9.00 and later $10.00. A rejection could lead to a retest of $8.18.

QWhat was the state of the Relative Strength Index (RSI) for LINK, and what does it suggest?

AThe RSI climbed to 57.71, remaining above its Moving Average at 54.58. This indicates strengthening buying pressure without the asset entering overbought territory, which favored a continued recovery provided buyers can overcome nearby resistance with stronger participation.

Lectures associées

Gate Research Institute : La vague de « Wall Streetisation » des produits financiers cryptographiques, concurrence ou fusion ?

Le titre de l'article est : "Gate Institute : La vague de 'Wall Street-isation' des produits financiers cryptos, est-ce une compétition ou une fusion ?" Résumé en français (environ 1400 caractères) : Il y a dix-sept ans, Bitcoin fut créé avec une vision décentralisée et anti-establishment financier. Aujourd'hui, paradoxalement, son adoption massive passe souvent par des ETF émis par des géants comme BlackRock. Cet article analyse cette "Wall Street-isation" apparente des actifs cryptos : les institutions traditionnelles s'emparent-elles du pouvoir d'émission, de tarification, de garde et de distribution ? La réalité est plus nuancée. C'est une convergence à double sens. D'un côté, les plateformes cryptos comme Gate.io étendent leurs services aux actions traditionnelles (états-uniennes, hongkongaises, sud-coréennes), aux CFD et aux produits tokenisés, offrant un compte unifié. De l'autre, des courtiers traditionnels comme Robinhood intègrent les cryptomonnaies et explorent la tokenisation d'actions sur blockchain. Cette fusion vise à créer le "super-compte" financier de demain, où actions, cryptos, ETF et obligations tokenisées (RWA) coexistent dans une même interface, comblant les faiblesses de chaque écosystème. Les RWA, notamment les obligations d'État tokenisées, agissent comme une couche intermédiaire unificatrice. En conclusion, Wall Street n'a pas conquis la crypto, et la crypto n'a pas contourné Wall Street. Ils construisent ensemble une nouvelle forme de marché des capitaux, plus efficace et mondial, où l'idéal décentralisé persiste dans les protocoles, tandis qu'une expérience utilisateur unifiée émerge à l'interface.

marsbitIl y a 9 mins

Gate Research Institute : La vague de « Wall Streetisation » des produits financiers cryptographiques, concurrence ou fusion ?

marsbitIl y a 9 mins

S&P Dow Jones s'associe à Pantera pour lancer un indice crypto, le Bitcoin exclu car il ne « génère pas de revenus »

L'indice S&P Pantera Digital Asset Index, lancé par S&P Dow Jones Indices en partenariat avec Pantera Capital, exclut le Bitcoin ainsi que les memecoins. Le critère principal d'inclusion exige que les protocoles génèrent des revenus vérifiés sur plusieurs trimestres et redistribuent de la valeur à leurs détenteurs de jetons, s'inspirant ainsi des exigences de viabilité financière du S&P 500. Sur les 18 actifs numériques composant l'indice (liste complète non publique), les cinq principales pondérations sont Ethereum (ETH), BNB, Solana (SOL), Tron (TRX) et Hyperliquid (HYPE). Tous les protocoles sélectionnés génèrent collectivement un revenu annuel dépassant 30 milliards de dollars. Pantera justifie l'exclusion du Bitcoin en le qualifiant d'actif monétaire déjà accessible via des ETF dédiés, et souligne son absence de revenus de protocole. L'objectif est de fournir aux institutions un benchmark distinct pour les actifs numériques "utilitaires" générateurs de revenus. Bien que cet indice ne soit pour l'instant qu'un benchmark, des discussions sont en cours pour créer des produits d'investissement tels qu'un ETF. Ce lancement intervient dans un contexte où une majorité d'institutions expriment une préférence pour les produits d'investissement régulés afin d'accéder à la classe d'actifs numériques.

marsbitIl y a 14 mins

S&P Dow Jones s'associe à Pantera pour lancer un indice crypto, le Bitcoin exclu car il ne « génère pas de revenus »

marsbitIl y a 14 mins

Trading

Spot

Articles tendance

Comment acheter MOVE

Bienvenue sur HTX.com ! Nous vous permettons d'acheter Movement (MOVE) de manière simple et pratique. Suivez notre guide étape par étape pour commencer votre parcours crypto.Étape 1 : Création de votre compte HTXUtilisez votre adresse e-mail ou votre numéro de téléphone pour ouvrir un compte sur HTX gratuitement. L'inscription se fait en toute simplicité et débloque toutes les fonctionnalités.Créer mon compteÉtape 2 : Choix du mode de paiement (rubrique Acheter des cryptosCarte de crédit/débit : utilisez votre carte Visa ou Mastercard pour acheter instantanément Movement (MOVE).Solde :utilisez les fonds du solde de votre compte HTX pour trader en toute simplicité.Prestataire tiers :pour accroître la commodité d'utilisation, nous avons ajouté des modes de paiement populaires tels que Google Pay et Apple Pay.P2P :tradez directement avec d'autres utilisateurs sur HTX.OTC (de gré à gré) : nous offrons des services personnalisés et des taux de change compétitifs aux traders.Étape 3 : stockage de vos Movement (MOVE)Après avoir acheté vos Movement (MOVE), stockez-les sur votre compte HTX. Vous pouvez également les envoyer ailleurs via un transfert sur la blockchain ou les utiliser pour trader d'autres cryptos.Étape 4 : tradez des Movement (MOVE)Tradez facilement Movement (MOVE) sur le marché Spot de HTX. Il vous suffit d'accéder à votre compte, de sélectionner la paire de trading, d'exécuter vos trades et de les suivre en temps réel. Nous offrons une expérience conviviale aux débutants comme aux traders chevronnés.

433 vues totalesPublié le 2024.12.13Mis à jour le 2026.06.02

Comment acheter MOVE

Discussions

Bienvenue dans la Communauté HTX. Ici, vous pouvez vous tenir informé(e) des derniers développements de la plateforme et accéder à des analyses de marché professionnelles. Les opinions des utilisateurs sur le prix de MOVE (MOVE) sont présentées ci-dessous.

活动图片