Editor's Note: This Q1 2026 report on Ethereum from Token Terminal presents a set of seemingly contradictory yet crucial data points: while the number of users, transaction count, and throughput on the Ethereum mainnet all reached new historical highs simultaneously, transaction fees, TVL, trading volume, and ETH's fully diluted market cap saw quarter-over-quarter declines.
Ethereum is proactively entering a phase of "low fees for scale." Following the Fusaka upgrade which increased data capacity, block space has become cheaper, accelerating growth in users and transactions while temporarily suppressing fee capture. The report interprets this phenomenon as the Jevons Paradox: as the cost of using a resource falls, demand for the network may be further unleashed.
More significantly, Ethereum's core narrative is shifting from that of a DeFi-centric public blockchain to a global financial settlement layer. The report shows Ethereum still maintains dominance in tokenized assets: stablecoins, tokenized funds, tokenized commodities, and tokenized equities have all achieved scale on its network, with notable growth in funds and gold-related assets. The continued entry of institutions like BlackRock, JPMorgan, and Fidelity is also moving "institutional onboarding" from concept to product issuance and settlement practice.
The core value of this report lies not in proving how the ETH price might change in the short term, but in illustrating Ethereum's structural position as financial infrastructure: it is sacrificing short-term fee revenue through scaling on one hand, while on the other, attempting to solidify its network effects in stablecoins, tokenized funds, on-chain credit, and institutional settlement. For investors and industry observers, the key questions to focus on are: as more financial assets migrate on-chain, who will become the default settlement layer, and how will this settlement demand ultimately translate into value capture for ETH.
Below is the original text:
1) Executive Summary
Ethereum ($ETH) is a public, permissionless blockchain that provides global settlement and compute capacity for financial applications in an open economy. It runs a shared ledger that anyone can build on and no single party can shut down, using its native asset ETH to pay for transaction fees; simultaneously, through its staking mechanism, ETH is also used to secure the network.
The activities Ethereum facilitates have historically been constrained by the cost and throughput limitations of traditional financial infrastructure: settlements taking days, multiple intermediary layers adding friction, and counterparty risk at each hop. Tokenization and stablecoins are on-chain solutions emerging to address these frictions. As their regulatory frameworks matured through 2025 and into 2026, the conditions for institutional-scale on-chain activity moved from theory to reality.
Ethereum's role in this transition is that of the foundational settlement layer. Stablecoins, tokenized funds, tokenized commodities, and increasingly, tokenized equities, are being issued and settled on Ethereum; meanwhile, Layer 2 networks are responsible for scaling throughput and ultimately settling transactions back to Layer 1. As the asset that secures and pays for this settlement activity, ETH accrues value from it, and the staking market reflects how much of the ETH supply is committed to this role.
From a market positioning perspective, Ethereum remains the primary venue with the largest market capitalization for tokenized assets. On a cross-chain basis, Ethereum holds majority shares in categories like stablecoins, tokenized funds, commodities, and equities. Ethereum is developed by the Ethereum Foundation alongside a broad, independent community of client teams and researchers; concurrently, organizations like Etherealize help traditional finance better understand the network.
Q1 2026 can be clearly divided into two main narratives. On one hand, usage reached historical highs: monthly active users, transaction count, and throughput all set new records. On the other hand, value and fee metrics denominated in USD saw compression: fully diluted market cap, total value locked, trading volume, and both fee metrics declined quarter-over-quarter. Key events shaping the quarter impacted both narratives: the second Blob Parameters Only (BPO #2) fork within the Fusaka upgrade cycle in January increased data capacity; ERC-8004 went live on the mainnet in February, establishing a standard for AI Agent identity and reputation; the Ethereum Foundation finalized its 2026 Protocol Cluster priorities—scaling, improving user experience, and strengthening Layer 1; furthermore, events like the Institutional Ethereum Forum in March reflected growing institutional engagement.
Key Metrics (Q1 2026)
Ecosystem Total Value Locked: $316.2B (QoQ -11.0%, YoY +22.8%)
Ecosystem Active Loans: $21.8B (QoQ -16.6%, YoY +39.0%)
Ecosystem Trading Volume: $134.5B (QoQ -24.0%, YoY -31.2%)
Ecosystem Fees: $2.0B (QoQ -16.9%, YoY -7.8%)
Tokenized Asset Market Cap: $203.4B (QoQ -0.7%, YoY +42.9%)
Stablecoins: $178.9B (QoQ -2.3%, YoY +37.6%)
Tokenized Funds: $19.4B (QoQ +4.9%, YoY +73.1%)
Tokenized Commodities: $4.7B (QoQ +60.0%, YoY +325.9%)
Tokenized Equities: $365.1M (QoQ +16.5%)
Monthly Active Users: 13.2M (QoQ +53.5%, YoY +85.9%)
Transactions: 200.4M (QoQ +38.0%, YoY +81.5%)
Transactions Per Second: 25.78 (QoQ +41.2%, YoY +81.7%)
Fees: $39.9M (QoQ -47.9%, YoY -81.9%)
Fully Diluted Market Cap: $290.0B (QoQ -30.3%, YoY -9.9%)
Stake Ratio: 0.31x (QoQ +0.03x, YoY +0.03x)
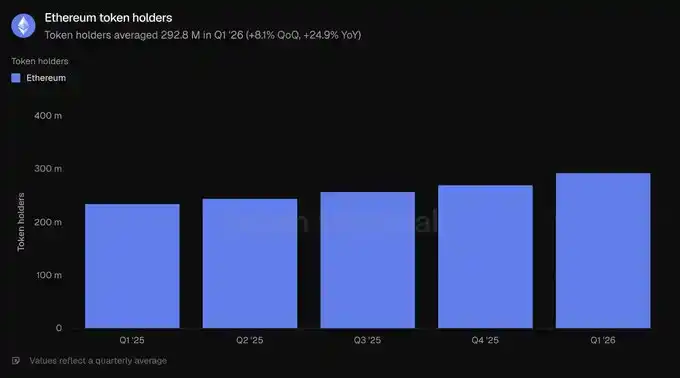
Token Holder Count: 292.8M (QoQ +8.1%, YoY +24.9%)
This report covers the Ethereum Layer 1 network, i.e., the mainnet. Layer 2 networks are treated as independent chains and are not included in Ethereum's own data.
2) Ecosystem
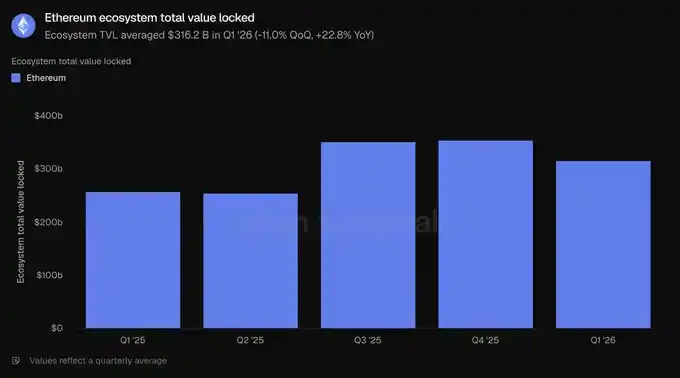
Total Value Locked (TVL) measures the value of assets deposited into various applications on a chain and is a leading indicator for revenue-generating activities like lending, trading, and staking. This statistic measures the capital deposited within the Ethereum ecosystem; depositors can typically withdraw these funds at any time.
On this basis, the average ecosystem TVL in Q1 2026 was $316.2 billion, a quarter-over-quarter decrease of 11.0% but a year-over-year increase of 22.8%. The quarterly decline aligns with a broad pullback in asset prices, while the annual growth indicates the Ethereum ecosystem remains significantly larger than a year ago.
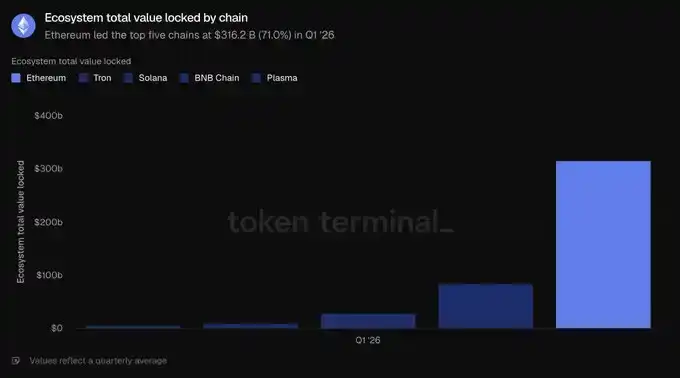
Among the top five chains, Ethereum leads significantly with $316.2B, exceeding the combined TVL of Tron ($84.5B), Solana ($28.8B), BNB Chain ($10.3B), and Plasma ($5.7B), accounting for 71.0% of the top five chains' total. The largest pools of this capital are concentrated in liquid staking, represented by projects like Lido, and lending, represented by projects like Aave. Restaking projects EigenLayer and ether.fi, along with synthetic dollar issuers Ethena and Sky, also rank among the largest applications by scale. Capital concentration remains Ethereum's clearest structural advantage.
Active Loans measures the portion of deposits that have been lent to borrowers and are therefore generating interest; this metric is typically correlated with lending revenue. On Ethereum, it reflects the outstanding loans across all lending applications in the ecosystem.
In Q1 2026, the average ecosystem active loans were $21.8 billion, down 16.6% quarter-over-quarter but up 39.0% year-over-year. The loan balance contracted alongside TVL, consistent with reduced risk appetite, yet remained substantially higher than a year ago.
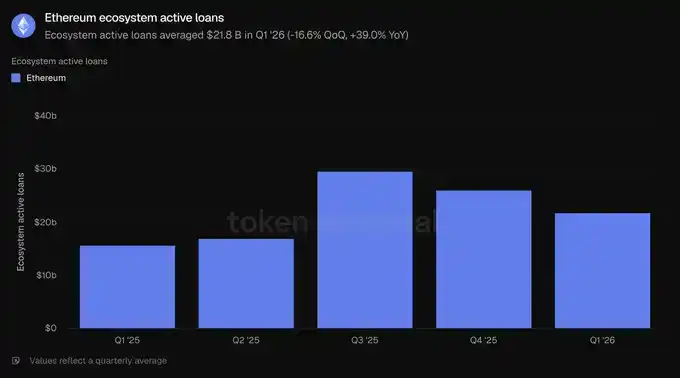
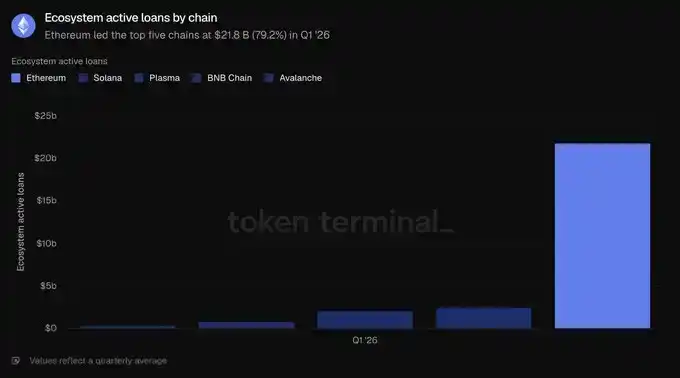
Lending activity on Ethereum is concentrated in a handful of money markets, with Aave dominating. At quarter-end, Aave's active loans were approximately $13.5B, accounting for the majority of the ecosystem total; followed by Morpho (~$1.9B), Sky's Spark (~$1.0B), and Maple (~$840M). The quarterly contraction was primarily driven by Aave, whose loan book shrank about 24% during the quarter as prices fell and borrowing demand cooled. Among the top five chains, Ethereum's $21.8B far exceeds Solana ($2.5B), Plasma ($2.1B), BNB Chain ($760.8M), and Avalanche ($392.4M), representing 79.2% of the top five chains' total. This is Ethereum's highest share across all metrics in this section.
Trading Volume measures the total value of trades executed on decentralized spot exchanges. As traders pay fees, this metric is typically correlated with the fees generated by these venues. This statistic measures the total DEX trading volume within the Ethereum ecosystem.
In Q1 2026, the total ecosystem trading volume was $134.5 billion, down 24.0% quarter-over-quarter and 31.2% year-over-year. Volume declined more sharply than locked capital, indicating a reduction in risk appetite during the quarter's pullback.
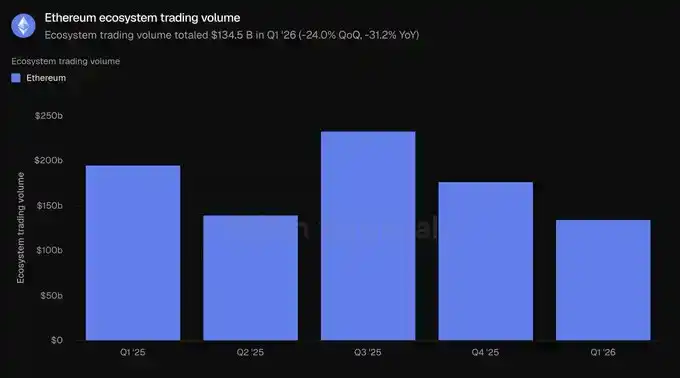
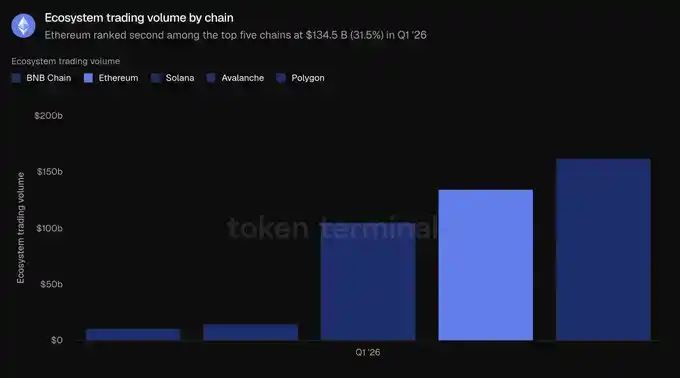
DEX activity on Ethereum is concentrated in a few deep liquidity venues. Uniswap processed approximately $85.5B in volume in Q1, accounting for about two-thirds of the ecosystem's trading volume; followed by Curve (~$22.1B) and CoW Swap (~$12.4B). Trading volume is the only metric in this section where Ethereum does not lead on a cross-chain basis: BNB Chain's volume of $162.5B was higher than Ethereum's $134.5B; Solana followed with $104.9B; then Avalanche ($14.5B) and Polygon ($10.7B). Ethereum's share of the top five chains' trading volume was 31.5%, ranking second behind BNB Chain's 38.0%.
Fees measure the total value users pay to utilize a project's applications, such as interest paid by borrowers or trading fees paid by traders, reflecting the amount of economic value generated. This metric aggregates fees generated by applications within the Ethereum ecosystem.
In Q1 2026, total ecosystem fees were $2.0 billion, down 16.9% quarter-over-quarter and 7.8% year-over-year, consistent with weaker trading and lending activity.
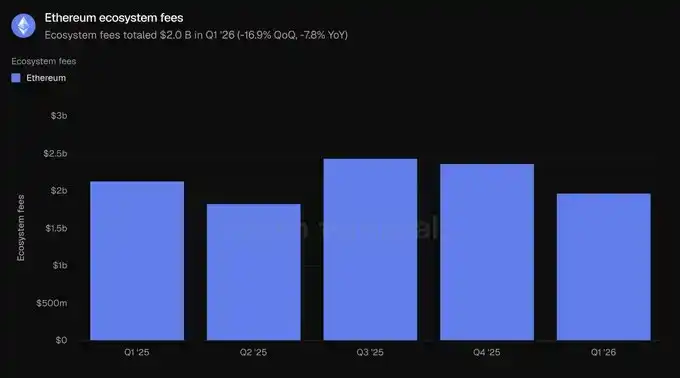
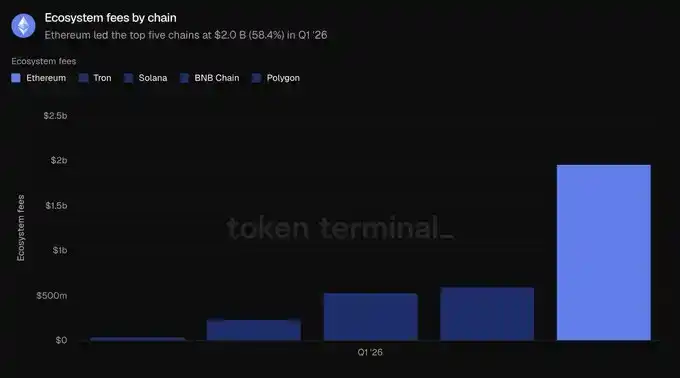
Ethereum generated $2.0B in fees, significantly more than Tron ($599.3M), Solana ($532.5M), BNB Chain ($231.9M), and Polygon ($38.8M), accounting for 58.4% of the top five chains' total fees. Despite the decline, Ethereum remains the single largest source of application fees. Overall, in this section, Ethereum leads in locked capital, credit, and fees, lagging only in trading volume.
3) Tokenized Assets
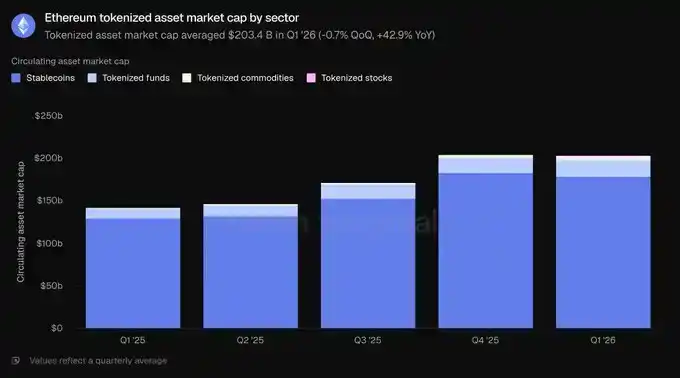
Circulating Asset Market Cap measures the total value of an asset after it has been tokenized on-chain, calculated as the circulating supply multiplied by the end-of-day price. For stablecoins, it refers to the outstanding supply; for tokenized funds, it refers to Assets Under Management (AUM) on-chain; for tokenized equities, it refers to the value of equities issued on-chain. This statistic measures assets issued on Ethereum.
In Q1 2026, the average market cap of tokenized assets on Ethereum was $203.4 billion, essentially flat quarter-over-quarter (-0.7%) but up 42.9% year-over-year. Stablecoins constituted the largest portion, representing 87.9% of the total, with the remainder composed of funds, commodities, and equities.
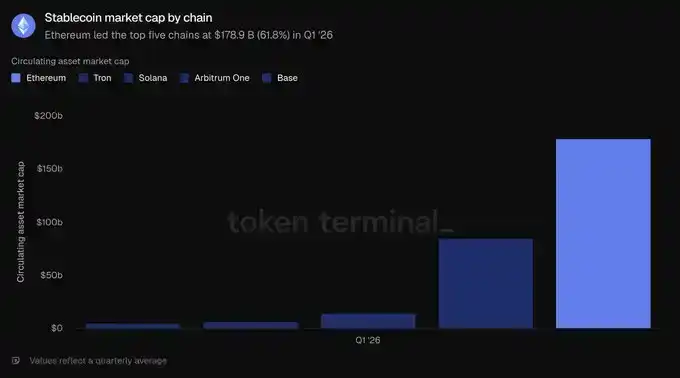
In Q1 2026, the average stablecoin market cap on Ethereum was $178.9 billion, down 2.3% quarter-over-quarter but up 37.6% year-over-year, making it the only sub-segment to decline during the quarter. Two issuers dominate: at quarter-end, Tether's USDT stood at $94.1B, and Circle's USDC at $54.5B, together accounting for the majority of the network's stablecoin market cap. They were followed by Sky's USDS ($12.4B), Ethena's USDe ($5.9B), and PayPal's PYUSD ($2.9B). Newer regulated entrants like Ripple's RLUSD ($1.1B) have also launched. Among the top five chains, Ethereum leads with $178.9B, exceeding Tron ($84.5B), Solana ($14.5B), Arbitrum One ($6.8B), and Base ($4.7B), accounting for 61.8% of the top five chains' total.
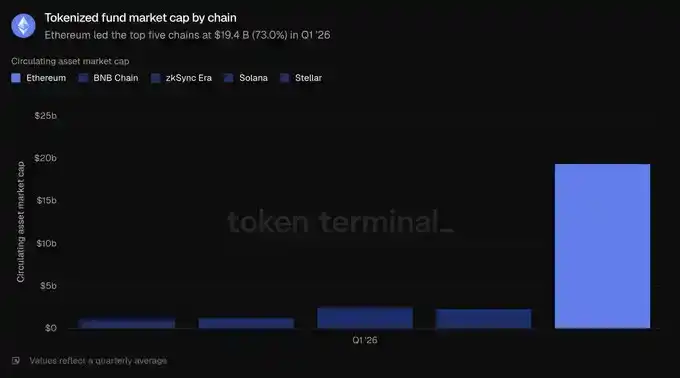
In Q1 2026, the average market cap of tokenized funds on Ethereum was $19.4 billion, up 4.9% quarter-over-quarter and 73.1% year-over-year. This segment can be divided into two parts: one is the interest-bearing on-chain USD category led by Sky's sUSDS (~$6.4B) and Ethena's sUSDe (~$3.5B); the other is regulated funds underpinning the institutional narrative, which have achieved scale growth, including BlackRock's BUIDL (issued via Securitize, ~$1.0B), WisdomTree's Government Money Market Fund (~$815M), and Superstate's USTB (~$620M), with Ondo's OUSG (~$320M) also following closely. Among the top five chains, Ethereum's $19.4B ranks first, ahead of zkSync Era ($2.5B), BNB Chain ($2.3B), Solana ($1.3B), and Stellar ($1.1B), accounting for 73.0% of the top five chains' total. This is the second-highest concentration among all asset categories in this section.
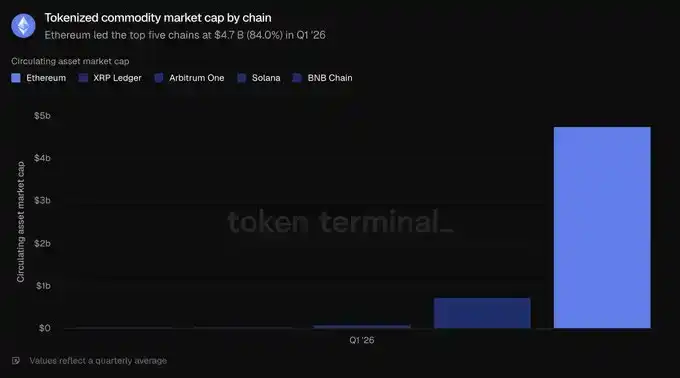
In Q1 2026, the average market cap of tokenized commodities on Ethereum was $4.7 billion, up 60.0% quarter-over-quarter and 325.9% year-over-year, making it the fastest-growing tokenized asset category. This category is almost entirely composed of gold: Tether Gold (XAUT, ~$2.6B) and Paxos' PAX Gold (PAXG, ~$2.4B) together constitute nearly the entire segment. Among the top five chains, Ethereum's $4.7B far exceeds the XRP Ledger ($736.6M), Arbitrum One ($95.9M), BNB Chain ($38.4M), and Solana ($29.8M), accounting for 84.0% of the top five chains' total. This is Ethereum's strongest lead in this section.
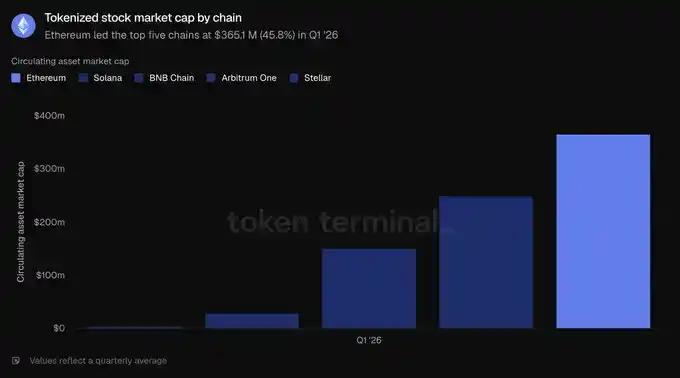
Tokenized equities remain the smallest category. In Q1 2026, the average market cap of tokenized equities on Ethereum was $365.1 million, a significant increase from a nearly negligible base a year ago, and up 16.5% quarter-over-quarter. This category is almost entirely dominated by Ondo Finance. Ondo's on-chain equities and ETFs, covering broad-based index funds like the S&P 500 and NASDAQ 100, as well as dozens of individual stocks, constitute the majority of the tokenized equity market cap on Ethereum. Among the top five chains, Ethereum leads with $365.1M, followed by Solana ($249.0M), BNB Chain ($150.5M), Arbitrum One ($29.0M), and Stellar ($4.2M). However, Ethereum's share of the top five chains' total is only 45.8%, its narrowest lead and the only tokenized category where Ethereum does not hold a clear majority.
Overall, the quarter shows Ethereum's leadership in fund and commodity tokenization, even as stablecoin balances temporarily stagnated.
4) Usage
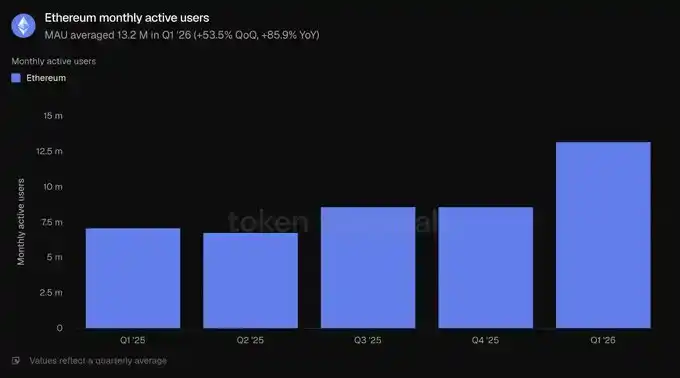
Monthly Active Users measures the number of unique addresses that have interacted with the network via revenue-generating transactions within a one-month window. On Ethereum, it counts distinct addresses transacting on the Layer 1 network.
In Q1 2026, the average monthly active users were 13.2 million, up 53.5% quarter-over-quarter and 85.9% year-over-year, setting a new historical high. After several quarters of relatively modest growth, user growth accelerated markedly.
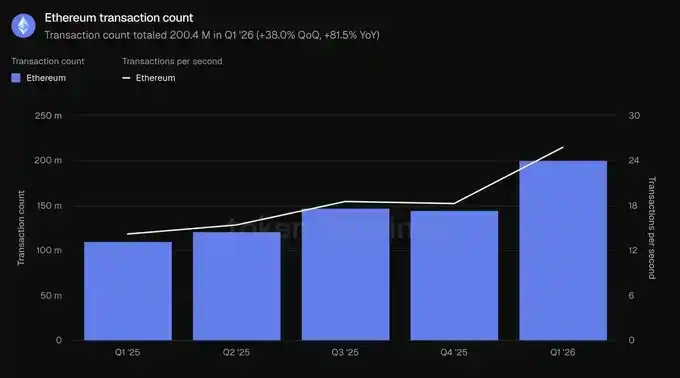
Transactions measures the number of transactions confirmed and added to the blockchain, reflecting user activity on the network; Transactions Per Second is the average rate at which these confirmed transactions are processed, measuring throughput and real-time usage. Both are measured here for the Ethereum Layer 1 network.
In Q1 2026, the total number of transactions was 200.4 million, up 38.0% quarter-over-quarter and 81.5% year-over-year; throughput increased to 25.78 transactions per second, up 41.2% quarter-over-quarter. Both metrics set new historical highs, confirming that user growth translated into substantial increases in on-chain activity.
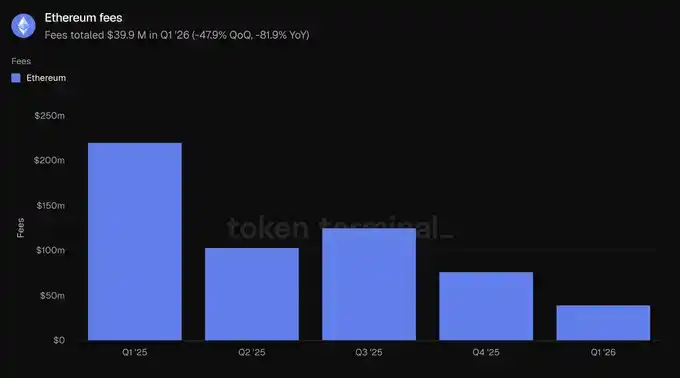
Fees here refer to the transaction fees users pay to conduct transactions on the Ethereum Layer 1 network, i.e., the cost of using the base layer. This is distinct from the ecosystem-level application fees in Section 2.
On this basis, total fees in Q1 2026 were $39.9 million, down 47.9% quarter-over-quarter and 81.9% year-over-year. This contrasts sharply with usage metrics and represents the quarter's most critical data point: while transaction count grew 38.0%, total fees fell 47.9%, meaning the average cost per transaction decreased significantly as data capacity increased and block space prices fell.
This section presents a scaling story: more users, more transactions, completed at a lower total cost. As throughput grows faster than demand, increased activity and decreased fees can coexist.
5) ETH
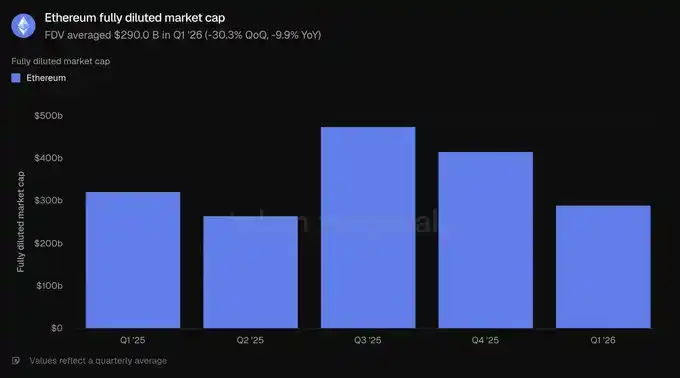
Fully Diluted Market Cap measures the valuation of ETH under a fully diluted assumption, calculated as the token price multiplied by the total supply under the current token economics, including circulating, locked, unvested, and future issuable tokens.
In Q1 2026, the average fully diluted market cap was $290.0 billion, down 30.3% quarter-over-quarter and 9.9% year-over-year. The quarterly decline is the largest among valuation metrics in this report and drove the decline in other USD-denominated metrics.
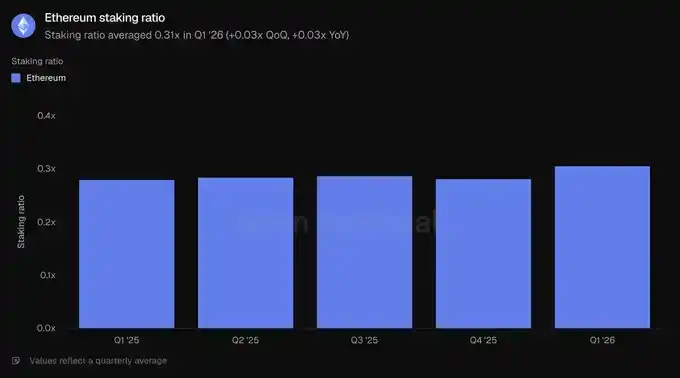
Stake Ratio measures the value of ETH committed to helping secure the proof-of-stake network relative to the total market cap of ETH. A reading of 0.31x means roughly 31% of the value is staked.
In Q1 2026, the average stake ratio was 0.31x, higher than the 0.28x in the previous quarter and a year ago. Even as ETH's market cap fell, the share of ETH dedicated to network security increased, indicating stable staking participation during the price retreat.
Token Holder Count measures the number of distinct addresses holding the network's native token. On Ethereum, it counts addresses holding ETH.
In Q1 2026, the average token holder count was 292.8 million, up 8.1% quarter-over-quarter and 24.9% year-over-year, continuing a steady upward trend over the past five quarters. Even as the fully diluted market cap declined, the holder base expanded, suggesting ETH ownership became more widespread during the price pullback.
6) Etherealize Team Commentary
"The most prominent tension this quarter is that Ethereum mainnet usage hit an all-time high while transaction fees declined. Ethereum is deliberately scaling the network at the expense of short-term fee capture, betting that cheaper block space will unlock more demand and ultimately generate more network revenue in the long run.
Token Terminal's 'Ethereum Q1 2026 Report' shows this bet is working. On a year-over-year basis, monthly active users grew 85.9%, transactions grew 81.5%, and throughput grew 81.7%. This is the Jevons Paradox in action. We expect the increase in total network demand to be sufficient to offset the impact of lower fees, similar to how the semiconductor industry today generates orders of magnitude more revenue than in 1975, when Intel co-founder Gordon Moore observed that the number of transistors on a microchip doubled roughly every two years. Furthermore, the returns from scaling lie ahead: the Glamsterdam upgrade, scheduled for Q3, plans to increase the gas limit by more than 3x, and Ethereum's roadmap points to achieving 10,000 TPS by 2029 and a 'fast Layer 1' network with second-level finality.
We agree with BlackRock CEO Larry Fink's assessment from last December. He wrote, 'Tokenization today is roughly where the internet was in 1996—when Amazon sold just $16 million worth of books.' The consensus back then was that Amazon was just a money-losing online bookstore propped up by the dot-com bubble. However, Jeff Bezos saw that the internet would reshape retail and prioritized optimizing for network effects and economies of scale over short-term profits. Ethereum is making a similar trade-off to cement its position as the global financial settlement layer.
Another lesson from the internet is that open, permissionless networks tend to win over closed networks. In 1995, Bill Gates published *The Road Ahead*, predicting digital commerce would run on proprietary corporate networks he called the 'information superhighway,' not the open internet. Microsoft was building MSN at the time. AOL, CompuServe, and Prodigy operated walled gardens with millions of paying subscribers. France's Minitel, as late as the end of 1996, still had more users than the entire World Wide Web. They all lost. No serious company wants to build on a network controlled by a competitor; perhaps more importantly, no company can keep pace with permissionless innovation indefinitely. We've seen this play out repeatedly: Linux surpassing proprietary Unix, open networks replacing corporate walled gardens, Wikipedia replacing Britannica. Each time, proprietary solutions started with an advantage—more focused product, stronger marketing, better business development teams—but each time, that lead eroded once the open system crossed the threshold of accumulated contributions, tooling maturity, and credible neutrality.
Now, we're seeing the same themes play out in financial infrastructure, and the data in this report show Ethereum has crossed that threshold and holds dominant market share across all key metrics. Institutions building tokenized finance choose Ethereum not out of ideology, but because the liquidity, composability, and institutional precedents are already there. As this report highlights, among the top five chains, Ethereum holds 79.2% of active DeFi loans, 61.8% of stablecoins, 73.0% of tokenized funds, and 84.0% of tokenized commodities. Each new tokenized asset deepens liquidity, attracting the next one; and the neutral base layer is the only sustainable equilibrium because large participants will never agree to settle on a competitor's infrastructure. Moreover, institutions are realizing that privacy, permissioning, KYC, and transfer restrictions can all be achieved on Ethereum through privacy-preserving environments and permissioned token standards without sacrificing access to public liquidity; conversely, grafting public liquidity and open application ecosystems onto a closed chain is impossible.
If anything, institutional momentum has accelerated further after the quarter ended. In May alone, BlackRock filed for two more tokenized funds; JPMorgan launched its second tokenized money market fund, JLTXX, on Ethereum; Fidelity International launched FILQ, a Moody's AAA-rated US dollar liquidity fund issued as an ERC-20 token. In the stablecoin space, the Japan Blockchain Foundation's yen stablecoin EJPY will launch on Ethereum; a consortium of twelve European banks, including BNP Paribas, ING, UniCredit, and BBVA, is also preparing to launch a regulated euro stablecoin.
The internet looked impossible in 1990 and inevitable by 2005. If Fink is right about where tokenization is in its lifecycle, the coming years could be among the most exciting in Ethereum's history. As we argued in our 'Productive Money' report, network fees provide a floor of intrinsic value for ETH, and the bull case is ETH absorbing the $30+ trillion monetary premium held by gold and Bitcoin because ETH has superior monetary properties. ETH doesn't need to rely on high fees to win."
7) Definitions
Metrics:
Ecosystem Total Value Locked: The USD value of assets deposited into applications within a chain's ecosystem, reported as the period average.
Ecosystem Active Loans: The USD value of outstanding loans within lending applications in the ecosystem, reported as the period average.
Ecosystem Trading Volume: The USD value of trades executed on decentralized exchanges within the ecosystem, reported as the period total.
Ecosystem Fees: The total fees paid by users to applications within the ecosystem, reported as the period total.
Circulating Asset Market Cap: The circulating USD value of a tokenized asset category, calculated as the circulating supply multiplied by the end-of-day price, reported as the period average.
Monthly Active Users: The number of distinct addresses interacting with Ethereum via revenue-generating transactions, reported as the average of monthly figures for the period.
Transactions: The number of transactions confirmed and settled on the Ethereum Layer 1 network, reported as the period total.
Transactions Per Second: The average rate at which the Ethereum Layer 1 network confirmed transactions during the period.
Fees: The total transaction fees paid on the Ethereum Layer 1 network, reported as the period total.
Fully Diluted Market Cap: ETH price multiplied by the total supply under the current token economics, reported as the period average.
Stake Ratio: The value of ETH staked to secure the network relative to the total market cap of ETH, reported as the period average.
Token Holder Count: The number of distinct addresses holding ETH, reported as the period average.
8) About This Report
This report is published quarterly and produced using Token Terminal's end-to-end on-chain data infrastructure. All metrics are sourced directly from blockchain data. The charts and datasets referenced in the report can be viewed in the corresponding Ethereum Q1 2026 report dashboard on Token Terminal.