Wintermute Market Weekly: Iran War Ends, Inflation Meets Expectations, BTC Rebounds to Lower 60ks But Don’t Rush to Buy the Dip

marsbitPublié le 2026-06-17Dernière mise à jour le 2026-06-17

Résumé

**Wintermute Market Weekly: BTC Rebounds to $60K Lows, But Caution Advised** This week saw a broad market rebound, primarily driven by two converging factors: a US CPI inflation reading that met expectations (4.2% YoY) and former President Trump's announcement of a deal to end the Iran conflict. The latter triggered a sharp drop in oil prices, reducing geopolitical risk premiums and easing inflation fears. Consequently, risk assets like equities and cryptocurrencies rallied, with Bitcoin recovering from lows around $60,000 to close the week up 1.9%, while altcoins gained 3.1%. Despite the price bounce, the underlying liquidity picture for crypto remains weak. Key funding channels—stablecoin flows, ETF inflows, and Digital Asset Treasury (DAT) activity—show no signs of structural improvement. ETF outflows recently hit a record streak, and DAT assets have declined significantly. The rally from $60K to $83K earlier is now viewed as a bear-market rally that has failed. The current environment is characterized by low directional conviction and choppy, range-bound trading, likely persisting into summer. The report advises caution against aggressively buying the dip. While the $60K area offers attractive long-term risk/reward, a sustained bull run requires a visible turnaround in capital inflows, which hasn't materialized. The upcoming FOMC meeting and Powell's commentary, alongside the formal Iran deal signing, are noted as near-term catalysts. The core takeaway is to watch fund...

Author: Wintermute

Compiled by: TechFlow

TechFlow Insight: Markets rebounded this week as US inflation data met expectations and Trump announced an end to the Iran conflict, with plunging oil prices boosting risk assets. However, the real turning point for the crypto market depends on capital inflows, not price rebounds – there has been no structural improvement in stablecoins, ETF flows, or institutional capital. Do not get chopped up in volatile markets before seeing these signals.

Macro Markets

This week's rally was driven by two events, both surprisingly pulling in the same direction.

First, May CPI data.

Year-on-year at 4.2%, it accelerated for the third consecutive month, hitting a new high since 2023, but it was in line with expectations. This "in-line" reading is the whole story. The bond market had been bracing for hotter inflation, fearing it would push Warsh to turn hawkish earlier, but the data wasn't that bad. Core inflation cooled to 2.9%, suggesting energy-driven inflation may be peaking rather than spreading to services and wages. After three weeks of market anxiety about a secondary inflation spiral, an in-line reading was enough for relief.

Second, and more importantly, the end of the Iran conflict.

After over 100 days, Trump announced an agreement on Sunday, authorizing the reopening of the Strait of Hormuz and lifting the maritime blockade, with a formal signing scheduled for June 19th in Switzerland. Brent crude plunged from around $110 a month ago to the low $80s, dropping 6.6% this week alone. The geopolitical risk premium that has driven markets since late February is rapidly unwinding, pulling the dollar (DXY -1%) and yields (10-year back to around 4.50%) down with it. Falling oil directly lowers the forward inflation path, which is why the CPI data and ceasefire reinforced each other this week instead of offsetting.

Cross-asset moves clearly tell this relief story. The Russell 2000 led gains at +4.0%, Nasdaq +2.3%, altcoins +3.1%, BTC +1.9%, with Brent crude at the bottom. Risk appetite rotated, energy premium flowed out. The only notable laggard was long-dated Treasuries: 20+ year Treasuries were only +0.8%, as the 4.2% headline inflation capped yield downside even with the war premium exiting.

All this sets up a genuinely tricky situation for the upcoming FOMC meeting. The 4.2% headline argues for "higher for longer." Softer core and plummeting oil argue the shock is transitory and the next move could even be a cut. No one expects a policy change on Wednesday, so the dot plot, updated projections, and Warsh's first press conference are everything. How he frames this contradiction – anchoring on headline or looking through to core and oil – will set the tone for the second half of the year.

Digital Assets

To understand this week, you have to start two weeks ago when the sector dropped over 10%, with BTC down 14% in a single week. Crypto-only observers blamed it on Saylor selling 32 BTC and ensuing capital fears. The reality was two other drivers:

(i) A broad risk-off rotation triggered by rising inflation fears and strong jobs data,

(ii) plus confirmation that the rally from the lower 60ks to $83k lacked further support. That was a bear market rally, now confirmed.

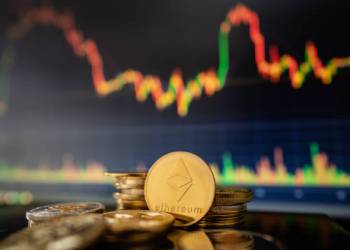
This week was a bounce. BTC rebounded from the lower 60ks to close up +1.9%, altcoins +3.1%, benefiting from in-line CPI and the ceasefire. ETH was a clear laggard, down 0.4% for the week while everything around it rose, extending its relative weakness. There's no structural change here. This is high-beta risk assets reacting to a better market environment.

Stepping back, we've had three >20% drawdowns since last October. The difference is in character. The first two were directional sell-offs. The recent one from $83k to $60k was a bear trap, the kind of move that cuts both bulls and bears on both sides. Perpetuals and options show little interest in directional exposure, which is normal for now. Barring major news, the base case is chopping into summer.

The harder question is when it turns, and the answer lies in liquidity. Crypto remains a macro asset, a release valve for excess liquidity, and that liquidity arrives via three channels: stablecoins, ETFs, and DATs (Digital Asset Treasuries). None are reversing. DAT AUM has fallen from ~$220B to ~$140B, and new funding has largely stopped outside of Strategy, Bitmine, and Strive. ETFs just set their longest streak of outflows since launch, with no sign of a turn last week. Stablecoin flows follow the same outflow trend.

It's worth remembering how the last cycle actually started. There was a bottom and recovery, but the real move began in early 2024 with the ETF approval, which was front-run, and the money it brought. If the thesis is a run back to $100k, the question is where that money comes from. Right now, institutions are on the sidelines, retail is busy trading levered ETFs and single stocks. Until that trend reverses, calling the bottom feels premature. We need to see a structural shift in momentum behind stablecoin mints/redemptions, ETF flows, and/or DAT activity.

Our Take

Don't Get Chopped

Risk/reward around the lower 60ks is attractive long-term; each flush leaves a higher-quality, more convicted holder base. That doesn't mean the bottom is in. Trading into the 50ks before we see any improvement is possible. Positioning has been cleaned up, net selling pressure has eased, but it's on dwindling summer volume.

The only thing to watch is flow, not price, not news. The turn to persistent inflows into ETFs and stablecoins marked the real move of the last cycle, and there's no sign of it yet. The advice facing this chop is not to bet too heavily on any rebound and get chopped up.

Near-term, Warsh's comments on Wednesday are a catalyst. A dovish read on softer core and lower oil extends the relief; a hawkish read on 4.2% headline ends it. Beyond that, the US-Iran signing ceremony in Switzerland on Friday is the event.

Cryptos en tendance

Questions liées

QWhat were the two main events that drove the market rebound this week according to Wintermute's report?

AThe two main drivers were: 1) The May U.S. CPI data, which came in at 4.2% year-on-year, meeting expectations and easing fears of a more hawkish Fed pivot. 2) The end of the Iran conflict announced by former President Trump, which led to a sharp drop in oil prices, reducing inflation pressure and geopolitical risk premium.

QWhy does Wintermute advise caution against rushing to buy the dip in the crypto market despite BTC's bounce from the $60k lows?

AWintermute advises caution because the report indicates a lack of structural improvement in the three key liquidity channels for crypto: stablecoin inflows, ETF flows, and Digital Asset Treasury (DAT) activity. Without a reversal in these fund flows, the recent price action is considered a bear market fakeout or a dead-cat bounce within a consolidating range, not a confirmed bottom or start of a sustained uptrend.

QWhat is identified as the key signal for a genuine turning point in the crypto market cycle?

AThe key signal for a genuine turning point is a structural shift in liquidity flows, specifically sustained inflows into crypto ETFs and stablecoin net issuance, not just price rebounds or news events. The report references the start of the last bull cycle, which was marked by the anticipation and approval of spot Bitcoin ETFs and the capital they brought in.

QHow did Ethereum (ETH) perform relative to the broader crypto market this week?

AEthereum (ETH) was an obvious laggard this week, declining by 0.4% while Bitcoin (BTC) was up 1.9% and altcoins as a sector gained 3.1%. This continued its trend of relative weakness.

QWhat are the two potential interpretations of upcoming economic data that could impact the market, as mentioned regarding the Fed (Warsh) press conference?

AThe two potential interpretations are: 1) A dovish interpretation focusing on softening core inflation and lower oil prices, which would extend the market relief. 2) A hawkish interpretation focusing on the 4.2% headline inflation rate, which would bring the relief rally to an end. Fed Chair Warsh's framing of this contradiction will set the tone for the latter half of the year.

Lectures associées

Les ours d'Ethereum gardent le contrôle alors que l'ETH rejette la résistance de la ligne de tendance

Le rebond récent d'Ethereum n'a pas convaincu les analystes que la tendance baissière est terminée. Le 20 juin, TheSignalyst sur TradingView a souligné qu'ETH reste orienté à la baisse, évoluant toujours sous une ligne de tendance résistante rouge et formant une série de plus hauts et de plus bas décroissants. Le graphique montre qu'ETH a rejeté une zone de confluence constituée de cette ligne de tendance descendante et d'une zone de résistance structurelle horizontale. Un tel rejet confirme souvent que les vendeurs maintiennent le contrôle. La zone de support clé à surveiller se situe entre 1 350 et 1 500 dollars. Un retrait contrôlé dans cette fourchette pourrait susciter une réaction, mais une rupture nette en dessous affaiblirait considérablement la structure globale d'ETH. Actuellement, ETH est pris entre ce support important et la ligne de tendance baissière qui limite les rebonds. Tant que l'un de ces niveaux ne cède pas, le marché reste techniquement comprimé. Cette configuration d'Ethereum est également importante pour l'ensemble du marché des altcoins. Lorsque ETH peine face au dollar, l'appétit pour le risque s'affaiblit souvent dans tout l'écosystème DeFi et les actifs cryptographiques de petite capitalisation. Le scénario de TheSignalyst sert donc d'avertissement : le rebond récent doit encore prouver sa solidité. Les haussiers ont besoin d'une cassure nette au-dessus de la résistance pour envisager un renversement de tendance plus durable.

bitcoinistIl y a 11 h

Les ours d'Ethereum gardent le contrôle alors que l'ETH rejette la résistance de la ligne de tendance

bitcoinistIl y a 11 h

Trading

Spot
Futures

Articles tendance

Comment acheter T

Bienvenue sur HTX.com ! Nous vous permettons d'acheter Threshold Network Token (T) de manière simple et pratique. Suivez notre guide étape par étape pour commencer votre parcours crypto.Étape 1 : Création de votre compte HTXUtilisez votre adresse e-mail ou votre numéro de téléphone pour ouvrir un compte sur HTX gratuitement. L'inscription se fait en toute simplicité et débloque toutes les fonctionnalités.Créer mon compteÉtape 2 : Choix du mode de paiement (rubrique Acheter des cryptosCarte de crédit/débit : utilisez votre carte Visa ou Mastercard pour acheter instantanément Threshold Network Token (T).Solde :utilisez les fonds du solde de votre compte HTX pour trader en toute simplicité.Prestataire tiers :pour accroître la commodité d'utilisation, nous avons ajouté des modes de paiement populaires tels que Google Pay et Apple Pay.P2P :tradez directement avec d'autres utilisateurs sur HTX.OTC (de gré à gré) : nous offrons des services personnalisés et des taux de change compétitifs aux traders.Étape 3 : stockage de vos Threshold Network Token (T)Après avoir acheté vos Threshold Network Token (T), stockez-les sur votre compte HTX. Vous pouvez également les envoyer ailleurs via un transfert sur la blockchain ou les utiliser pour trader d'autres cryptos.Étape 4 : tradez des Threshold Network Token (T)Tradez facilement Threshold Network Token (T) sur le marché Spot de HTX. Il vous suffit d'accéder à votre compte, de sélectionner la paire de trading, d'exécuter vos trades et de les suivre en temps réel. Nous offrons une expérience conviviale aux débutants comme aux traders chevronnés.

559 vues totalesPublié le 2024.12.10Mis à jour le 2026.06.02

Comment acheter T

Discussions

Bienvenue dans la Communauté HTX. Ici, vous pouvez vous tenir informé(e) des derniers développements de la plateforme et accéder à des analyses de marché professionnelles. Les opinions des utilisateurs sur le prix de T (T) sont présentées ci-dessous.

活动图片