Super-Rich Hoarded Record Cash in February, Stock Market Hit New Highs Four Months Later: Who's Getting Fooled?

marsbitPublié le 2026-06-15Dernière mise à jour le 2026-06-15

Résumé

In February, the total assets in US money market funds reached a record high of approximately $8.25 trillion, a trend highlighted by high-net-worth individuals increasing their cash holdings. Notably, Warren Buffett's Berkshire Hathaway amassed a $381.7 billion cash pile ahead of his 2025 retirement, while other prominent figures like Peter Thiel sold tech stocks, fueling narratives of wealthy investors seeking safety. However, by June, the trend reversed. Money market fund assets fell to around $7.87 trillion, indicating a flow of capital back into equities. Concurrently, the S&P 500 and Nasdaq reached all-time highs, with the S&P 500 surpassing 7600 points. This market surge occurred despite the earlier defensive moves, highlighting a potential opportunity cost for those who retreated to cash. Analysis shows that since early 2022, the S&P 500's total return significantly outpaced that of prime money market funds. The capital shifted from equities appears to have been partly reallocated into alternative investments like real estate, art, and private credit, especially among ultra-high-net-worth individuals. Meanwhile, major investment banks like Goldman Sachs and Morgan Stanley have raised their year-end targets for the S&P 500, citing AI-driven earnings growth, while also cautioning about risks including market concentration and economic fragility beneath the surface rally.

Author: Claude, Deep Tide TechFlow

Deep Tide Introduction: In February of this year, US money market funds surged to a historical peak of about $8.25 trillion. Buffett left behind $381.7 billion in cash before retirement, and rumors swirled that the super-rich were fleeing the stock market.

But now in June, the plot has reversed: the S&P 500 repeatedly hits new highs, breaching the 7600-point level for the first time on June 2nd, while money market fund assets have fallen back to $7.87 trillion as of June 10th. Money is flowing from cash back into stocks. The safe-haven bet placed by the wealthiest group is now being proven wrong by the market.

The Story in February: Cash in the Hands of the Rich Piled Up to a Record High

Let's rewind to the beginning of the year.

According to a Goldman Sachs survey from October 2025, high-net-worth individuals with over $1 million in investable assets held, on average, about 20% of their net worth in cash and cash equivalents—a proportion considered high for traditional allocation.

The most symbolic figure was Buffett.

As reported by Bloomberg, before his retirement on December 31, 2025, the former CEO of Berkshire Hathaway had built the company's cash reserves to approximately $381.7 billion as of the end of the third quarter of 2025. This cash pile even ended up making money—despite market turmoil, Buffett's personal net worth still grew by about $21 billion last year.

He wasn't the only one reducing holdings. According to Reuters' disclosures of holdings documents, PayPal co-founder Peter Thiel, through his hedge fund Thiel Macro, sold about $100 million worth of Nvidia stock in Q3 2025. Nvidia rose nearly 35% in 2025; Thiel exiting at a high point added fuel to concerns about an "AI bubble."

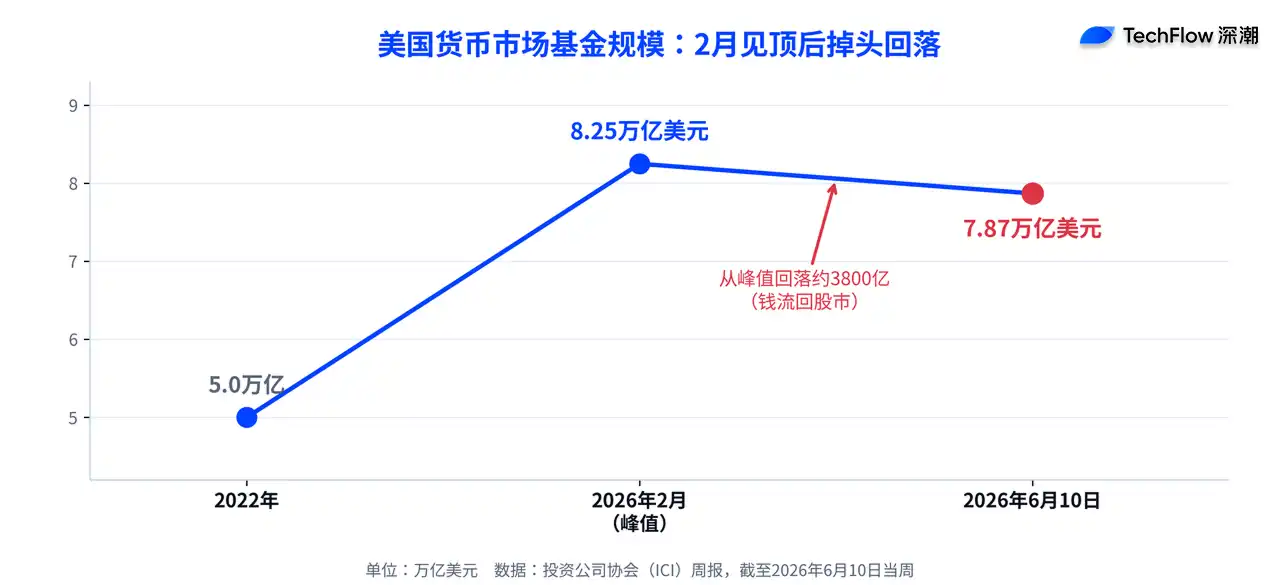
The market direction was the same. According to data from the Investment Company Institute (ICI), US money market fund assets surged to a historical peak of about $8.25 trillion at the end of February this year, a 65% increase from about $5 trillion in 2022. The narrative back then was clear: smart money was hiding in cash.
The June Reversal: Money is Flowing from Cash Back into Stocks

The problem is, it's June now, and the story has flipped.

According to official ICI data, as of the week ending June 10th, money market fund assets dropped to $7.87 trillion, with a single-week outflow of $21.48 billion; the previous week, June 4th, it was $7.89 trillion. From the February peak of $8.25 trillion, assets have shrunk by about $380 billion. Money is flowing *out* of cash, not in.

Where is it going? Stocks. According to CNBC, the S&P 500 closed at 7609.78 points on June 2nd, breaking above the 7600-point level for the first time in history, marking its ninth consecutive day of gains; the Nasdaq also hit new highs. Nvidia surged over 6% in a single day after releasing its new generation of PC chips, boosting Dell and HP. In short, the money that hid in cash back in February is now watching the market hit new highs without them.

There was an early signal behind this. According to investingLive reports, Bank of America (BofA) warned as early as late May that as the market surged to new highs and bullish sentiment peaked, cash levels were actually declining. The $8.25 trillion record was old news from February; by June, the market landscape was a different story.

The Cost of Hoarding Cash: Lagging Stocks by More Than Double

Why is the wealthy's safe-haven move being proven wrong? Look at the return gap.

According to calculations by The Motley Fool, if one had held from the point before the 2022 bear market when cash was flowing into money market funds all the way to the present, the total return for the S&P 500 would be about 42%, while the Vanguard Federal Money Market Fund returned only 18% over the same period—a gap of more than double. Hiding in cash seems safe, but the cost is missing a big chunk of the rally.

This is also why many analysts remain skeptical of the "pile into cash at the first sign of trouble" approach:

Historically, events like geopolitical conflicts are often short-term and can instead be buying opportunities at low points, not reasons to sell out.

Those Who Moved Money Out of Stocks Went into Real Estate and Art

The money freed up by those who did reduce stock holdings hasn't been idle. The Goldman Sachs survey shows that among those with $1 million to $5 million in investable assets, nearly 40% hold alternative investments; among those with over $10 million, this proportion reaches 80%. The greater the assets, the more they move beyond traditional stocks.

Art is one destination. According to UBS's 2025 Art Market Report, high-net-worth collectors allocated an average of about 20% of their wealth to art in 2025. Real estate, private credit, and hedge funds are also absorbing funds flowing out of the stock market. The logic is that in an environment of sticky inflation, high interest rates, and uncertain tariff prospects, these asset classes resemble safer harbors. But even safe harbors have a cost, as the earlier set of return numbers demonstrates.

Major Banks Are Still Doubling Down: Goldman Sachs, Morgan Stanley Raise Price Targets

If the wealthy's moves in February leaned defensive, Wall Street banks' stance in June is the opposite.

According to Bloomberg, Goldman Sachs' strategy team (led by Ben Snider) raised its year-end target for the S&P 500 from 7600 points to 8000 points in late May, citing AI-driven earnings growth. Goldman increased its 2026 S&P 500 earnings-per-share forecast to $340, representing a 24% year-on-year growth, and believes AI infrastructure beneficiaries will contribute about half of this year's index earnings growth. However, Goldman also cautioned: "AI sentiment and interest rates present risks in both directions."

Morgan Stanley is even more bullish. Chief Investment Officer for Wealth Management Lisa Shalett, in an outlook on May 20th, set a one-year target of 8300 points for the S&P 500, implying about 11% to 12% upside. But she also listed five risks: gains excessively concentrated in a few large-cap AI stocks, deteriorating US consumer finances, corporate profits reliant on price hikes rather than productivity, pressure on long-term interest rates, and better performance outside the US (Japan and some emerging markets). Shalett's core judgment is that the market's surface is stronger than the underlying economy.


Cryptos en tendance

Questions liées

QAccording to the article, what significant record did U.S. money market funds reach in February, and what was the narrative at that time?

AIn February, U.S. money market funds surged to a historical peak of approximately $8.25 trillion. The prevailing narrative at that time was that smart money was seeking shelter in cash, with super-wealthy individuals appearing to withdraw from the stock market.

QHow has the situation changed by June, specifically regarding the flow of funds and stock market performance?

ABy June, the situation reversed. Money market fund assets had decreased to $7.87 trillion by June 10, indicating an outflow of cash. Conversely, the stock market reached new highs, with the S&P 500 closing above 7600 points for the first time on June 2, marking a nine-day winning streak.

QWhat was the performance gap between holding cash (in a money market fund) and holding stocks (the S&P 500) from the start of the 2022 bear market to the present, as cited in the article?

AFrom the start of the 2022 bear market to the present, the S&P 500 delivered a total return of approximately 42%, while the Vanguard Federal Money Market Fund returned only about 18%. Holding cash thus resulted in missing more than double the returns of the stock market over that period.

QWhere are wealthy individuals, who reduced their stock holdings, reallocating their capital according to the Goldman Sachs survey mentioned in the article?

AAccording to the Goldman Sachs survey, wealthy individuals who reduced stock holdings are reallocating capital into alternative investments. This includes areas such as real estate, art, private credit, and hedge funds. Nearly 40% of those with $1-5 million in investable assets and 80% of those with over $10 million hold such alternative investments.

QWhat are the updated year-end price targets for the S&P 500 from Goldman Sachs and Morgan Stanley, and what are their primary reasons for these bullish forecasts?

AGoldman Sachs, led by strategist Ben Snider, raised its year-end target for the S&P 500 to 8000 points from 7600, citing AI-driven earnings growth. Morgan Stanley's Chief Investment Officer Lisa Shalett set a one-year target of 8300 points, forecasting about 11-12% upside, based on continued market strength, though she also listed several underlying economic risks.

Lectures associées

Pourquoi le Bitcoin maintient 64 000 $ après la pause restrictive de la Fed

Le Bitcoin se stabilise autour de 64 000 $ après la décision de la Fed de maintenir ses taux d'intérêt dans la fourchette 3,50-3,75 %. Bien que perçu comme une pause, le vote a révélé des divisions internes, trois membres plaidant pour une hausse, signalant une attitude globalement restrictive. Cette position limite l'appétit pour les actifs risqués comme les cryptomonnaies. Le marché a réagi avec une volatilité modérée. Les FNB spot sur Bitcoin ont enregistré un afflux net de 32,1 millions de dollars, mettant fin à une série de sorties, tandis que les FNB Ethereum ont subi des sorties. Cela indique une rotation des capitaux vers l'actif principal. Les niveaux clés à surveiller pour le Bitcoin sont le support à 63 000-63 500 $ et la résistance autour de 66 000 $. Malgré la pression macroéconomique, le marché ne montre pas de signes de capitulation. Les fondamentaux du réseau Ethereum restent solides avec une file d'attente importante pour le staking. Le report du vote sur le CLARITY Act au Sénat américain a tempéré les attentes réglementaires immédiates. Pour la fin du mois, les données macro américaines (inflation, dépenses) guideront les senteurs. Le scénario de base prévoit une consolidation du Bitcoin entre 63 000 et 66 000 $. La résilience au-dessus de 63 000 $, le maintien de l'Ethereum au-dessus de 1 860 $ et la poursuite des entrées institutionnelles seront des facteurs déterminants pour une éventuelle reprise au second semestre.

cryptonews.ruIl y a 1 h

Pourquoi le Bitcoin maintient 64 000 $ après la pause restrictive de la Fed

cryptonews.ruIl y a 1 h

Parker Lewis explique pourquoi le bitcoin reste la meilleure monnaie

Parker Lewis, un analyste bitcoin renommé, a critiqué les stratégies marketing des entreprises qui se présentent comme des trésoreries crypto. Il estime que la vente d'actions privilégiées perpétuelles, présentées comme un "crédit numérique", déforme fondamentalement la nature du bitcoin. Il souligne que le bitcoin n'a pas de rendement fiduciaire intégré et que les promesses de dividendes reposent sur un modèle risqué nécessitant un afflux constant de nouveaux investisseurs. Lewis met en garde contre les risques de ces dérivés, notant que le marché des actions privilégiées perpétuelles (1 000 milliards de dollars) est minuscule comparé au marché du crédit mondial (300 000 milliards de dollars), car les institutions évitent ces risques qu'elles transfèrent aux particuliers. Il rejette également l'idée que la volatilité du bitcoin le rende impropre à la plupart des gens. Pour lui, cette volatilité est une conséquence naturelle de l'adoption massive d'un actif à offre fixe et inélastique. Il conseille d'acheter des bitcoins directement plutôt que des actions d'entreprises comme MicroStrategy. Détourner l'attention vers ces dérivés corporatifs fait oublier la vraie menace : la dépréciation rapide des monnaies fiduciaires. Lewis illustre cela avec son "indice du ribeye", montrant une inflation annuelle de 12 à 13% sur le prix d'un steak, bien supérieure aux chiffres officiels. La stratégie la plus sûre, selon lui, reste la possession directe de bitcoin et le contrôle de ses clés privées, pour se protéger des turbulences macroéconomiques, plutôt que de courir après des rendements corporatifs douteux qui amplifient les risques systémiques.

cryptonews.ruIl y a 1 h

Parker Lewis explique pourquoi le bitcoin reste la meilleure monnaie

cryptonews.ruIl y a 1 h

Trading

Spot

Articles tendance

Comment acheter SUPER

Bienvenue sur HTX.com ! Nous vous permettons d'acheter SuperFarm (SUPER) de manière simple et pratique. Suivez notre guide étape par étape pour commencer votre parcours crypto.Étape 1 : Création de votre compte HTXUtilisez votre adresse e-mail ou votre numéro de téléphone pour ouvrir un compte sur HTX gratuitement. L'inscription se fait en toute simplicité et débloque toutes les fonctionnalités.Créer mon compteÉtape 2 : Choix du mode de paiement (rubrique Acheter des cryptosCarte de crédit/débit : utilisez votre carte Visa ou Mastercard pour acheter instantanément SuperFarm (SUPER).Solde :utilisez les fonds du solde de votre compte HTX pour trader en toute simplicité.Prestataire tiers :pour accroître la commodité d'utilisation, nous avons ajouté des modes de paiement populaires tels que Google Pay et Apple Pay.P2P :tradez directement avec d'autres utilisateurs sur HTX.OTC (de gré à gré) : nous offrons des services personnalisés et des taux de change compétitifs aux traders.Étape 3 : stockage de vos SuperFarm (SUPER)Après avoir acheté vos SuperFarm (SUPER), stockez-les sur votre compte HTX. Vous pouvez également les envoyer ailleurs via un transfert sur la blockchain ou les utiliser pour trader d'autres cryptos.Étape 4 : tradez des SuperFarm (SUPER)Tradez facilement SuperFarm (SUPER) sur le marché Spot de HTX. Il vous suffit d'accéder à votre compte, de sélectionner la paire de trading, d'exécuter vos trades et de les suivre en temps réel. Nous offrons une expérience conviviale aux débutants comme aux traders chevronnés.

365 vues totalesPublié le 2024.12.11Mis à jour le 2026.06.02

Comment acheter SUPER

Discussions

Bienvenue dans la Communauté HTX. Ici, vous pouvez vous tenir informé(e) des derniers développements de la plateforme et accéder à des analyses de marché professionnelles. Les opinions des utilisateurs sur le prix de SUPER (SUPER) sont présentées ci-dessous.

活动图片