Undercurrents of Capital in the Midst of Middle East Turmoil: Option Data Reveals BTC's Safe-Haven Logic

比推Publié le 2026-03-02Dernière mise à jour le 2026-03-02

Résumé

Amidst the unprecedented geopolitical shock triggered by the U.S.-Israel military strike on Iran on March 1, 2026, global markets witnessed a classic flight to safety, with oil and gold surging while risk assets faced initial sell-offs. Bitcoin, positioned between its “digital gold” narrative and high-risk asset attributes, showed resilience by holding the key support level of $67,000. Deribit期权数据揭示BTC期权隐含波动率 surged to 51.3%, reflecting heightened expectations of near-term volatility. The significant divergence between the spot price (~$67,400) and the options max pain point at $76,000 indicates persistent institutional bullish sentiment before the crisis. The put/call open interest ratio of 0.75 shows dominant call holdings, while the 24-hour volume put/call ratio of 1.37 reveals tactical hedging via puts amid the crisis. A break below $65,000 could trigger a sell-off due to market maker hedging, potentially testing $60,000. Conversely, if tensions ease, a gamma squeeze above $70,000 could rapidly push BTC toward the $76,000 max pain level. The event underscores Bitcoin’s growing role as a non-sovereign, uncorrelated asset in institutional portfolios amid escalating geopolitical risks.

On March 1, 2026, the global macro markets encountered an epic "black swan" event: direct military strikes by the United States and Israel against Iran resulted in the death of Iran's Supreme Leader, Ayatollah Khamenei.

This extreme tail-risk event instantly reshaped the risk premium models for global asset classes. The complete ignition of the Middle East powder keg not only caused violent fluctuations in traditional crude oil and safe-haven assets but also pushed the cryptocurrency market, at a critical juncture of博弈, to a crossroads of liquidity and pricing power.

Combining Binance spot market data with Deribit option data, this analysis delves into the immediate impact of this geopolitical crisis on the cryptocurrency market from a quantitative and derivatives博弈 perspective, offering a forward-looking projection of future volatility paths and market trends.

The essence of geopolitical conflict is the reshaping of global supply chains, energy prices, and the ensuing inflation expectations. The financial market transmission of this surprise US-Israel attack on Iran manifested as a textbook risk-aversion pattern: commodities like crude oil and gold became the preferred safe havens, while high-risk assets faced indiscriminate selling in the first instance.

With the outbreak of high-intensity conflict in the Middle East, the primary concerns are the global energy supply chain and the safe-haven sentiment towards the fiat currency credit system. In traditional financial markets, Brent crude oil is highly likely to gap up on open due to panic over potential supply disruptions, and traditional safe-haven assets like gold will also see intensive accumulation by institutional funds. However, in the crypto asset space, BTC's "digital gold" narrative and its "high-beta risk asset"属性 are experiencing intense internal conflict.

From a macro liquidity perspective, panic induced by geopolitics (a soaring VIX index) typically triggers cross-asset indiscriminate selling in the first instance to secure US dollar liquidity. But after a brief liquidity squeeze, Bitcoin, which is不受特定主权国家控制 and possesses抗审查与便携属性, often attracts capital fleeing from high-risk emerging market fiat currencies.

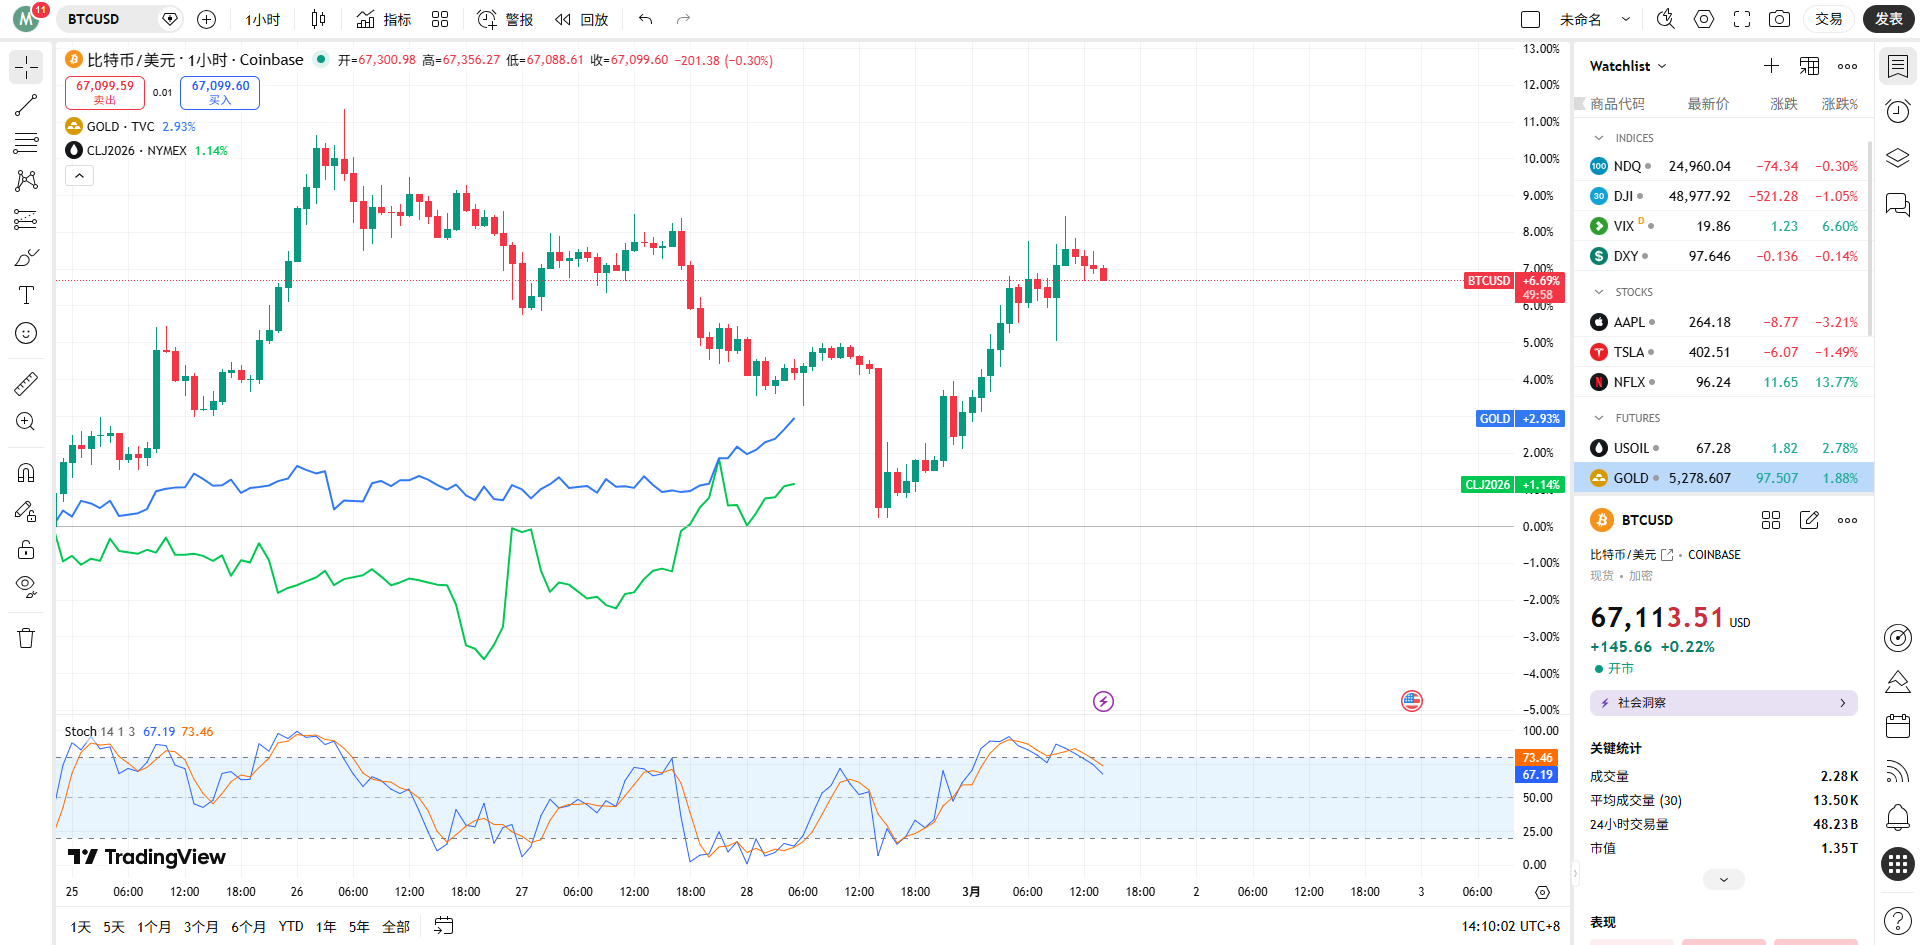
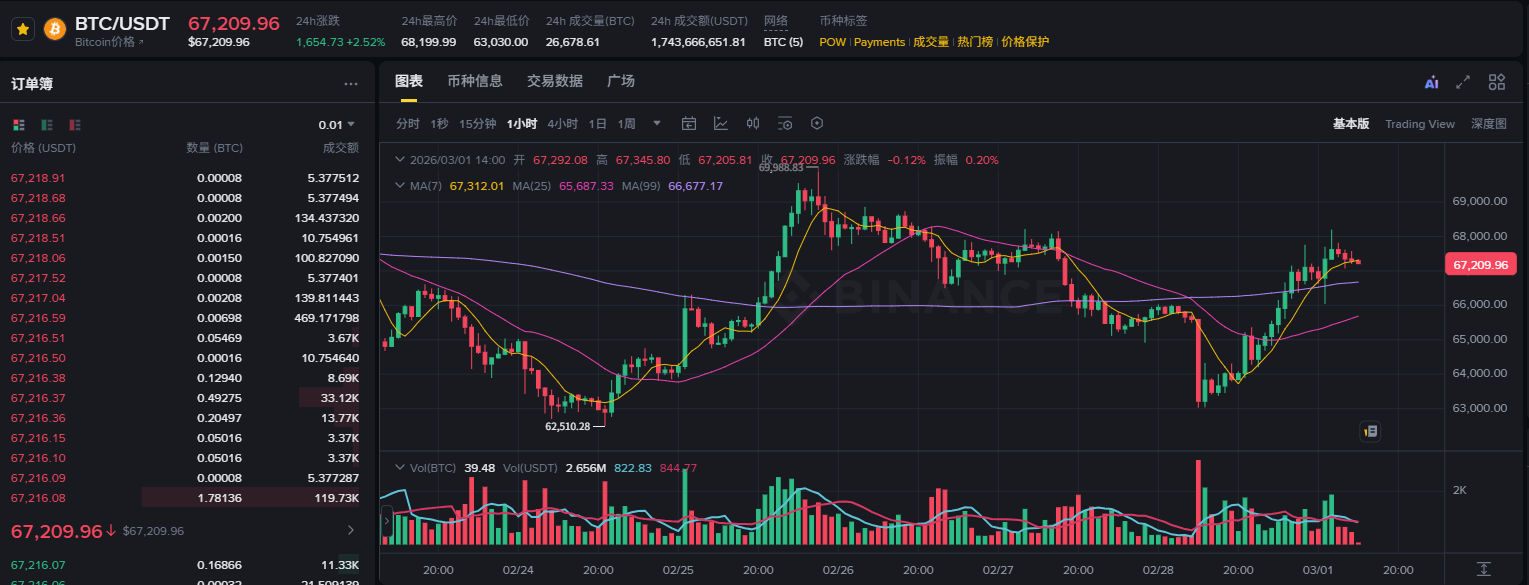
Combining Binance's spot and contract market data (as of 14:00 on March 1, 2026), the BTC/USDT spot price is oscillating around $67,392. In the initial phase of such a major geopolitical crisis, BTC did not experience a crash similar to the "312" event of 2020 but tenaciously held the key support level of $67,000.

The 24-hour trading volume reached a high of $1.74 billion, indicating significant disagreement and turnover between bulls and bears at this level. The moving average system in the price chart shows a pattern of high volatility after a多头排列, suggesting that, under the impact of sudden news, the承接盘力量 in the spot market is exceptionally robust, and the long-term配置底仓 of institutional funds has not fundamentally shifted.

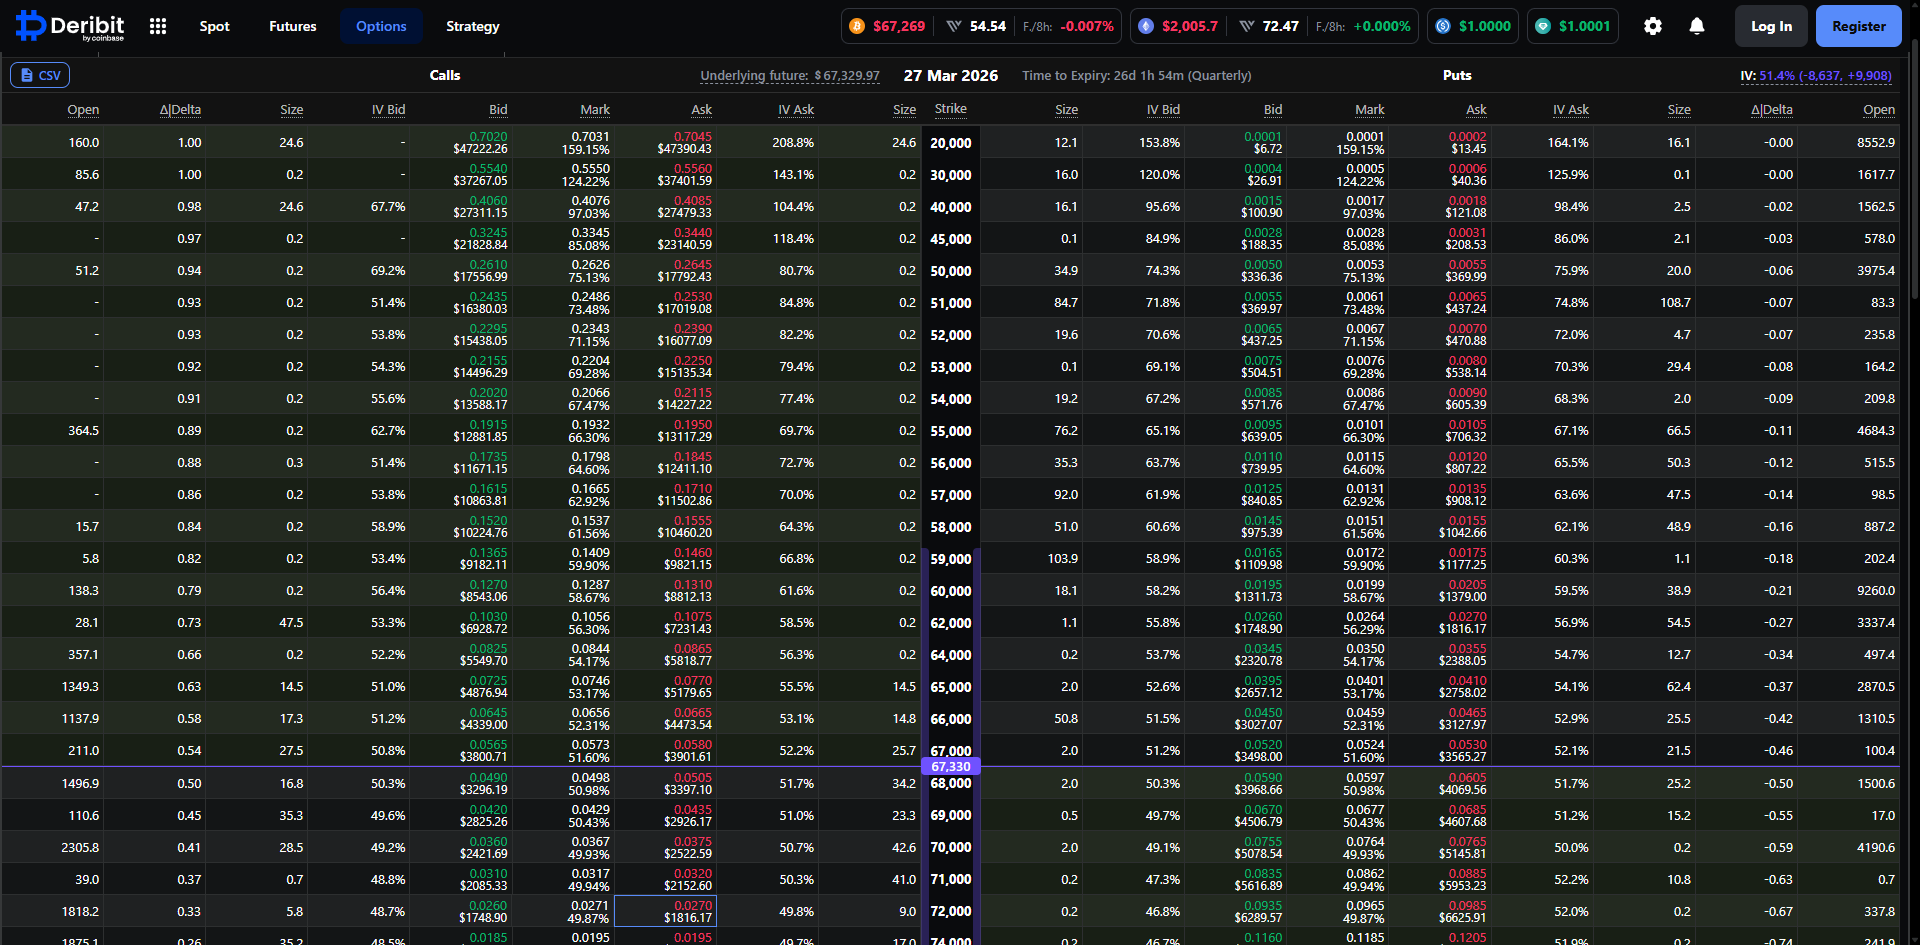
To透视聪明资金的真实意图, the derivatives market, especially option data, provides the most直观的量化截面. By analyzing the current BTC option data expiring on March 27, 2026, on the Deribit platform, we can clearly outline the path projection of major institutions for the next month.

The current implied volatility (IV) for BTC options expiring on March 27 has reached a relatively high level of 51.3%. Against the backdrop of the geopolitical crisis, option sellers quickly raised the volatility surface to hedge against the Gamma exposure risks posed by extreme market movements. An IV above 51% indicates the market is hedging against potential wide fluctuations in the next two to three weeks. For quantitative traders, the risk-reward ratio for selling volatility at this time is extremely poor, and the market is overall in a frenzy of "buying straddles" or constructing tail-risk protection.

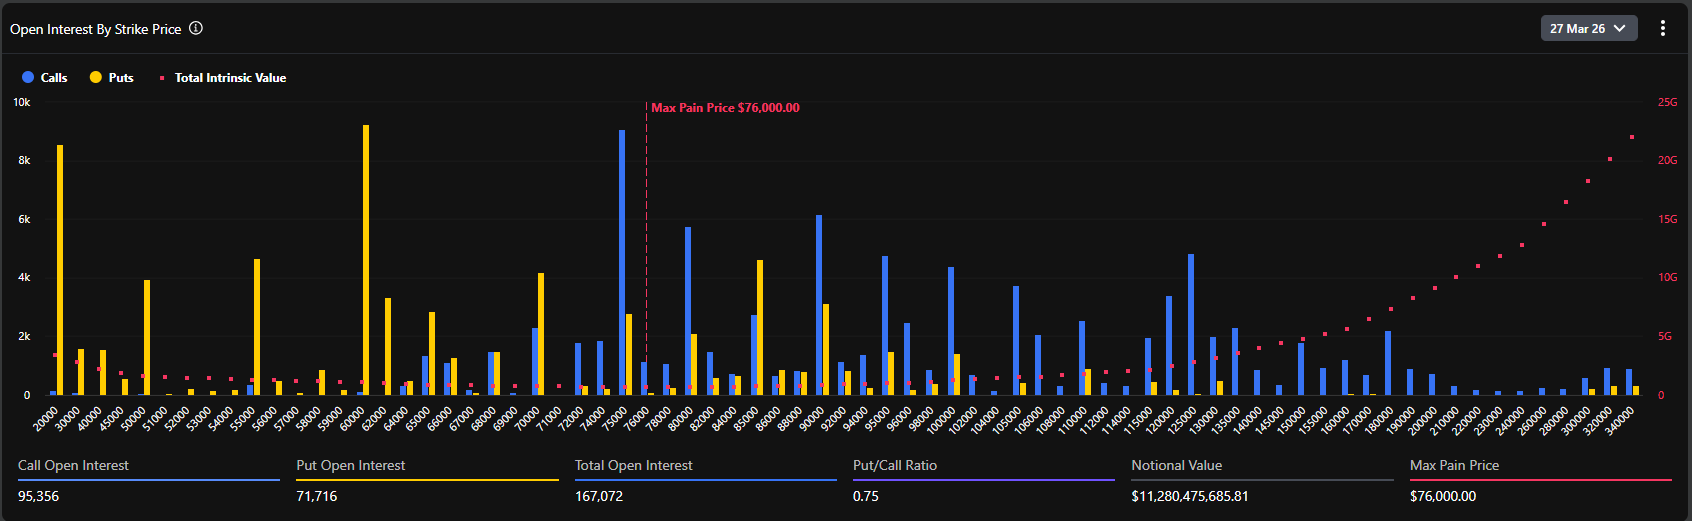
According to the open interest (OI) distribution chart for options, the current global maximum pain point is as high as $76,000. This is a highly forward-looking and controversial data point.

Typically, as expiration approaches, the underlying asset price tends to gravitate towards the maximum pain point to minimize the overall value for option buyers. However, the current spot price (around $67,400) is at a discount of nearly 12% to the maximum pain point ($76,000). This significant deviation reveals two core logics:

First, before the crisis erupted, the market was in an extremely optimistic bullish sentiment, with substantial funds betting on breaking through the all-time high (the $75,000–$80,000 range) by the end of March, which directly pushed the maximum pain point higher.

Second, the outbreak of the geopolitical crisis constituted a strong external shock, suppressing the upward momentum of the spot price. But judging from the total open interest of 167,072 BTC (notional value exceeding $11.2 billion), long positions did not experience large-scale unwinding and stampede due to the war news.

Data shows that the current put/call ratio (based on OI) is 0.75. This value, being below 1, indicates that from a global存量 perspective, call option (Call) open interest still dominates absolutely. Particularly at strike prices of $75,000, $80,000, and even $100,000, there are massive call open interest piles (with single strike open interest reaching nearly 10k BTC).

However, it is worth noting that the 24-hour volume PCR (Put/Call Volume Ratio) reached 1.37. The divergence between存量偏多 (0.75) and增量偏空 (1.37) perfectly captures the current market psychology: long-term institutions maintain their original long exposure (not selling spot, not closing long Calls), but in the short term following the outbreak of the Middle East war, substantial funds rushed in to buy out-of-the-money put options (OTM Puts) for tactical hedging, leading to a surge in short-term Put trading volume.

Combining detailed option data from Deribit, we observe that the distribution of Delta values is extremely dense in the $67,000 to $70,000 range. The current spot price of $67,495 is right in the "meat grinder" zone of the bull-bear struggle.

If the geopolitical situation further deteriorates, causing macro funds to withdraw en masse, and the spot price breaks below $65,000 (a strong support level), market makers, to hedge their short Put exposure, will be forced to sell in the spot or futures market, potentially triggering a wave of localized negative liquidity feedback, testing the psychological关口 of $60,000 downwards.

Conversely, if the Middle East situation enters a stalemate stage mediated by major powers after a brief violent conflict, and once the panic sentiment peaks and recedes, the rebound in the crypto market will be extremely fierce. Due to the massive accumulation of Call options in the $70,000 to $76,000 range above, once the spot price stabilizes and breaks through the $70,000 resistance level, market makers will be forced to buy spot to hedge their negative Gamma exposure. This classic "Gamma Squeeze" effect will propel the BTC price towards the maximum pain point of $76,000 at an unprecedented speed.

The aftershocks of the Middle East geopolitical tremor will continue to ferment. The subsequent actions of the US and Iran will determine the final destination of global safe-haven funds. In the foreseeable short term, BTC spot will experience violent whipsaws within a wide range of $62,000~$70,000. Leverage in the contract market will be反复清洗 during this process. Quantitative strategies should focus on "reducing leverage and capitalizing on volatility," suitable for constructing calendar spreads or grid market making at key support and resistance levels, avoiding unilateral trend exposure.

Judging from the option持仓结构, the massive expiration on March 27 is a gravitational center the market cannot bypass. Unless a global, uncontrollable World War III-level liquidity drought erupts, as panic sentiment marginally decreases, BTC's "safe-haven属性" and "anti-inflation属性" will be repriced. In mid-to-late March, the market is highly likely to initiate a restorative rebound, and the spot price has a strong incentive to move towards the $75,000–$76,000 range (the maximum pain point and dense Call strike zone).

This event marks the entry of geopolitics into a higher-risk phase. Whether it's the rekindling of inflation expectations brought by war (soaring crude oil) or the crisis of confidence in fiat currencies triggered by financial sanctions against specific countries, the strategic value of Bitcoin as a "borderless, non-sovereign hard asset" is being reinforced at the underlying logic level. For large institutions such as family offices and macro hedge funds, the单一的美元债+美股的60/40 portfolio can no longer cope with current tail risks. The allocation proportion of BTC as an "uncorrelated asset" in investment portfolios will undergo a systematic leap following this crisis.

The US and Israeli strike on Iran is the first thunderclap reshaping the global financial landscape in early 2026. Beneath the surface of panic, crypto option data冷静地揭示了机构资金's底牌 of "short-term defensive hedging, long-term依然看涨".

For professional financial practitioners, stripping away emotional noise and closely monitoring the trend of implied volatility changes and the transfer of market makers' Gamma exposure are the core codes to穿透战争迷雾 and grasp the next round of asset pricing power. With the $76,000 option maximum pain point standing like a lighthouse, every deep pullback caused by panic is accumulating potential energy for the future breakthrough.


Twitter:https://twitter.com/BitpushNewsCN

Bitpush TG Discussion Group:https://t.me/BitPushCommunity

Bitpush TG Subscription: https://t.me/bitpush

Original article link:https://www.bitpush.news/articles/7615676

Questions liées

QWhat was the immediate impact of the US-Israel military strike on Iran on global financial markets, according to the article?

AThe strike triggered a classic risk-aversion pattern: crude oil and gold surged as safe-haven assets, while high-risk assets experienced indiscriminate selling. It also caused a significant repricing of global risk premiums.

QHow did the BTC price react initially to the geopolitical crisis, and what does its resilience at the $67,000 support level indicate?

ABTC did not crash but held firm at the $67,000 key support level with high trading volume ($1.74 billion in 24 hours), indicating strong buying interest and that long-term institutional holdings remained largely unchanged.

QWhat does the high Implied Volatility (IV) of 51.3% for BTC options expiring on March 27, 2026, suggest about market expectations?

AThe elevated IV indicates that the market is pricing in and hedging against the potential for wide price swings (high volatility) over the next few weeks due to the geopolitical crisis, making shorting volatility an unattractive strategy.

QWhat is the significance of the large discrepancy between the current BTC spot price (~$67,400) and the options market 'Max Pain' point at $76,000?

AThe 12%+ gap shows that the market was extremely bullish before the crisis, with heavy call option bets above $75k. The crisis temporarily suppressed the price, but the massive open interest suggests core bullish positions were not liquidated.

QHow does the Put/Call Ratio (PCR) analysis, showing a volume PCR of 1.37 against an open interest PCR of 0.75, reflect trader positioning?

AThis divergence shows that while the overall market structure is still net long (more calls held), there was a tactical, short-term surge in buying put options for downside protection immediately after the news broke, reflecting a 'long-term bullish, short-term cautious' stance.

Lectures associées

Début de Warsh : le président de la Fed le plus au fait du Crypto de l'histoire apportera-t-il des surprises ou des chocs au marché ?

**Résumé :** Kevin Warsh, nouveau président de la Réserve fédérale américaine, s'apprête à tenir sa première conférence de presse monétaire. Sa nomination est historique : il est le premier président de la Fed à détenir personnellement des actifs numériques (investissements indirects dans Solana, dYdX, etc.), montrant une compréhension unique du secteur. Son dilemme est majeur : il doit faire face à une résurgence de l'inflation, qui exige une politique monétaire stricte (position "de faucon"), tout en répondant aux pressions politiques pour des baisses de taux. Parallèlement, son attitude envers les crypto-actifs diffère fondamentalement de celle de son prédécesseur. Il ne les considère pas comme de simples actifs spéculatifs, mais plutôt comme un "bon policier" pour la politique économique et une composante de la compétitivité américaine. Son impact potentiel sur le marché crypto s'articule autour de trois axes : 1. Un changement de paradigme réglementaire, passant de la prévention à l'intégration et à l'innovation. 2. Une reprixation des actifs liée aux taux d'intérêt, où sa clarté de communication pourrait réduire la prime d'incertitude. 3. Une légitimation accrue pouvant attirer les capitaux institutionnels traditionnels. Deux scénarios principaux sont envisagés pour sa première intervention : * **Scénario "Surprise"** : Un ton modéré ("de colombe") sur les taux combiné à des signaux favorables à l'innovation numérique pourrait booster le marché. * **Scénario "Choc"** : Un message excessivement restrictif sur les taux pourrait entraîner une vente généralisée des actifs risqués, y compris les cryptos. Bien qu'il ait dû vendre ses actifs crypto pour des raisons d'éthique, la compréhension intrinsèque de Warsh pour la technologie blockchain pourrait, à long terme, poser les bases d'une intégration plus structurelle des actifs numériques dans le système financier.

marsbitIl y a 2 h

Début de Warsh : le président de la Fed le plus au fait du Crypto de l'histoire apportera-t-il des surprises ou des chocs au marché ?

marsbitIl y a 2 h

XRP Ledger Lance le Rebranding XRPld Avec la Mise à Niveau Version 3.2.0

La version 3.2.0 du XRP Ledger (XRPL) est désormais disponible, introduisant une refonte majeure incluant le changement de nom du logiciel principal de « rippled » à « xrpld ». Cette mise à niveau se concentre principalement sur les améliorations des performances, de la sécurité et de l'évolutivité de l'infrastructure sous-jacente, plutôt que sur de nouvelles fonctionnalités utilisateur. Les principales avancées incluent des optimisations de mémoire pouvant réduire jusqu'à 40% l'utilisation de la mémoire serveur. Sur le plan de la sécurité, la modification `fixCleanup3_2_0` renforce plusieurs modules, notamment les coffres-forts à actif unique, le protocole de prêt, les échanges décentralisés et les jetons multi-usages. De nouveaux contrôles d'invariance garantissent la cohérence du registre après la suppression de comptes. Pour les développeurs, la mise à jour permet désormais de récupérer des informations sur les définitions du protocole et du serveur XRPL sans nécessiter de connexion active, facilitant ainsi la création de portefeuilles, d'explorateurs de blockchain et d'APIs. En termes d'évolutivité et de stabilité, les améliorations comprennent des tailles de bloc configurables, un stockage de base de données optimisé via nuDB, et le support optionnel de TLS/mutual TLS pour le serveur gRPC. Le port de peering par défaut est également passé du 51235 au 2459. Divers correctifs ont été apportés aux fonctions liées aux Market Makers Automatisés, aux paiements, aux séquestres de jetons et aux carnets d'ordres. Une note importante : les invariants de transaction ont été temporairement désactivés dans la v3.2.0 en raison d'un impact sur les performances, mais cela ne présente pas de risque pour la sécurité.

TheNewsCryptoIl y a 2 h

XRP Ledger Lance le Rebranding XRPld Avec la Mise à Niveau Version 3.2.0

TheNewsCryptoIl y a 2 h

L'AGI n'est pas l'arrivée, nouveau document de DeepMind : Vers l'ASI, le véritable progrès de l'IA ne fait que commencer

Si l'intelligence artificielle générale (IAG) était atteinte demain, quelle serait la prochaine étape ? Une étude de Google DeepMind suggère que l'IAG n'est pas un point final, mais une étape vers une superintelligence artificielle (ISA) dépassant les collectifs d'experts humains. L'étude distingue trois concepts : l'IAG (niveau médian humain), l'ISA (supérieure aux meilleurs collectifs humains dans presque tous les domaines) et l'IA universelle (limite théorique). Elle propose quatre voies potentielles vers l'ISA : 1. **Extension des ressources** : augmentation de la puissance de calcul, des données et des modèles. 2. **Évolution algorithmique** : améliorations incrémentales ou nouveaux paradigmes (apprentissage continu, utilisation d'outils, modèles du monde). 3. **Auto-amélioration récursive** : des IA plus performantes conçoivent la génération suivante, créant une boucle de rétroaction positive. 4. **Coordination multi-agents** : des systèmes IAG collaborant atteignent une intelligence collective supérieure. L'étude identifie six principaux goulets d'étranglement : 1. **Le mur des données** : les données humaines de haute qualité pourraient s'épuiser. 2. **Pressions économiques et ressources naturelles** : coûts énergétiques et matériels. 3. **Limites des paradigmes neuronaux actuels** : problèmes d'apprentissage continu, de raisonnement robuste, d'hallucinations. 4. **Difficulté croissante de la recherche**. 5. **Barrières à l'abstraction** : difficulté à former de nouveaux concepts fondamentaux. 6. **Régulation, gouvernance et réaction sociale**. Un défi crucial est l'évaluation des capacités de l'IA au-delà du niveau humain, nécessitant de nouveaux benchmarks. L'étude conclut que la progression vers l'ISA reste incertaine, soumise à des contraintes physiques et de ressources, et appelle à un effort de recherche interdisciplinaire pour mieux anticiper cette évolution.

marsbitIl y a 3 h

L'AGI n'est pas l'arrivée, nouveau document de DeepMind : Vers l'ASI, le véritable progrès de l'IA ne fait que commencer

marsbitIl y a 3 h

Trading

Spot
Futures

Articles tendance

Comment acheter EPIC

Bienvenue sur HTX.com ! Nous vous permettons d'acheter Epic Chain (EPIC) de manière simple et pratique. Suivez notre guide étape par étape pour commencer votre parcours crypto.Étape 1 : Création de votre compte HTXUtilisez votre adresse e-mail ou votre numéro de téléphone pour ouvrir un compte sur HTX gratuitement. L'inscription se fait en toute simplicité et débloque toutes les fonctionnalités.Créer mon compteÉtape 2 : Choix du mode de paiement (rubrique Acheter des cryptosCarte de crédit/débit : utilisez votre carte Visa ou Mastercard pour acheter instantanément Epic Chain (EPIC).Solde :utilisez les fonds du solde de votre compte HTX pour trader en toute simplicité.Prestataire tiers :pour accroître la commodité d'utilisation, nous avons ajouté des modes de paiement populaires tels que Google Pay et Apple Pay.P2P :tradez directement avec d'autres utilisateurs sur HTX.OTC (de gré à gré) : nous offrons des services personnalisés et des taux de change compétitifs aux traders.Étape 3 : stockage de vos Epic Chain (EPIC)Après avoir acheté vos Epic Chain (EPIC), stockez-les sur votre compte HTX. Vous pouvez également les envoyer ailleurs via un transfert sur la blockchain ou les utiliser pour trader d'autres cryptos.Étape 4 : tradez des Epic Chain (EPIC)Tradez facilement Epic Chain (EPIC) sur le marché Spot de HTX. Il vous suffit d'accéder à votre compte, de sélectionner la paire de trading, d'exécuter vos trades et de les suivre en temps réel. Nous offrons une expérience conviviale aux débutants comme aux traders chevronnés.

218 vues totalesPublié le 2025.03.17Mis à jour le 2026.06.02

Comment acheter EPIC

Discussions

Bienvenue dans la Communauté HTX. Ici, vous pouvez vous tenir informé(e) des derniers développements de la plateforme et accéder à des analyses de marché professionnelles. Les opinions des utilisateurs sur le prix de EPIC (EPIC) sont présentées ci-dessous.

活动图片