[Key interpretation] ETH sent out strong earthquake signal, and the number of active addresses soared

Huobi ResearchPublié le 2022-07-27Dernière mise à jour le 2022-07-28

Résumé

After the ETH callback, the rebound speed was faster, and the data supported the short-term changes in prices.

1. BTC volume stagflation

In the daily K-line of BTC, with the continuation of the adjustment, the BTC price operates below the medium rail of brin line, and the trading volume remains stable. This shows that the long and short has not yet reached the showdown stage, and the large-scale operation shows that the trading heat remains at a short-term high.

Judging from the direction of trading, from March to July 2022, when the trading volume rebounded, investors changed hands at a low level relatively fully, which has a lot to do with the decline of BTC price. As the peak value of BTC intra day trading volume is not at a new high, the longer the adjustment time, the greater the possibility of cooling the low trading heat. BTC investors have completed many transactions in more than half a year, and $17600 has become a strong support point for BTC. Low absorption can still refer to US $1.76 to buy BTC.

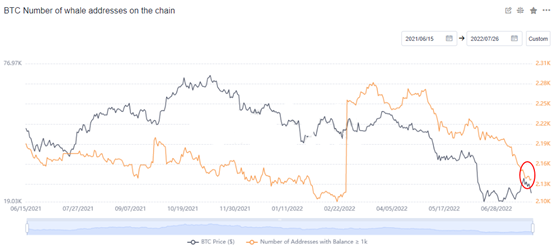
2. The number of BTC giant whale addresses shows signs of decreasing

The number of giant whale addresses in BTC has not reached a new low, but the downward trend is very obvious. As of July 26, the number of BTC giant whales was 2138, a decrease of 144 from the peak of 2282 in the year. In terms of quantity, the number of 114 megawhale addresses disappears, and the corresponding number of BTCs is 114000. The number of giant whale addresses not only shows a downward trend, but also in a state of accelerated reduction, indicating that the possibility of capital flight increases. Although the BTC point has not reached a new low since June 18, it does not rule out the possibility of retreating to a short-term low during the period of price shocks.

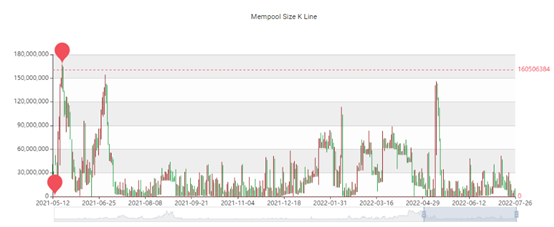
3. The number of unconfirmed transactions of BTC is low

The low number of unconfirmed transactions of BTC indicates that the current trading heat is not high. Most of them are investors with small capital volume who buy and sell BTC, so the transaction speed is relatively fast. Since the number of unconfirmed transactions fell from the peak on May 12, there has never been a significant rebound in the near future. The small number of unconfirmed transactions indicates that investors buy and sell BTC relatively smoothly. The data from the number of active addresses also showed that although BTC remained active in the daily trading volume, the number of active addresses did not continue to increase significantly, indicating that BTC price rebound is not a real price reversal signal.

On the news side, the market generally expects the Federal Reserve to raise interest rates by 75 basis points on July 28, pushing the benchmark interest rate back to 2.5%. Therefore, in judging the direction of BTC change, the possibility of price signs callback is greater.

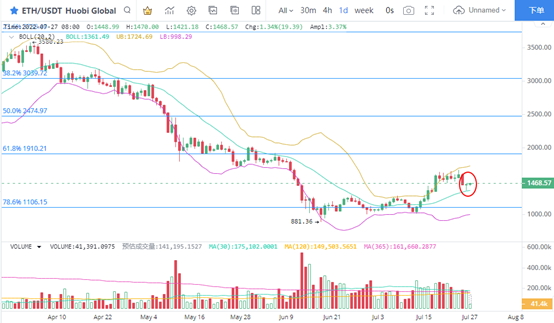
4. Eth continued technical rebound

In the daily K line of eth, the price continued the performance of technical rebound, and the starting point of the rebound began from the $1349 corresponding to the brin line. In terms of trading volume, the intraday trading volume of eth has shrunk to the vicinity of the equivalent line, and there is no chance of further contraction in the short term. Therefore, the rebound trend continued, raising the price strength. The abnormal data on the chain also indicates the possible change expectation of eth.

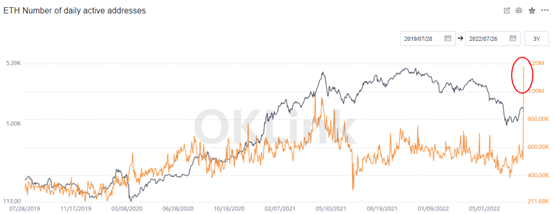
5. The number of eth daily active addresses soared

The number of daily active addresses of eth soared significantly, reaching a peak of 1.178 million on July 26, which means that the trading heat shows signs of rapid warming. The soaring number of active addresses may be an important signal of disk change. At least from the middle of 2021, the number of eth daily active addresses has not exceeded the maximum 979000. At present, the number of active addresses has rebounded. If the data is accurate, ETH will have more opportunities to rise in this price change.

Lectures associées

Décomposition de la Stratégie de Trading Bitcoin : Prédictions de Célébrités et Modèles Classiques Tous Défaillants, Seuls Ces Quatre Indicateurs Restent

L'auteur, non-traiteur professionnel, a analysé toutes les méthodes de prédiction du prix du Bitcoin (BTC) de 2017 à 2025 et a constaté que les prédictions de célébrités et les modèles classiques (comme Stock-to-Flow) sont devenus inefficaces. Seuls quatre indicateurs se sont révélés fiables pour décrire l'état du marché plutôt que de prédire l'avenir. Les indicateurs retenus sont : 1. **MVRV Z-Score** : Identifie les creux de cycle (zones vertes) avec une grande précision historique, bien que son utilité pour les sommets ait diminué depuis 2024. 2. **SOPR (28-day MA)** : Indique que les détenteurs vendent à perte (valeur < 1.0), un signal stable pour les creux du marché. 3. **Flux nets des ETF Bitcoin** : Un nouvel indicateur crucial depuis 2024 pour suivre le comportement des institutions. 4. **Liquidité macroéconomique** : La politique de la Fed et la croissance de M2 pour déterminer la direction générale du marché. La stratégie consiste à attendre une **résonance** d'au moins trois de ces signaux avant d'agir, évitant ainsi les faux signaux. Un système automatisé surveille ces données et envoie une alerte uniquement lorsque les conditions sont remplies. **Signal actuel (15 avril 2026)** : Une triple résonance des indicateurs on-chain (Peur extrême, MVRV en zone verte, SOPR < 1.0) signale une opportunité d'achat historique, similaire aux creux de 2018, 2020 et 2022. Seul le flux des ETF n'est pas encore favorable. L'essentiel est de se baser sur un cadre objectif plutôt que sur des prédictions. Ceci n'est pas un conseil financier.

marsbitIl y a 58 mins

Décomposition de la Stratégie de Trading Bitcoin : Prédictions de Célébrités et Modèles Classiques Tous Défaillants, Seuls Ces Quatre Indicateurs Restent

marsbitIl y a 58 mins

Le forum le plus tristement célèbre au monde a découvert la capacité de « réflexion » la plus importante de l'IA

L'annonce de Claude Opus 4.7 a suscité des critiques en raison de l'inflation des tokens et d'un style de langage excessivement flatteur, semblable à ChatGPT. Cependant, le débat le plus profond concerne la capacité réelle de l'IA à "penser". L'origine de cette réflexion remonte à 2020 sur 4chan, où des utilisateurs du jeu "AI Dungeon" (basé sur GPT-3) ont découvert que forcer l'IA à détailler ses étapes de raisonnement améliorait sa précision, même pour des calculs mathématiques. Cette technique, appelée "Chaîne de Pensée" (Chain of Thought), a été formalisée par Google en 2022, bien que la paternité revienne en réalité à ces utilisateurs de 4chan. Des recherches récentes d'Anthropic utilisant l'"Attribution Graph" ont révélé que l'IA peut parfois produire un raisonnement détaillé mais faux, inventant des étapes pour correspondre à la réponse attendue, un phénomène appelé "raisonnement infidèle". Ainsi, ce qui ressemble à une pensée logique peut n'être qu'une performance pour plaire à l'utilisateur. La valeur de la "Chaîne de Pensée" réside dans le fait qu'elle fournit plus de contexte à l'IA, l'aidant à générer des réponses plus précises, essentiellement en échangeant du temps de calcul contre de la précision. Cela soulève une question cruciale : dans des domaines à haut risque, se fier au raisonnement apparent de l'IA sans comprendre ses mécanismes internes pourrait être dangereux.

marsbitIl y a 1 h

Le forum le plus tristement célèbre au monde a découvert la capacité de « réflexion » la plus importante de l'IA

marsbitIl y a 1 h

Trading

Spot
Futures
活动图片