Excerpt
Bitcoin broke through the $114k–$117k supply zone to reach a new all-time high near $126k, backed by strong ETF inflows and renewed mid-tier accumulation. While on-chain and spot signals remain constructive, rising leverage and crowded call positioning suggest growing short-term fragility.
Executive Summary
- On-chain profitability has surged, with 97% of supply now in profit. While elevated profit levels often precede consolidation, realized profits remain contained, suggesting an orderly rotation rather than distribution pressure.
- The $117K supply cluster has been flipped into support, marking a structural pivot where small and mid-sized holders continue to accumulate, offsetting moderate profit-taking from larger entities.
- Bitcoin has broken to new all-time highs near $126K, driven by renewed spot demand and record ETF inflows exceeding $2.2B. The surge in institutional participation has lifted both price and market activity, with spot volumes reaching multi-month highs as Q4 begins.
- Derivatives markets expanded sharply during the rally, with futures open interest and funding rates rising as late longs entered. The current pullback is now testing this leverage, helping to reset positioning and restore balance.
- In the options market, implied volatility has lifted, skew turned neutral, and call-heavy flows dominate. Momentum remains strong, but bullish positioning is becoming increasingly crowded.
Bitcoin has broken through the dense supply cluster held by top buyers between $114k and $117k, establishing a new all-time high at $126k. This breakout signals renewed market strength but also raises questions about sustainability at elevated levels. In this edition, we analyze on-chain accumulation and distribution patterns alongside spot and options market dynamics to assess short-term risk, market resilience, and the potential for continuation or near-term fragility.
On-Chain Outlook
Accumulation Resurgence
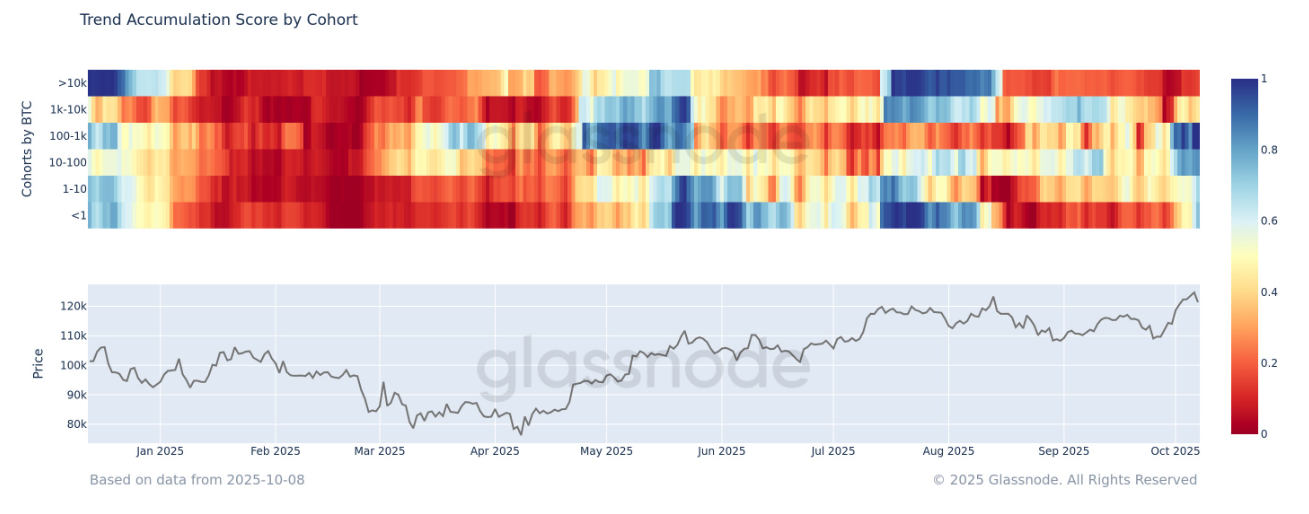
Following Bitcoin’s breakout to new highs, we turn to the Trend Accumulation Score to evaluate underlying demand strength. This metric measures the balance between accumulation and distribution across wallet cohorts.
Recent readings indicate a clear resurgence in buying, driven by small to mid-sized entities (10–1k BTC), which have accumulated consistently over the past few weeks. Meanwhile, whale distribution has eased from earlier in the year. The alignment among mid-tier holders points to a more organic accumulation phase, adding structural depth and resilience to the ongoing rally.
Resistance Flipped into Support
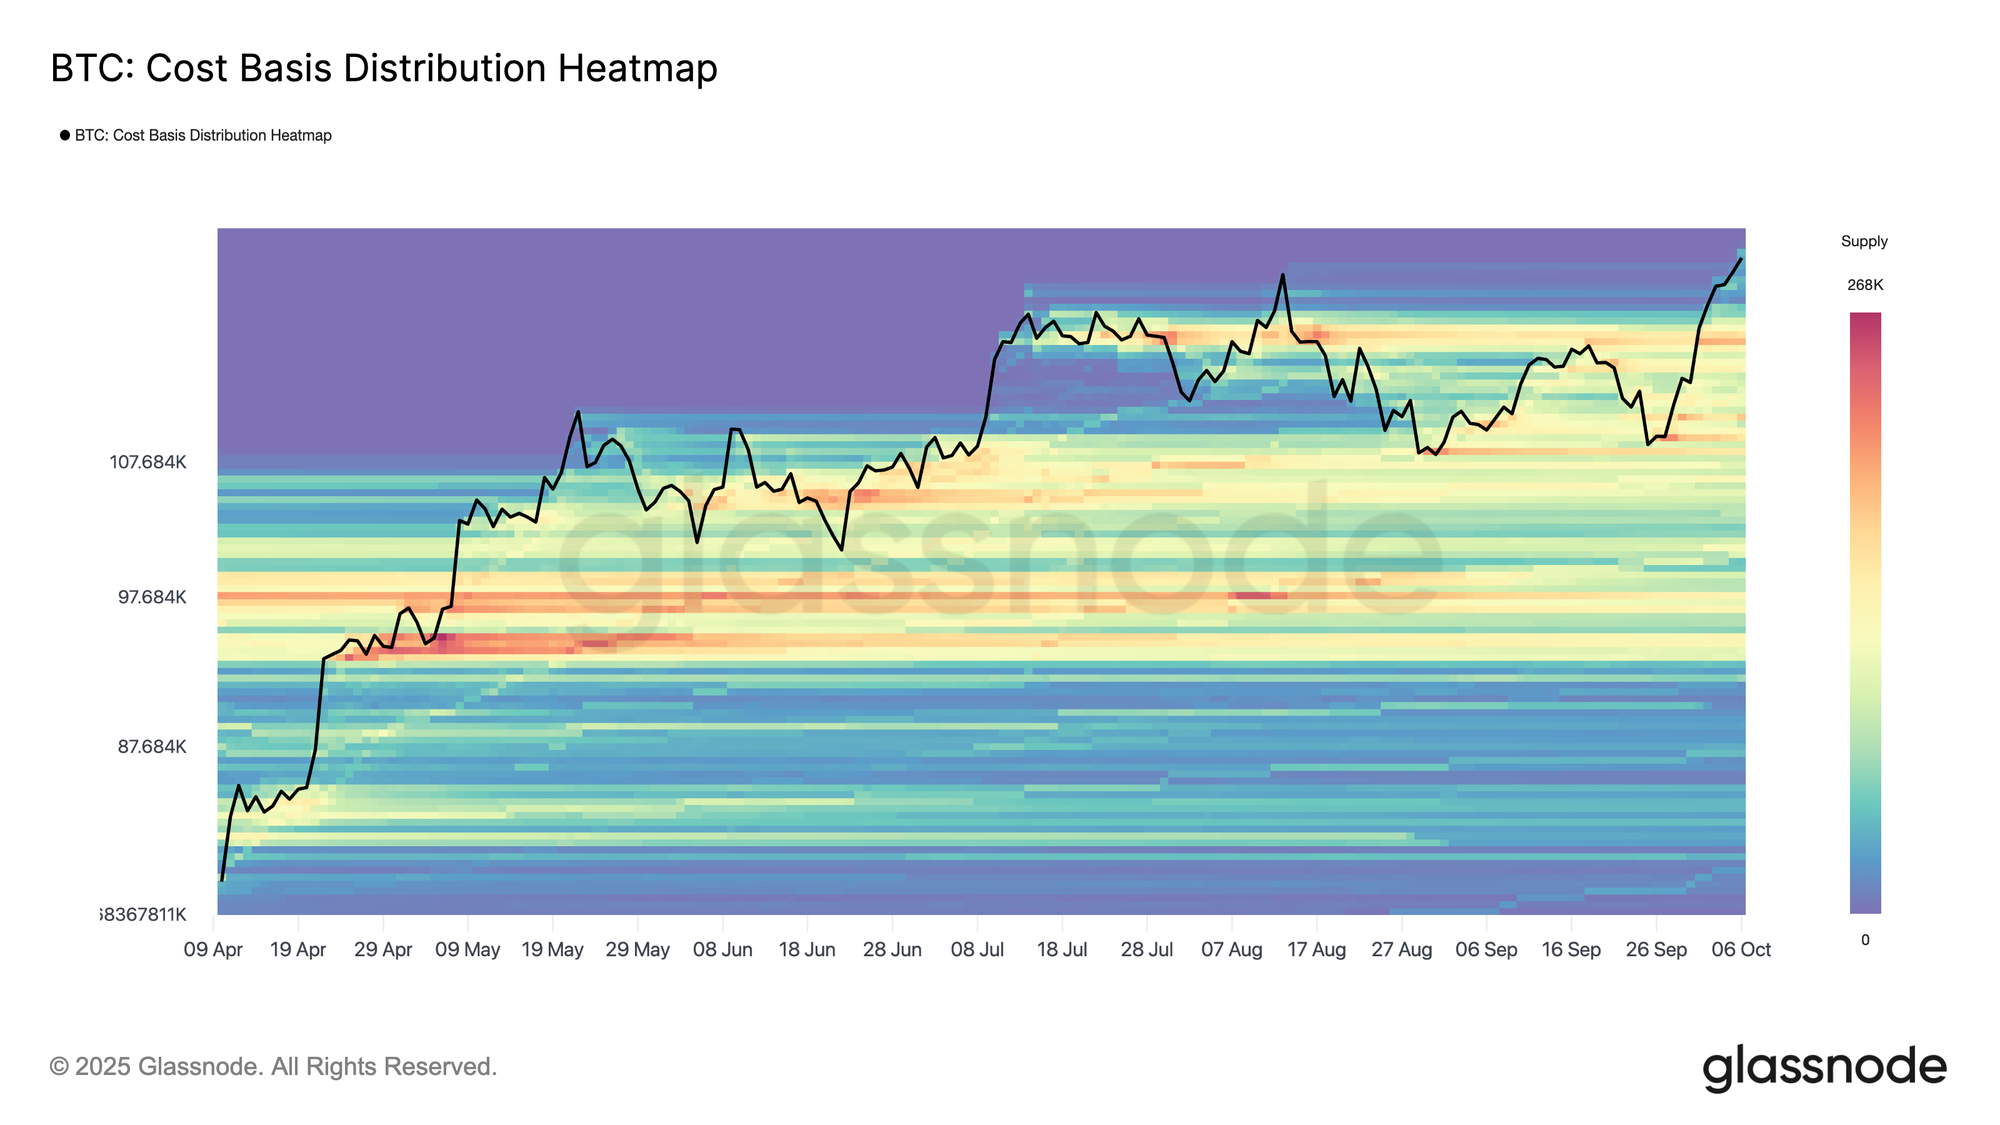
Building on the accumulation trend, Bitcoin’s rally to a new all-time high has lifted nearly all circulating supply back into profit. The Cost Basis Distribution Heatmap shows limited structural support between $121k and $120k, with a stronger cluster near $117k, where roughly 190k BTC were last acquired.
While price discovery phases inherently carry the risk of exhaustion, a potential pullback into this region could invite renewed demand as recent buyers defend profitable entry zones, marking a key area to watch for stabilization and a resurgence of momentum.
Mild Profit-Taking
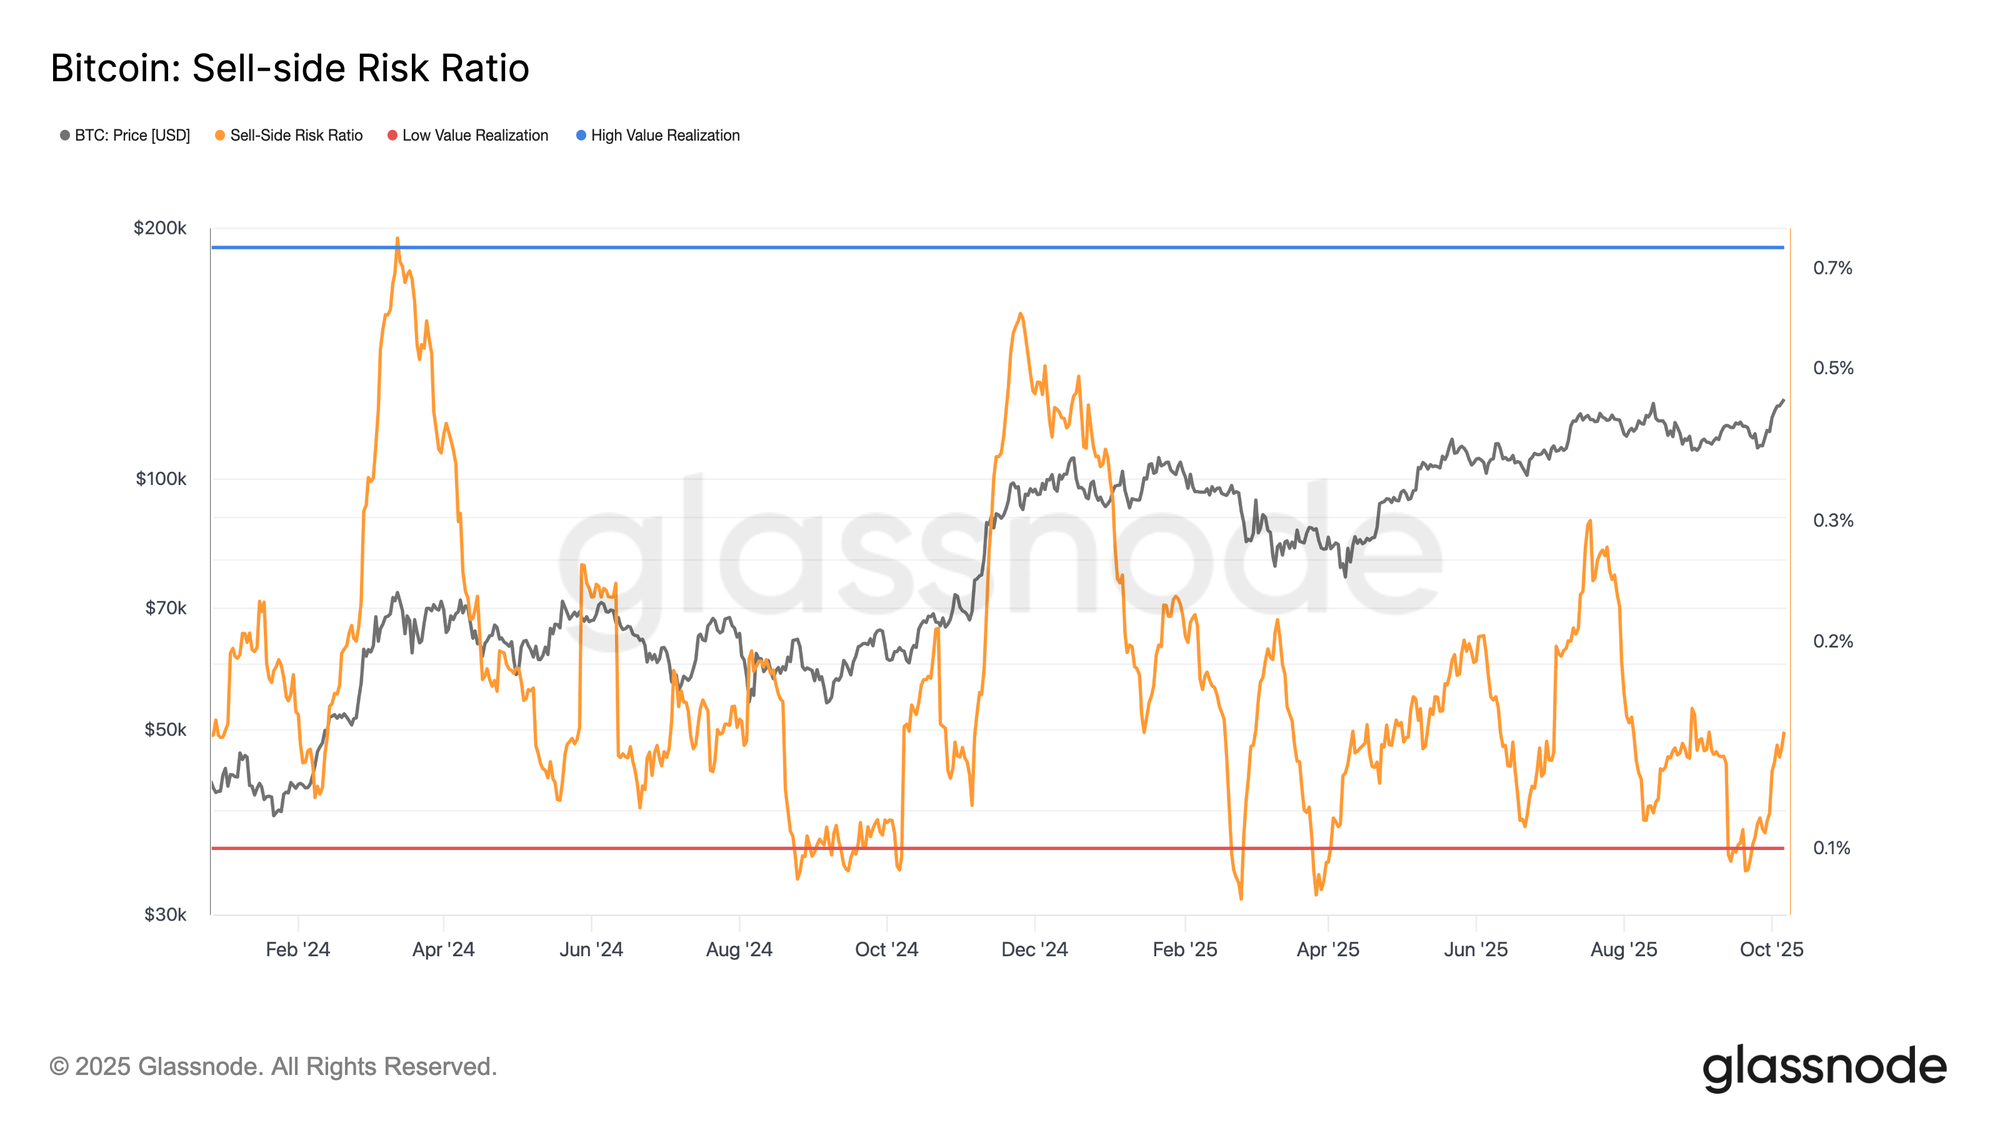
As Bitcoin enters a price discovery phase, assessing the degree of profit realization helps gauge whether the rally remains sustainable. The Sell-Side Risk Ratio, which measures the value of realized profits and losses relative to total realized value, serves as a proxy for investors’ willingness to spend their coins.
Recently, this ratio has rebounded from its lower bound, signalling a rise in profit-taking after a quiet period. Although still well below historical extremes tied to cycle tops, this uptick indicates that investors are locking in gains in a measured fashion. Overall, selling remains controlled and consistent with a healthy bullish phase, though continued monitoring is warranted as prices advance.
Spot and Futures Analysis
ETF Flows Drive Bitcoin to New Highs
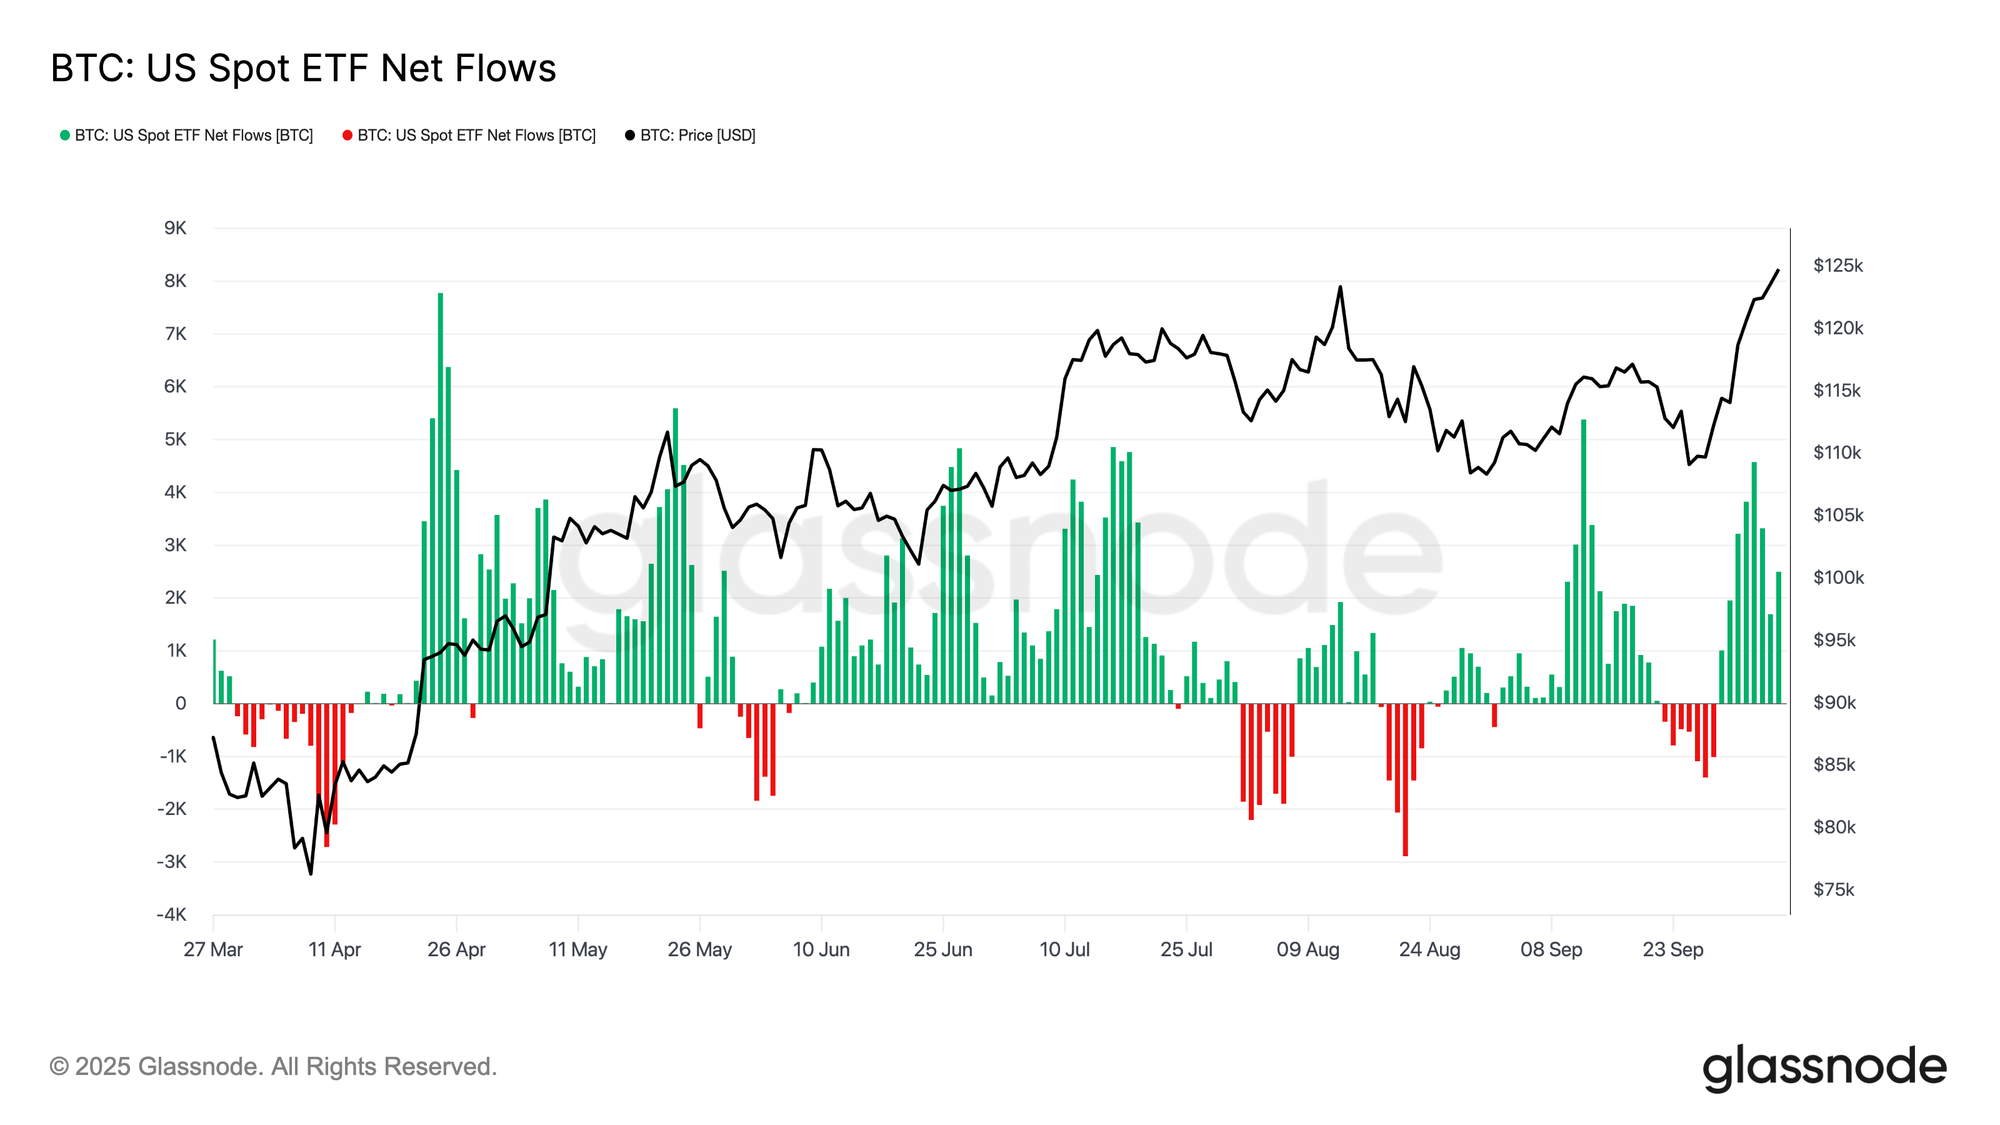
Shifting focus from on-chain dynamics to market demand, Bitcoin’s breakout to new all-time highs near $126k has been underpinned by a sharp resurgence in U.S. spot ETF Inflows.
Following September’s redemptions, more than $2.2B has poured back into ETFs within a single week, marking one of the strongest buying waves since April. This renewed institutional participation has absorbed available spot supply and strengthened overall market liquidity. Seasonally, Q4 has historically been Bitcoin’s strongest quarter, often coinciding with renewed risk appetite and portfolio rebalancing.
As broader markets tilt toward higher-beta assets such as crypto and small caps, sustained ETF inflows through October and November could provide a durable tailwind, anchoring confidence and supporting prices into year-end.
Spot Volume is Back
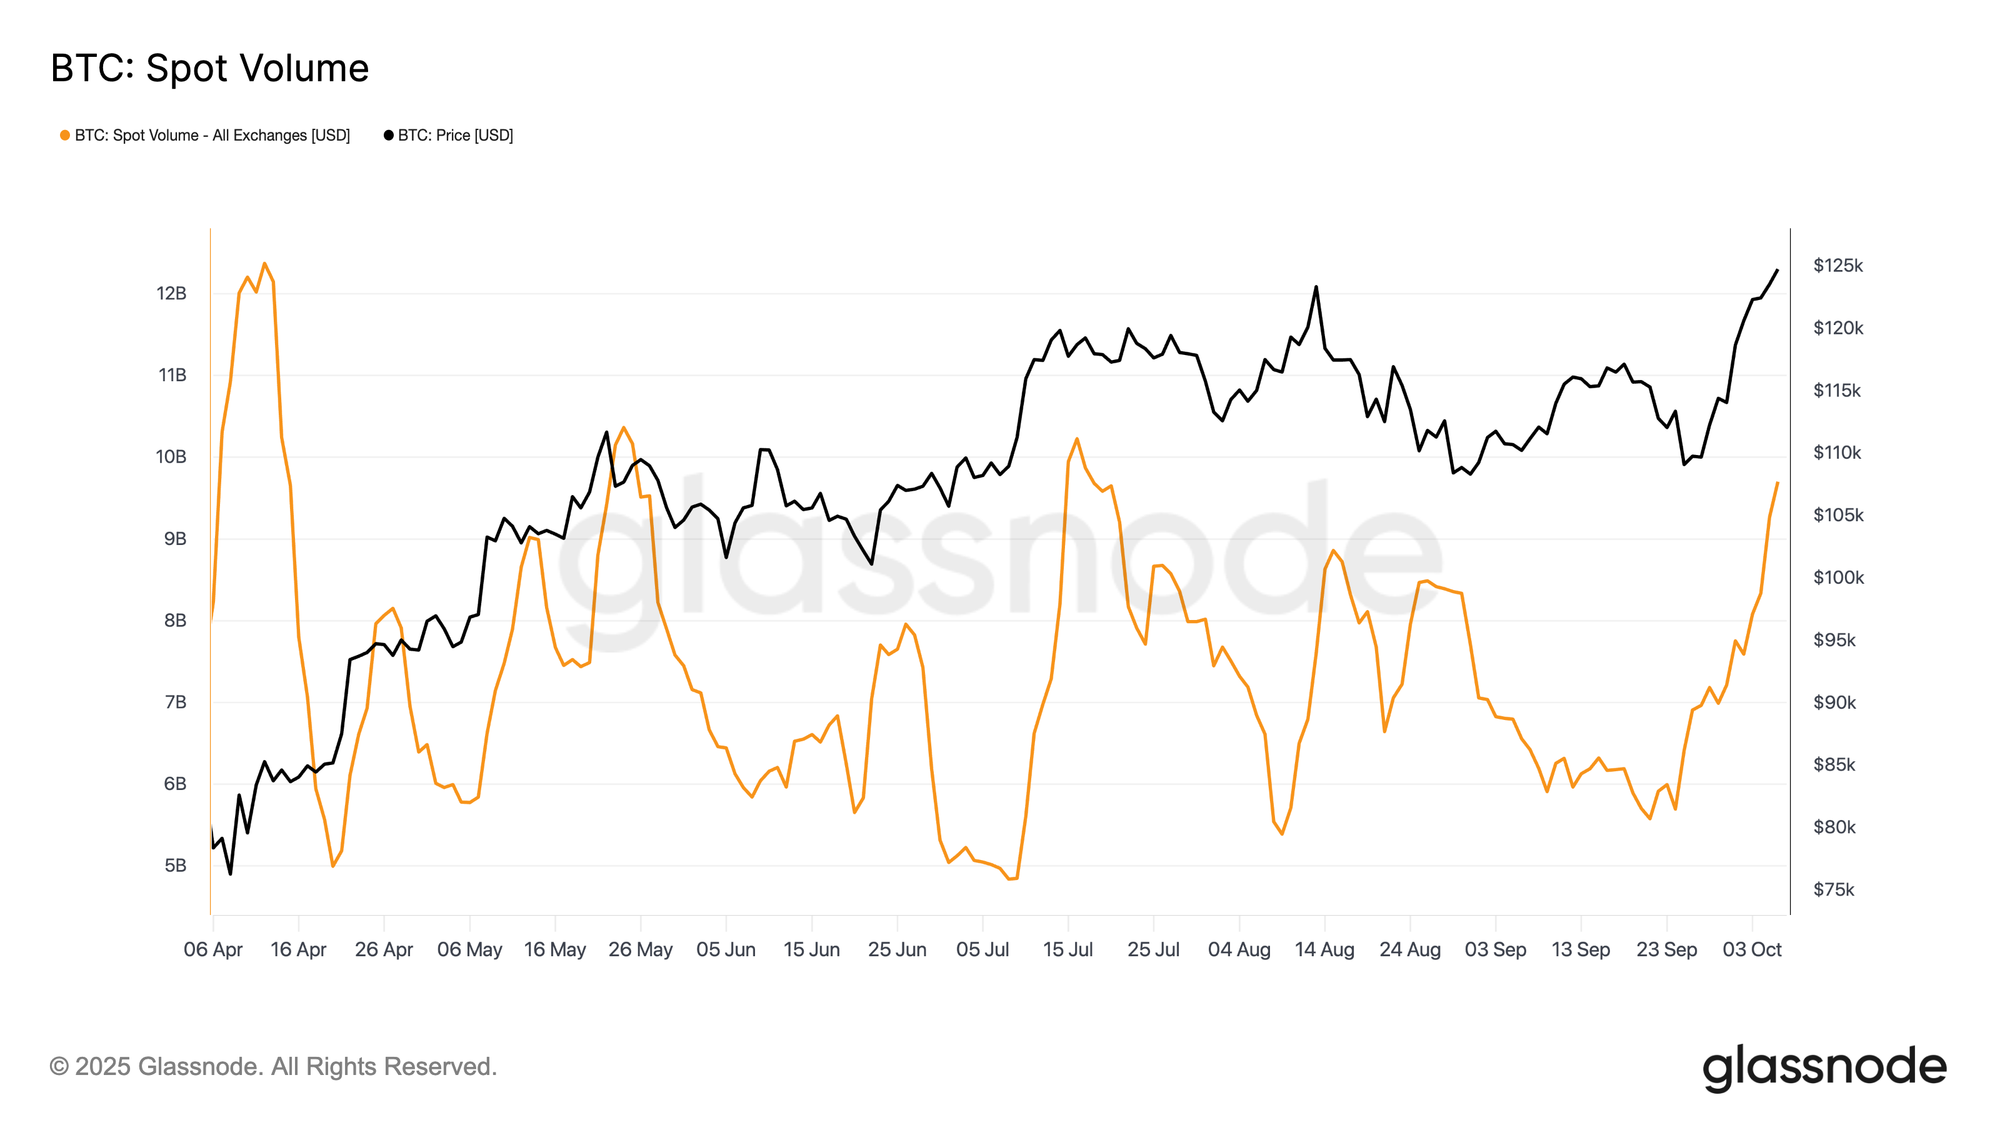
With ETF inflows reigniting demand, trading activity in the spot market has surged in tandem. Daily Spot Volume has climbed to its highest levels since April, confirming renewed market participation and deeper liquidity.
This uptick reflects growing confidence behind Bitcoin’s breakout to new highs. Sustained volume will be essential for validating the rally’s strength, as fading turnover after major advances has historically preceded short-term exhaustion and corrective phases.
Leverage Build Up
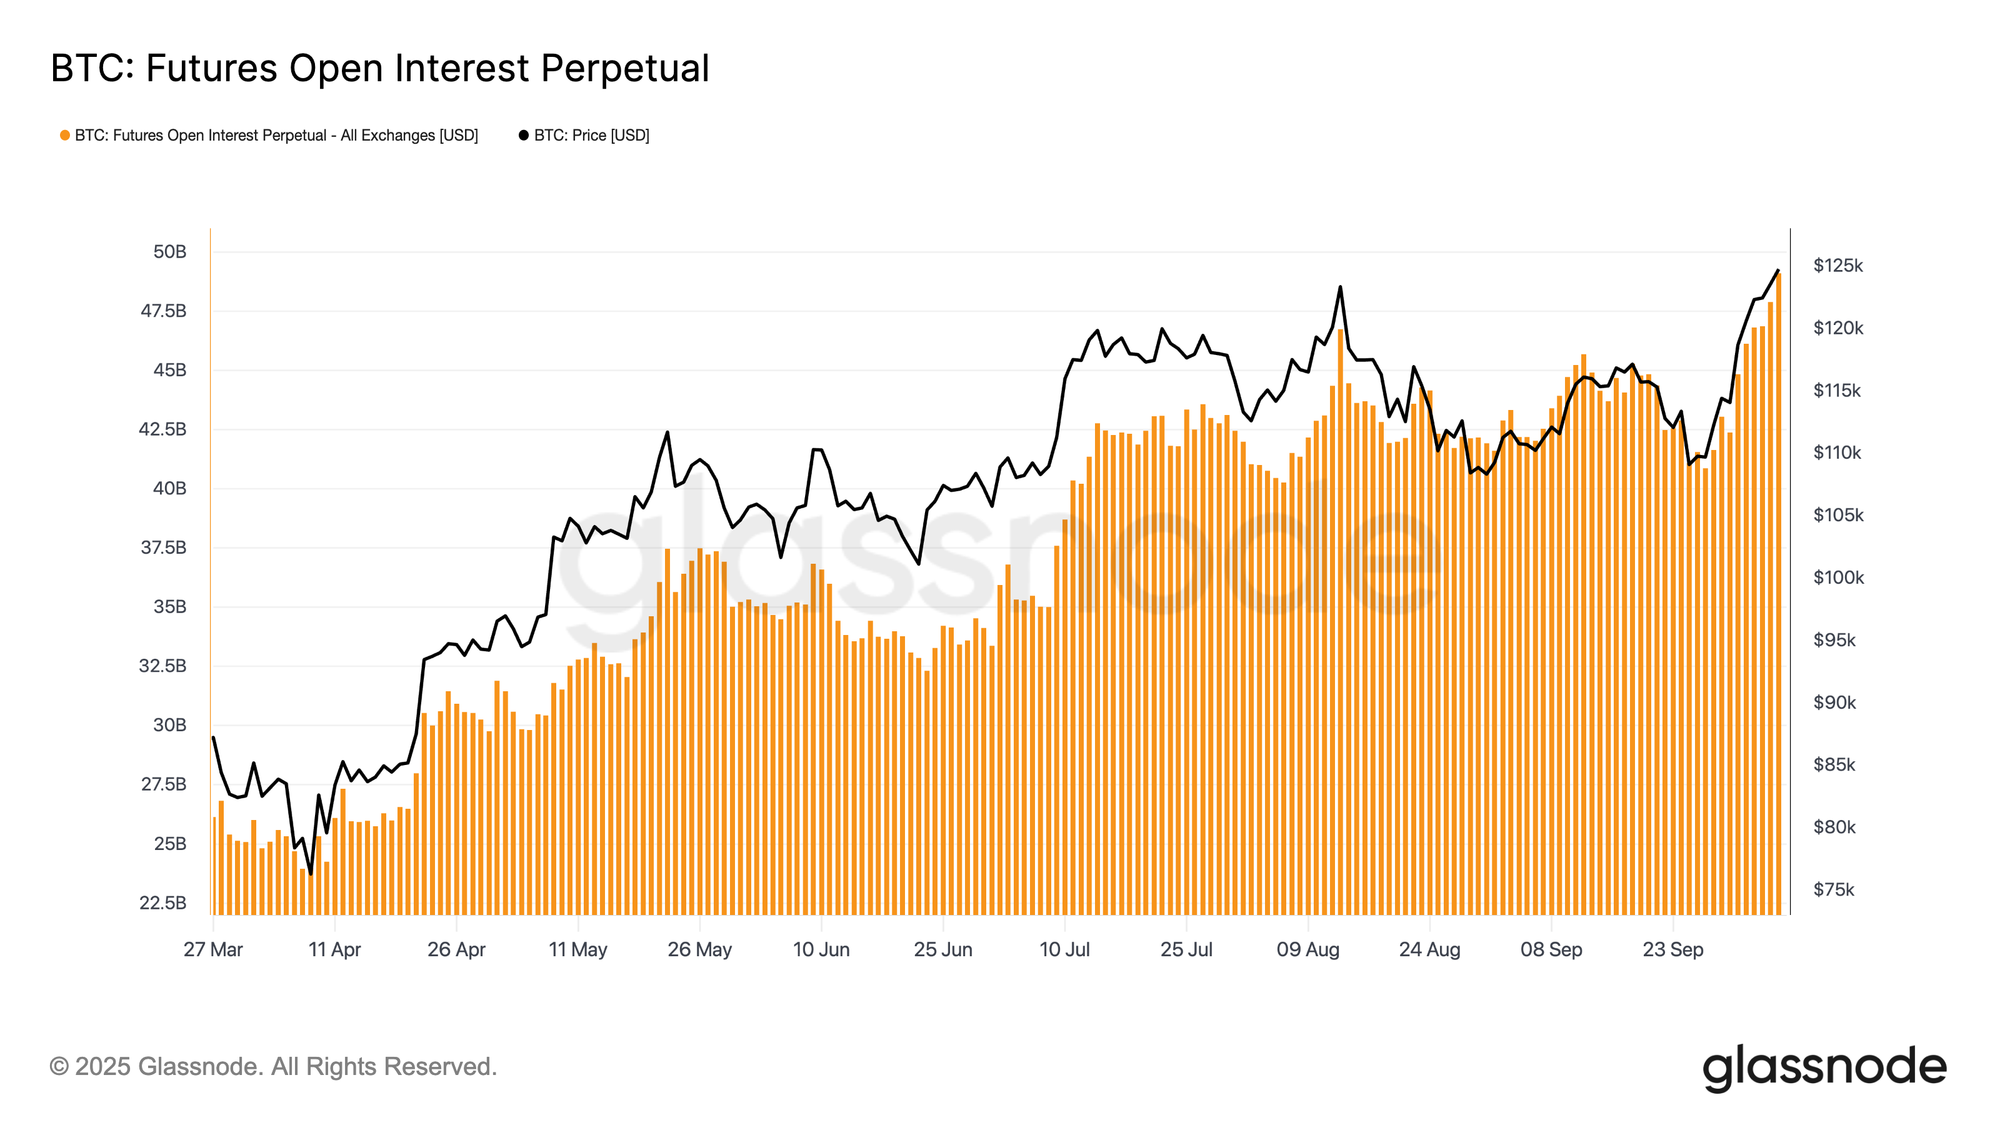
Following the surge in spot activity, the futures market has also heated up. Future Open Interest has risen sharply, setting new highs as Bitcoin broke above $120k. This expansion indicates a wave of leveraged long positions entering the market, a setup that often fuels short-term volatility. Periods of rapid OI growth typically resolve through liquidations or brief cooling phases, allowing excess leverage to unwind and positioning to reset before the next sustainable trend can form.
Funding Rates Heat Up
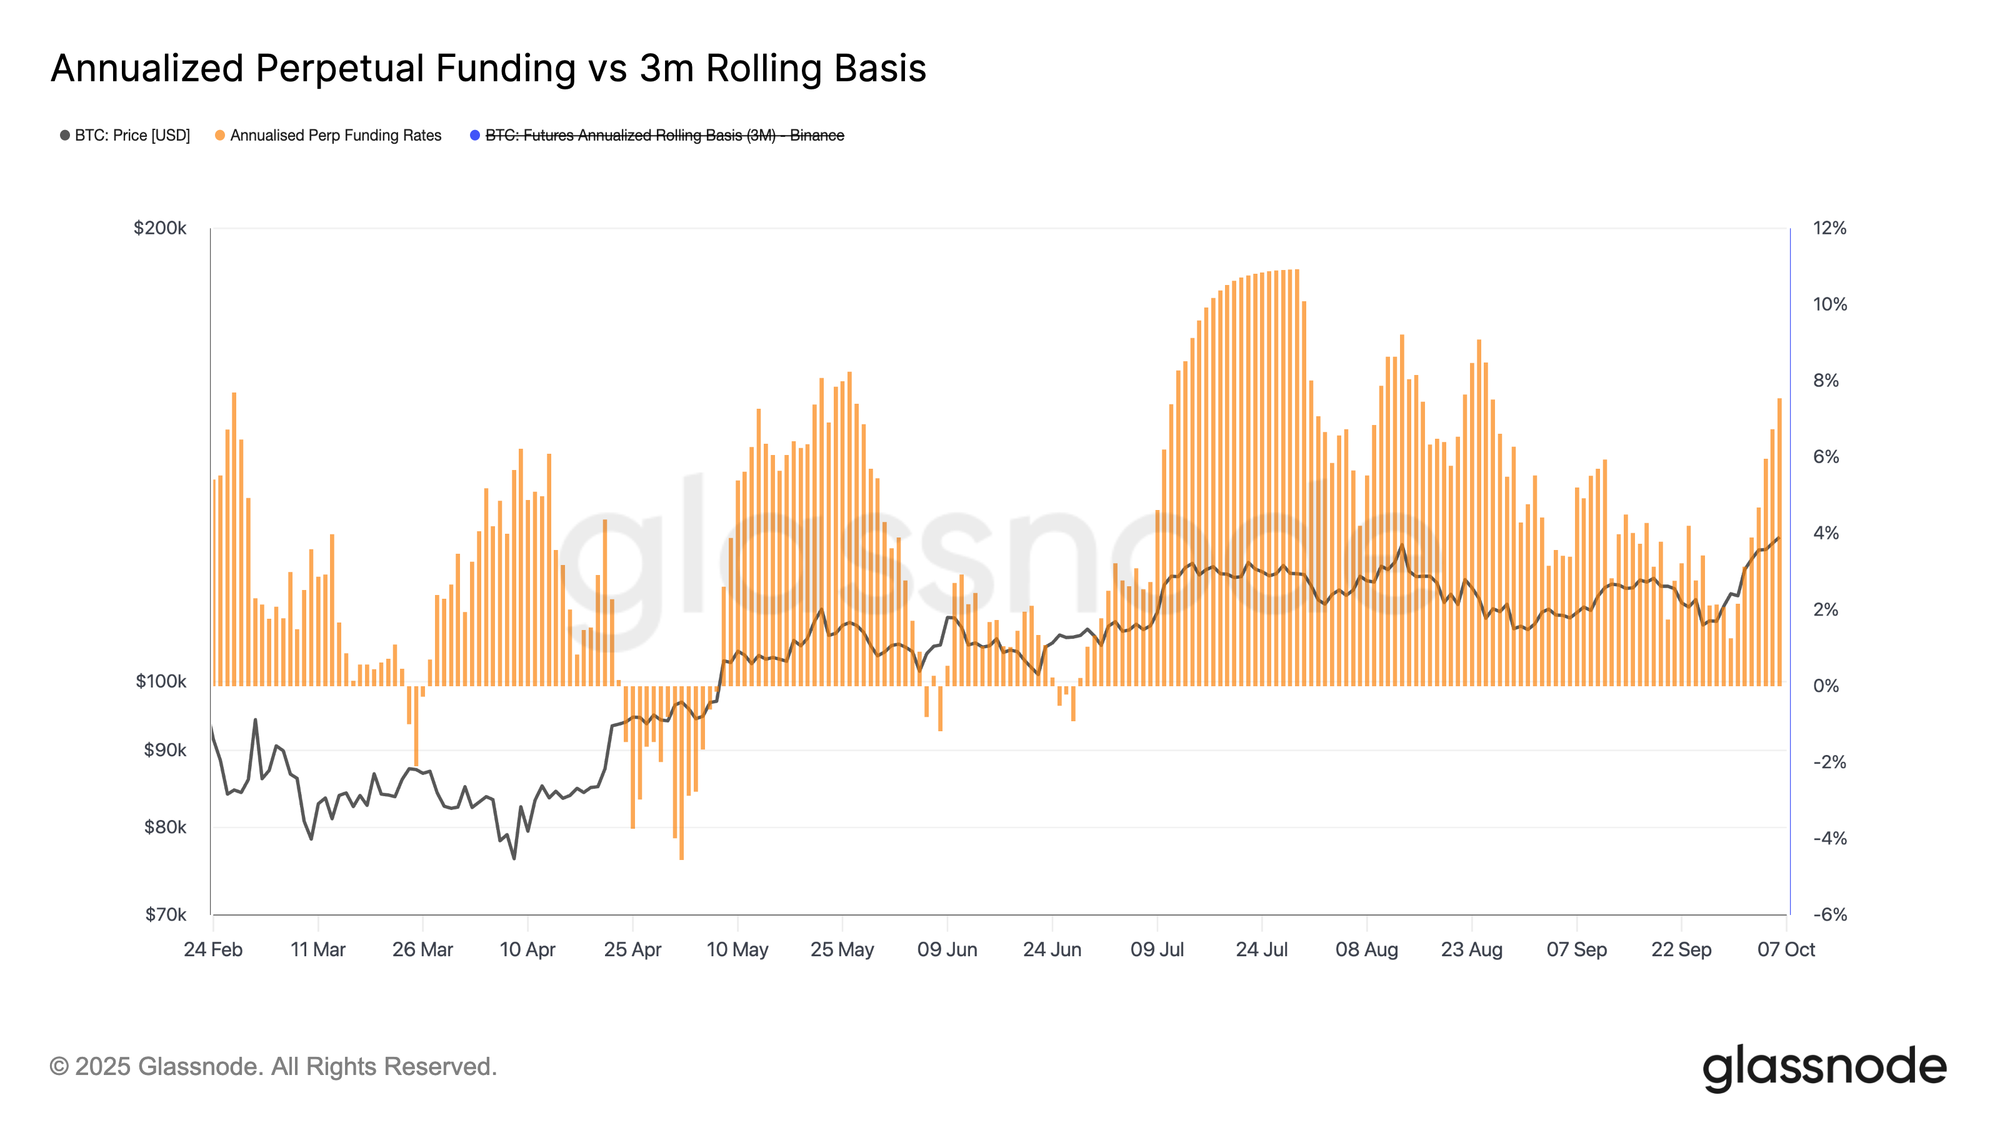
As futures open interest expands, Funding Rates have climbed in parallel with Bitcoin’s advance to new highs. Annualized funding now exceeds 8%, signalling elevated demand for leveraged long exposure and a rise in speculative activity.
Although not yet at overheated levels, sharp increases in funding often precede short-term cooling as leverage is flushed out. Historically, such phases result in brief pullbacks or profit-taking before the market can re-establish a more balanced structure.
Options Market Outlook
Uptober Bid Lifts the Curve
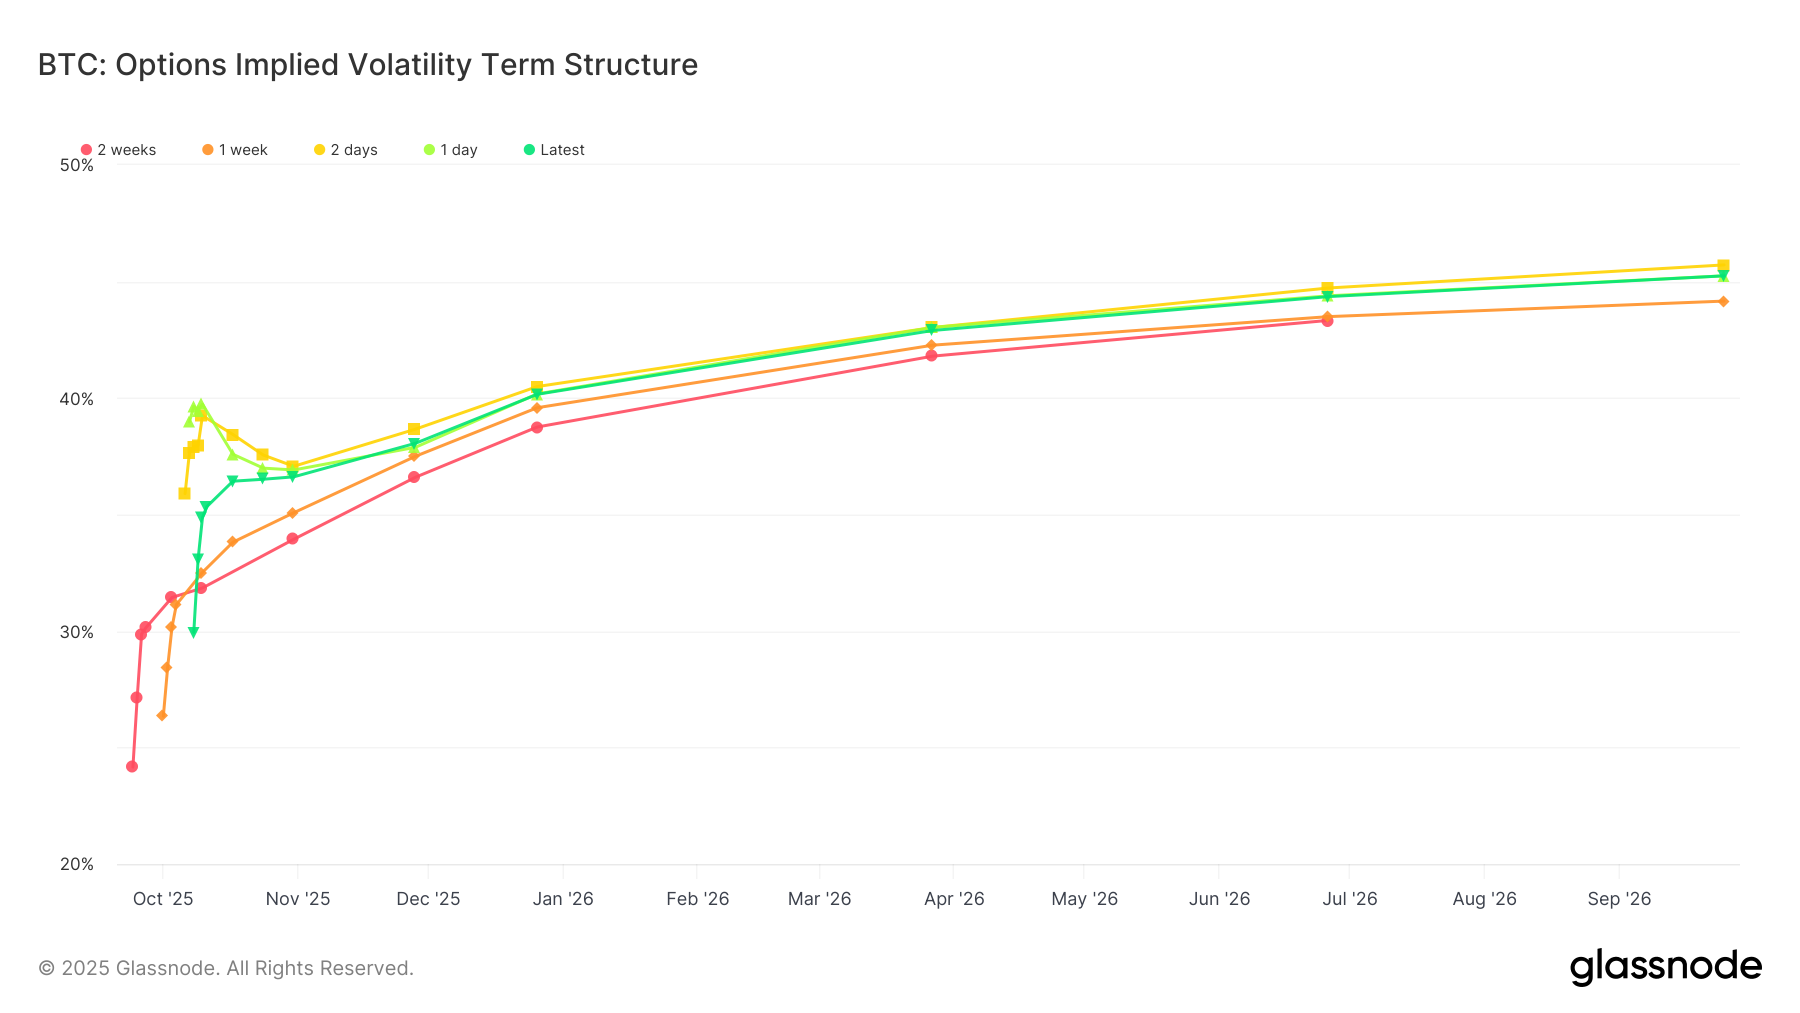
Turning to the options market, implied volatility has firmed as traders reposition into Q4. The entire Implied Volatility Term Structure has shifted higher over the past two weeks, reflecting growing optimism and renewed demand for optionality.
The October 31 expiry — a key date aligned with the “Uptober” narrative — has risen from 34 to 36 vols, while the back end has gained about one vol point. This upward shift signals not only short-term bullish sentiment but also confidence extending into 2026, suggesting longer-dated options are attracting renewed interest.
Short-Term Vol Squeeze
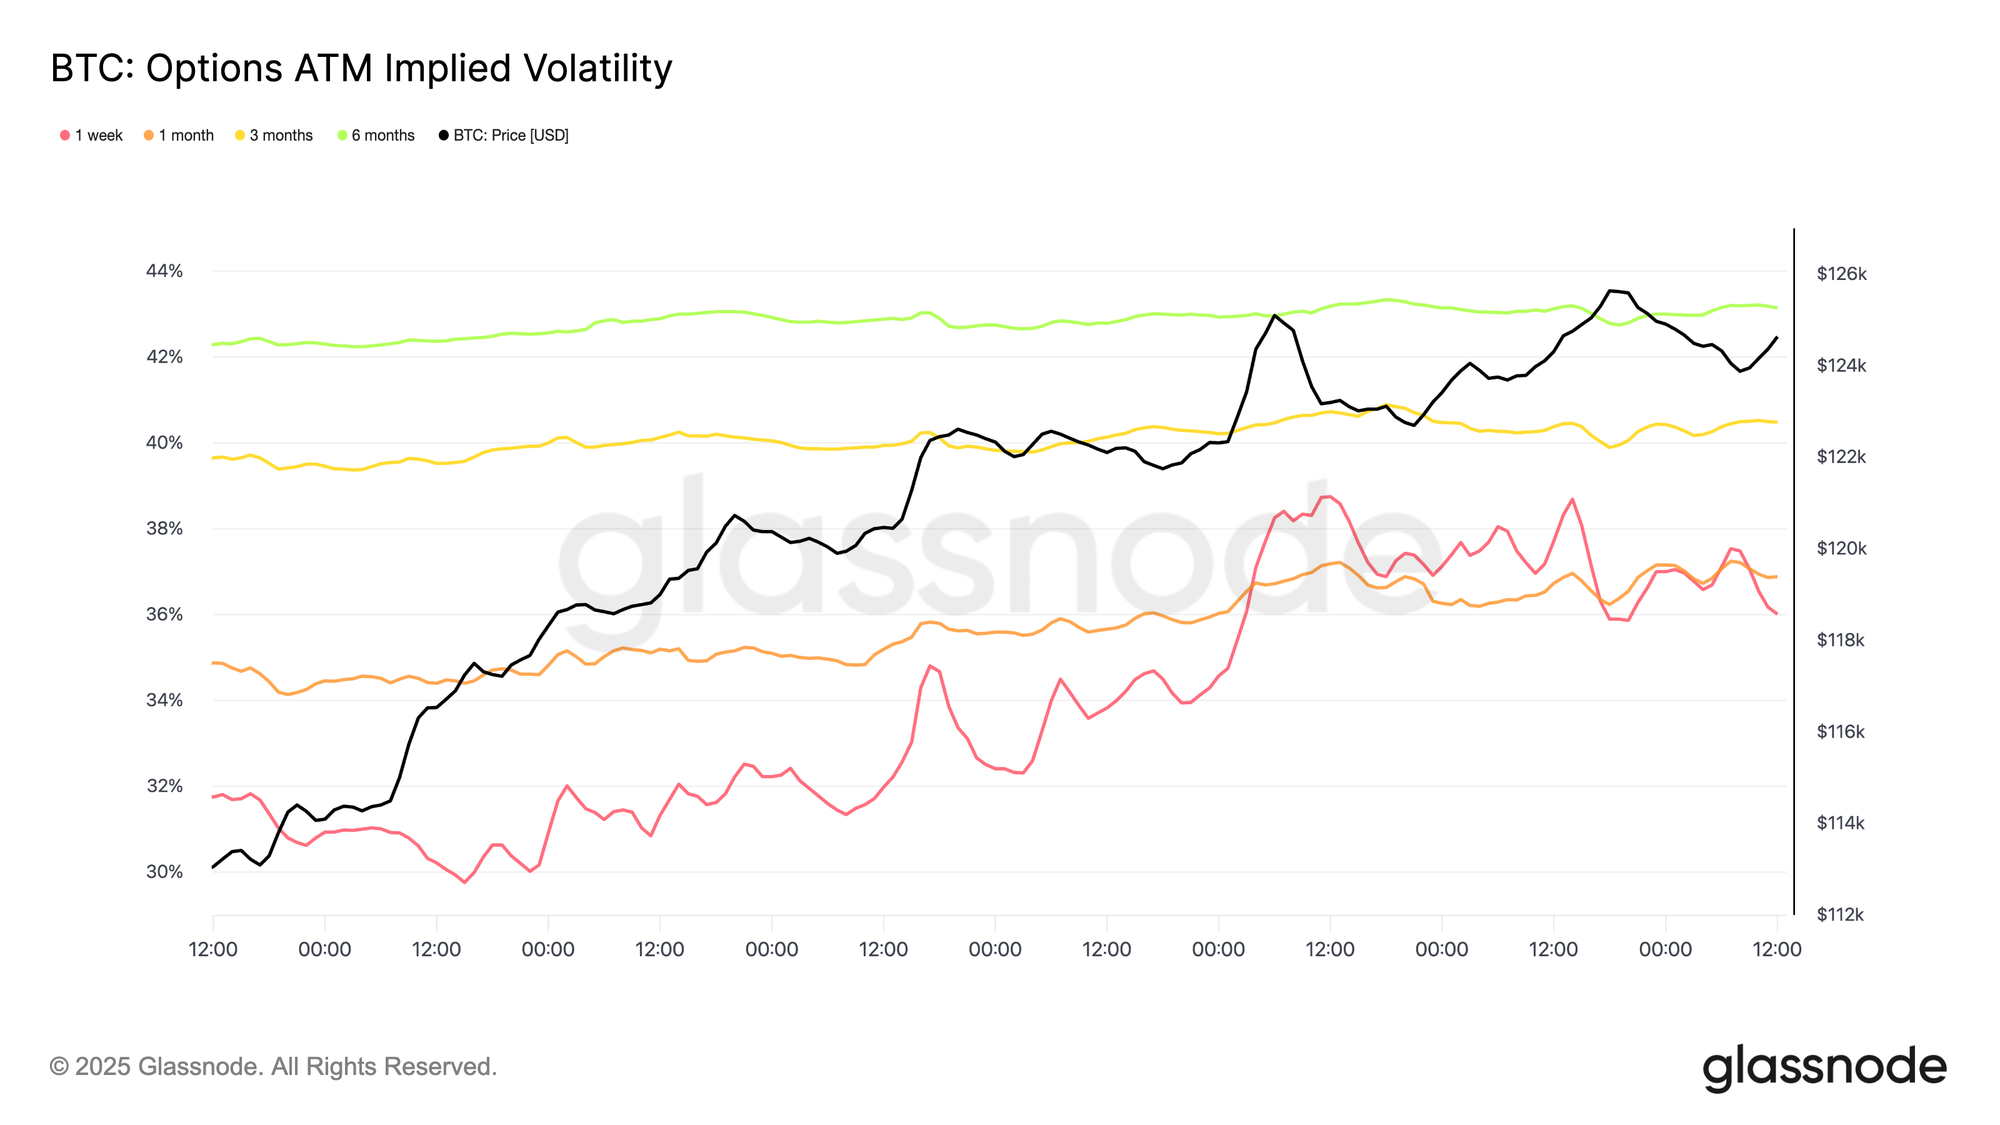
Alongside the broader lift in the term structure, At-The-Money Implied Volatility has risen across all maturities by about one volatility point. The exception is the one-week tenor, which spiked from 31.75% to 36.01%, marking a notable short-term surge.
This sharp move reflects traders adding gamma exposure while short-vol sellers were forced to cover and roll positions to higher strikes and longer expiries. The result was a classic volatility squeeze concentrated in near-term contracts, highlighting renewed sensitivity to short-dated price movements and elevated demand for tactical hedging.
A Sharp Sentiment Reversal
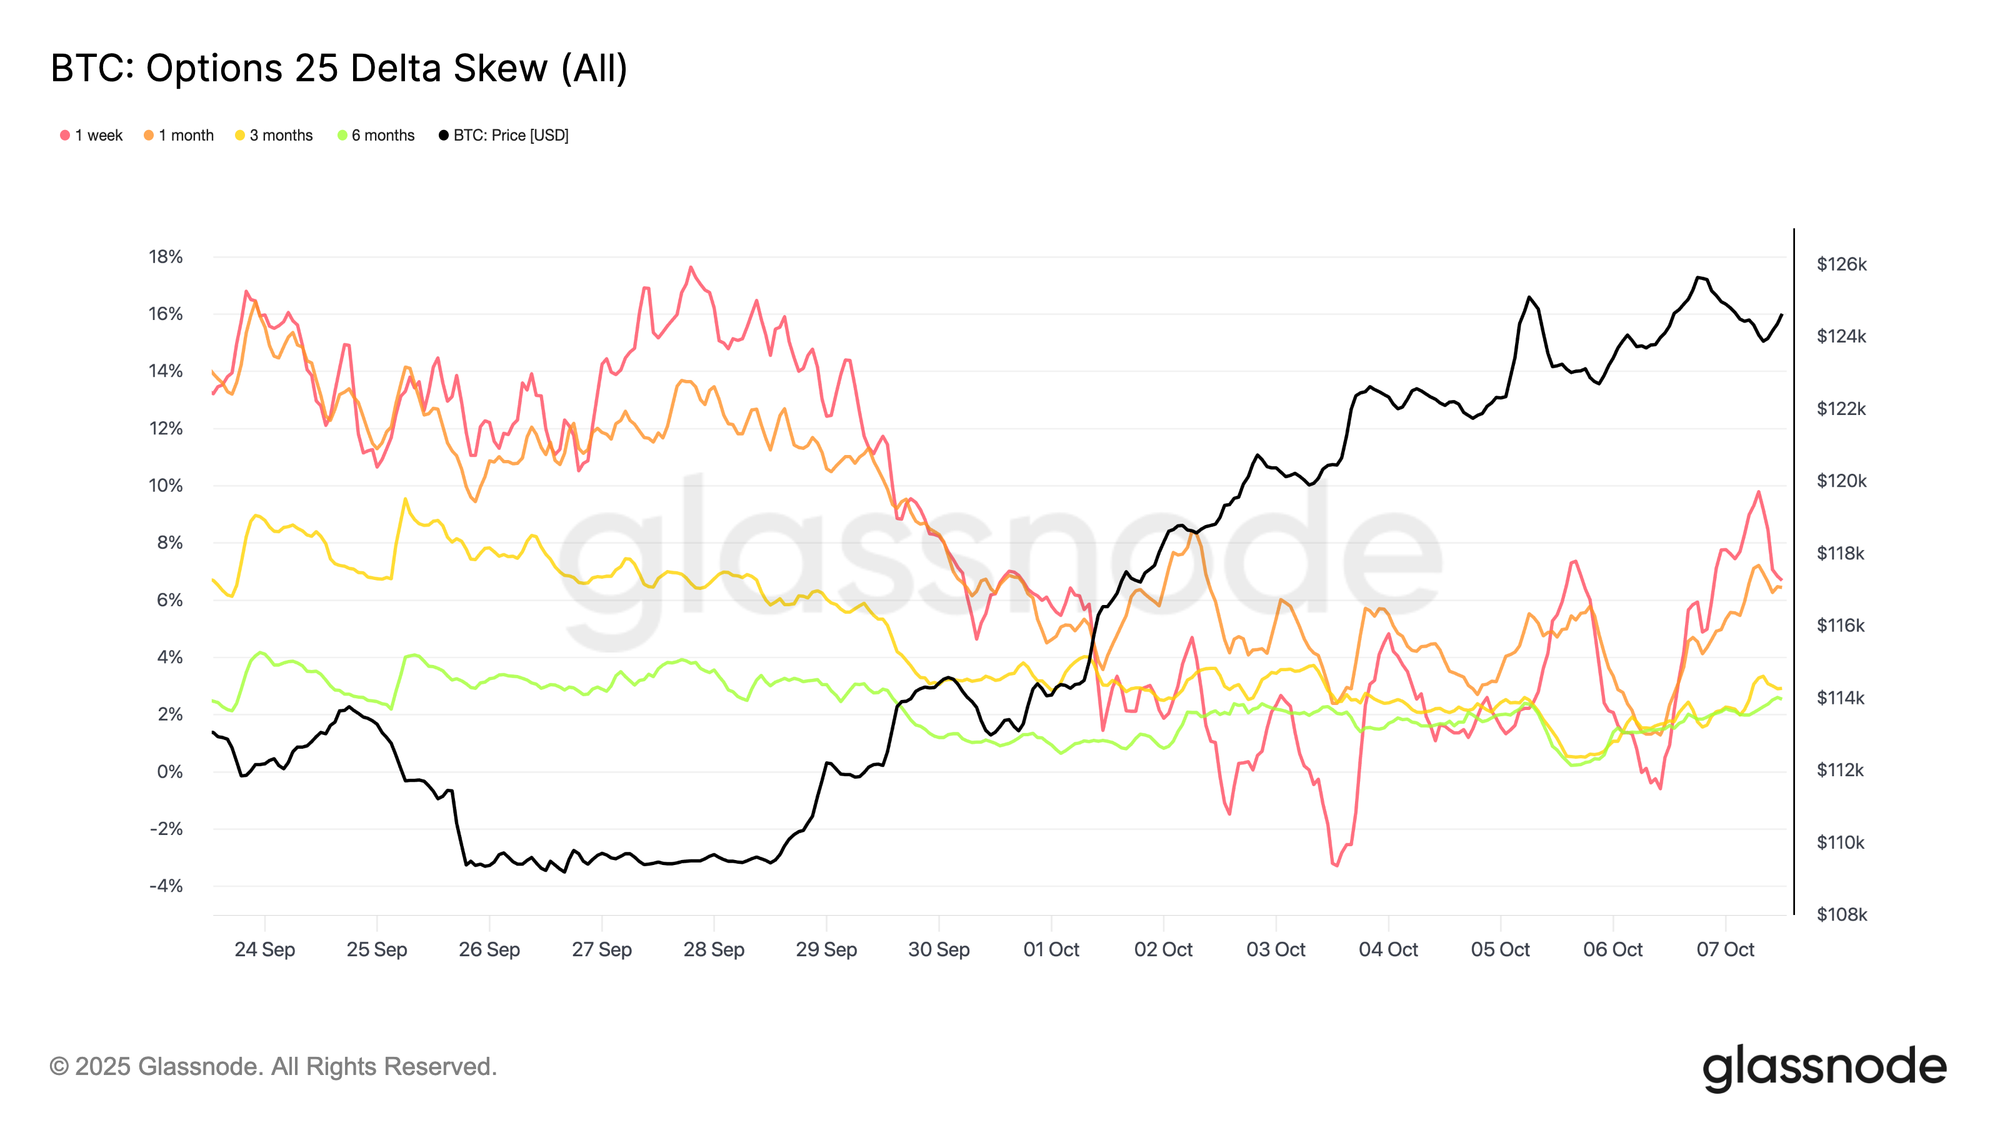
The past two weeks have brought a pronounced shift in options sentiment, as evident in the rapid adjustment in skew. What began as a deeply bearish structure turned nearly neutral by Monday, before renewed hedge demand modestly tilted the balance back toward puts.
The near-term 25-Delta Skew narrowed from roughly 18 vol points put-rich to just 3 vol points by Friday, a remarkable 21-point swing in under a week. As noted previously, such extreme skews often precede reversals, and this time was no exception. Traders responded by bidding calls relative to puts, seeking upside exposure as Bitcoin’s breakout gained momentum, marking a clear rotation from defensive hedging to opportunistic positioning.
Flows Set the Stage for Volatility
Recent options flow data reveal an active tug-of-war near current price levels. Call activity dominates, yet both buyers and sellers are engaging at scale, reflecting a mix of strategies. Some participants are pursuing upside convexity through call spreads and ratios to manage costs, while others are writing covered calls to monetize volatility and cap gains on spot exposure.
Dealers remain largely long gamma around these strikes, particularly into the month-end expiry, positioning for elevated volatility. This structure suggests potential two-way pressure: long gamma traders may fade rallies to secure profits, while short gamma players could be forced to chase and hedge as prices extend. The result is a setup ripe for amplified swings as the market navigates uncharted territory
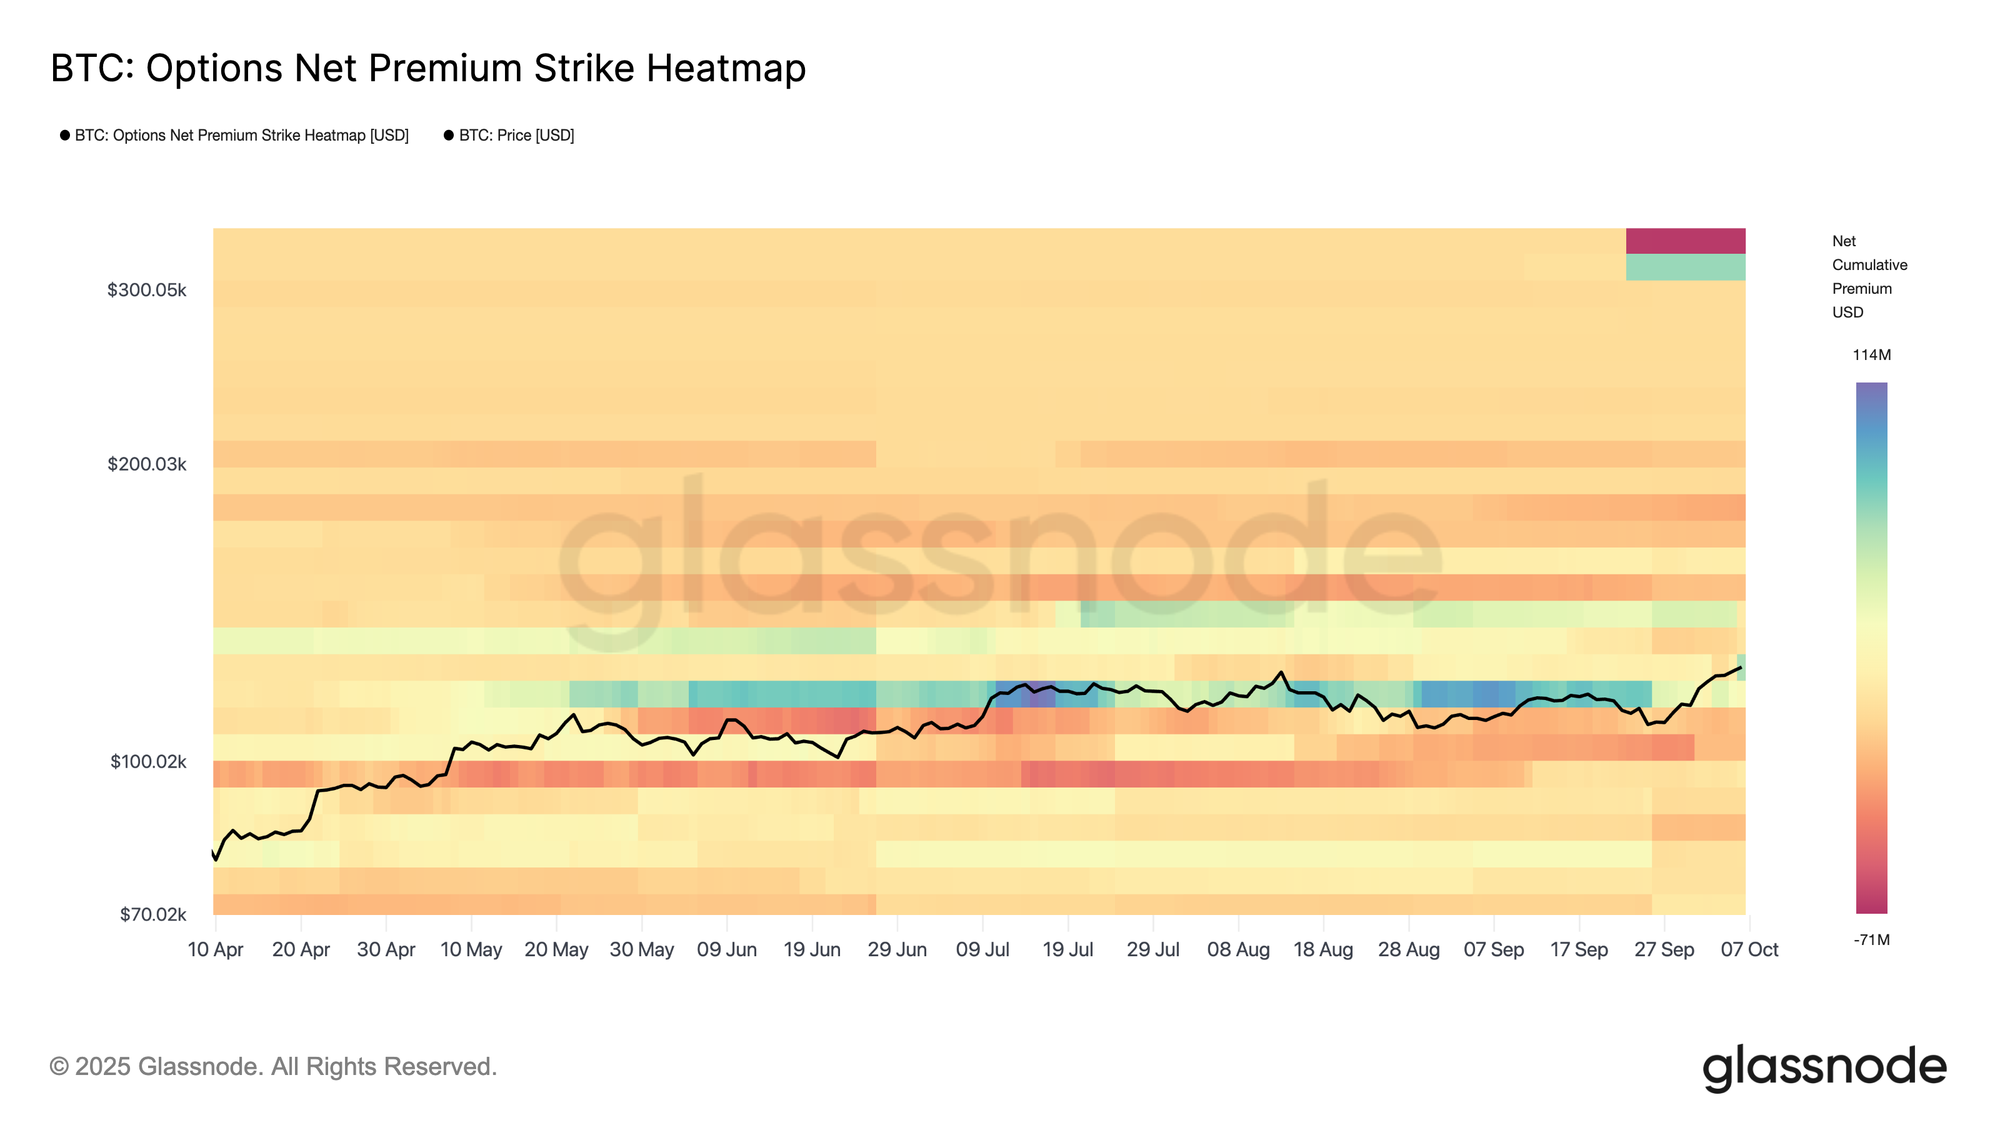
All in all, the options landscape reflects a more balanced yet increasingly active market. With skew now near neutral and implied volatility elevated, positioning for upside is no longer as inexpensive as it was a week ago. Many traders have already secured bullish exposure, driving call premiums higher and compressing risk-reward on fresh long-vol trades. While momentum remains strong and sentiment remains constructive, positioning has become more crowded, suggesting that near-term volatility could remain elevated as markets digest this renewed optimism.
Conclusion
Bitcoin’s breakout above the $114k–$117k supply cluster and new all-time high near $126k highlights renewed market strength supported by mid-tier accumulation and easing whale distribution. On-chain data point to key support between $117k and $120k, where nearly 190k BTC last changed hands, a zone likely to attract dip buyers if momentum cools.
In the spot and futures markets, ETF inflows exceeding $2.2B and surging volumes confirm strong institutional demand, although rising leverage and funding rates above 8% introduce short-term fragility.
Meanwhile, options markets show higher implied volatility, neutral skew, and call-heavy positioning, signalling constructive sentiment but a more crowded landscape.
Together, these signals outline a robust yet maturing uptrend, one that remains supported but increasingly sensitive to profit-taking and leverage resets as Bitcoin navigates price discovery.