Bitcoin Eyes $97,000-$99,000 As Key Support Zone If Price Decline Persists – Analyst

bitcoinistPublié le 2025-06-01Dernière mise à jour le 2025-06-02

Résumé

Bitcoin prices fell by over 3% in the past week as the broader crypto market suffers from a general price...

Trusted Editorial content, reviewed by leading industry experts and seasoned editors. Ad Disclosure

Bitcoin prices fell by over 3% in the past week as the broader crypto market suffers from a general price correction influenced by macroeconomic pressure. Notably, the premier cryptocurrency now trades above $104,000 representing an estimated 7% decline from its new all-time high at $111,970. Amidst what may yet be a mere correction, market analyst Daan Crypto has highlighted a support zone with strong potentials to halt any further price decline. 

$97,000-$99,000 Emerges As Key BTC Price Level

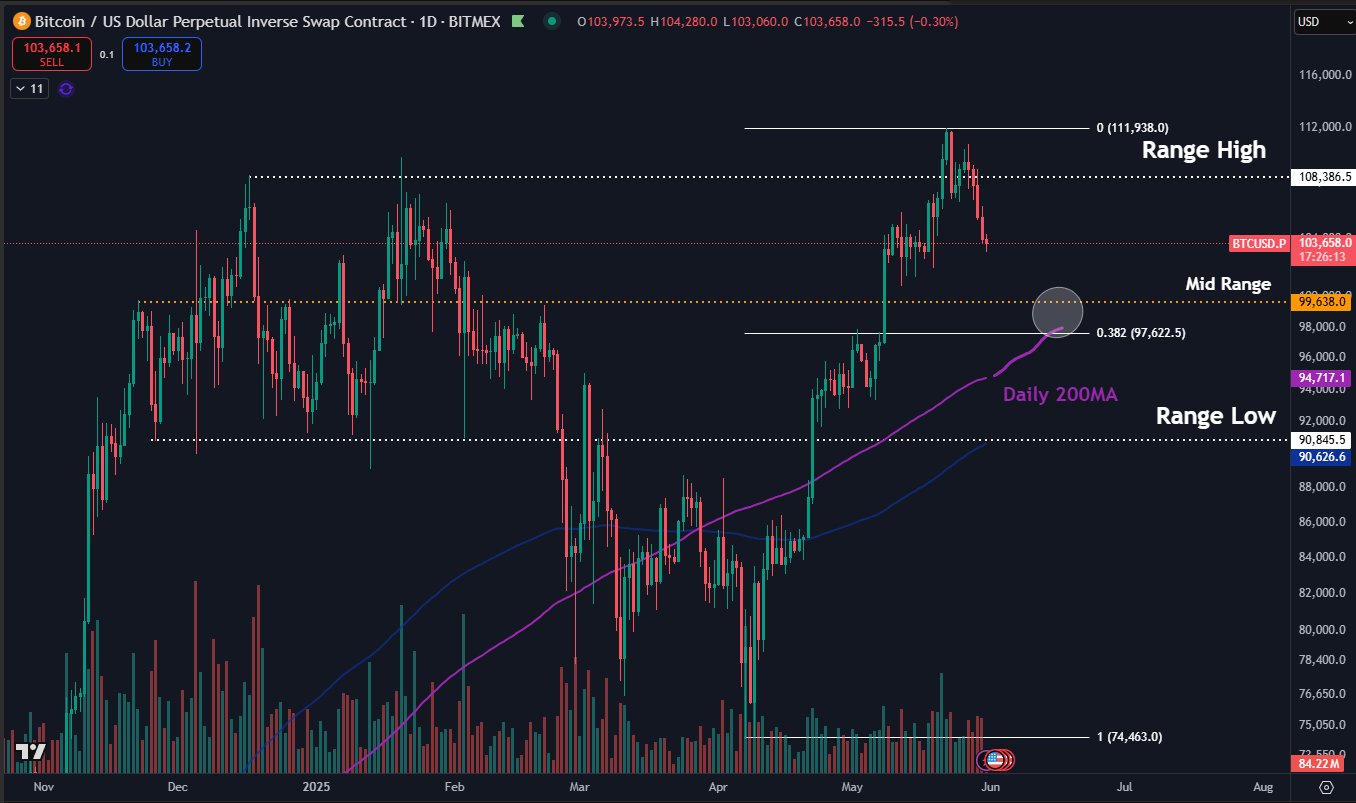
In a brief X post on May 31, Daan Crypto has shared a cautious outlook on Bitcoin amidst an ongoing price correction. The analyst notes that if the retracement persists into June, Bitcoin is likely to fall to around $97,000 -$99,000 at which it may find a credible market resistance.

Daan Crypto’s selection of this price range as the next major support level for Bitcoin stems from a confluence of technical indicators. As seen in the chart below, the $97,000-$99,000 price region represents the mid range of Bitcoin trading channel between $90,845 and $108,386, alongside hosting the 200-day moving average and the 0.382 Fibonacci retracement level.
Bitcoin
Source: @DaanCrypto on X

The mid-range in a trading channel usually serves as a key level of support or resistance, depending on where the price is relative to it. Amidst Bitcoin’s price correction, the current mid-range at $97,000-$99,000 represents the next major price floor for the premier cryptocurrency — a decisive price fall below which would signal a bearish price trend.

Meanwhile, the 0.382 Fibonacci retracement level represents a healthy market correction zone meaning prices generally pull back to this area before resuming the initial trend. In addition, the 200 day MA is a long-term indicator averaging the market closing price over the past 200 days. It also functions as a support level during bullish trends acting as a common retest level before price continues an uptrend.

Generally, all three indicators suggest the $97,000-$99,000 would act as a sound technical support zone should Bitcoin price dip any further. However, the loss of the support zone would threaten Bitcoin’s bullish potential with the next support level set around $94,000.

Bitcoin Price Overview

At press time, Bitcoin trades at $104,650 reflecting a slight price gain of 0.14% in the past day. The premier cryptocurrency also reports a monthly gain of 7.21% indicating that the majority of new market entrants remain in profits. However, the weekly decline of 2.86% suggests there is need for a resurgence in market demand to halt a creeping bearish sentiment investment.

Bitcoin
BTC trading at $104,632 on the daily chart | Source: BTCUSDT chart on Tradingview.com
Featured image from Pexels, chart from Tradingview
Editorial Process for bitcoinist is centered on delivering thoroughly researched, accurate, and unbiased content. We uphold strict sourcing standards, and each page undergoes diligent review by our team of top technology experts and seasoned editors. This process ensures the integrity, relevance, and value of our content for our readers.

Semilore Faleti works as a crypto-journalist at Bitconist, providing the latest updates on blockchain developments, crypto regulations, and the DeFi ecosystem. He is a strong crypto enthusiast passionate about covering the growing footprint of blockchain technology in the financial world.

Lectures associées

Après le départ d'Aave et la forte volatilité du TVL, sur quoi se fonde l'évaluation de MegaETH ?

Selon les dernières données de DefiLlama, le TVL total de MegaETH a connu une volatilité extrême les 9 et 10 juillet, chutant à un peu plus de 30 millions de dollars, soit une baisse de près de 60% en 24 heures. Par rapport au pic de mai, il a fondu d'environ 70%. Le protocole majeur Aave V3 a retiré environ 80% de sa liquidité dans la journée. Le prix du jeton MEGA est tombé à environ 0,048 dollar, avec une capitalisation boursière d'environ 54 millions de dollars et une valorisation entièrement diluée (FDV) d'environ 4,8 milliards de dollars. Autrefois l'une des nouvelles blockchains les plus attendues, MegaETH a vu sa valorisation atteindre environ 20 milliards de dollars lors de son pic, soutenue par une importante communauté et des investisseurs VC. Cependant, son TVL était fortement dépendant d'Aave (environ 90% à son apogée) et de stratégies de levier circulaire impliquant des stablecoins comme USDe. Ce TVL, largement motivé par des incitations et de l'arbitrage, s'est révélé très volatil. L'article souligne un décalage important entre la valorisation et les fondamentaux : avec un FDV d'environ 4,7 milliards de dollars, la blockchain ne génère que moins de 90 000 dollars de revenus mensuels réels et ne compte qu'environ 2600 adresses actives quotidiennes. De plus, la majorité des revenus provient désormais d'une application de jeu (Monster), et non des protocoles DeFi comme Aave. La communication de l'équipe et le développement de l'écosystème sont également remis en question par la communauté. En conclusion, après le retrait des capitaux spéculatifs, MegaETH manque d'un ancrage de valeur solide basé sur une utilisation réelle et une croissance organique de son écosystème. Tant que ces fondamentaux ne se matérialiseront pas, toute reprise pourrait n'être que temporaire, dictée par les sentiments du marché.

链捕手Il y a 6 h

Après le départ d'Aave et la forte volatilité du TVL, sur quoi se fonde l'évaluation de MegaETH ?

链捕手Il y a 6 h

Trading

Spot
活动图片