Once the 3rd largest stablecoin, TerraUSD (UST) has shaken the entire stablecoin market after it collapsed on May 9. Instead of finally figuring out a solution to algorithmic stables like thousands of people thought, it went to zero nearly overnight.
UST failed due to a sudden and massive sell-off as it depegged, causing an excessive amount of Terra (LUNA) to be minted. Despite its rapidly expanding supply, LUNA failed to re-anchor UST to $1 as its value plummeted.
UST’s market cap surpassed Binance USD (BUSD) in April, meaning it trailed only behind Tether (USDT) and USD Coin (USDC). Nevertheless, the collapse came so quickly that it was too late for many investors to even cash out at a loss.
The event has created the largest crisis of trust in DeFi. Stablecoins are no longer stable.
But crises bring their own opportunity. How has the stablecoin market changed after UST?
People are nervous about Tether and warming to USD Coin
USDT and USDC account for almost 80% of the total stablecoin market.
For each USDT issued, Tether’s bank account is deposited with USD funding on a 1:1 basis. USDC is similar to USDT and is issued by Circle.
USDT is by far the more controversial project out of the two. In Oct. 2021, it garnered significant press coverage for its alleged lack of transparency and repeated penalties from US regulators for lying to the public.
When UST crashed, people immediately thought of USDT, and its market cap dropped by more than $10 billion to $72.5 billion over the course of half month.
Curve’s 3pool, its largest pool (made up of DAI, USDC, and USDT) reflects the market sentiment around these main stables.
USDT had previously remained at 20-30% of the pool. However, as Terra Luna collapsed, users began throwing their USDT into the pool and swapping for USDC and DAI. This frantic sell-off led to USDT peaking at 83%.
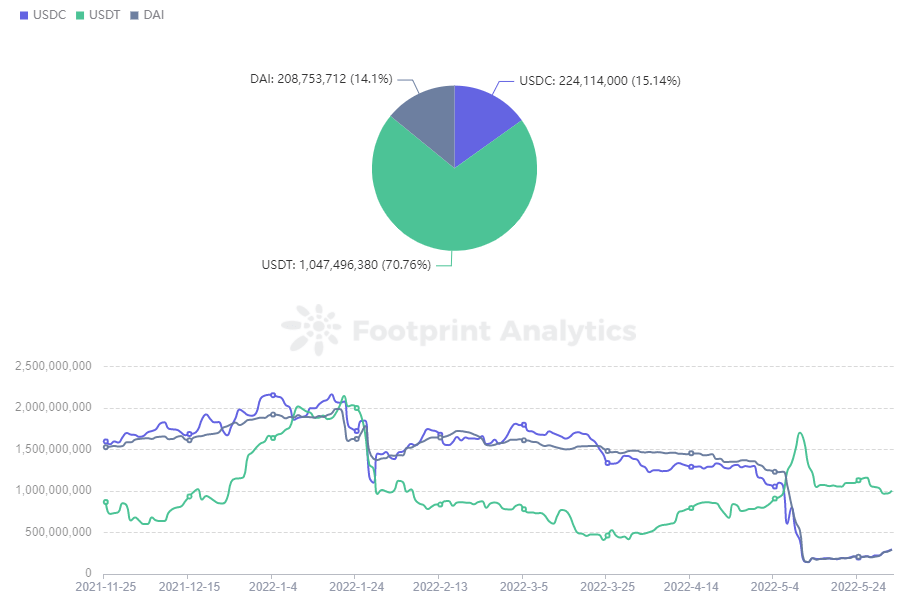
Footprint Analytics – Curve 3pool in Ethereum
Before the collapse, USDT’s price tended to hover above $1, but the event brought it to a near three-month low of $0.996. Paolo Ardoino, Tether’s CTO, announced on Twitter that they redeemed $7 billion to help it regain its dollar anchor, and was confident that he could continue doing so if the market wanted.
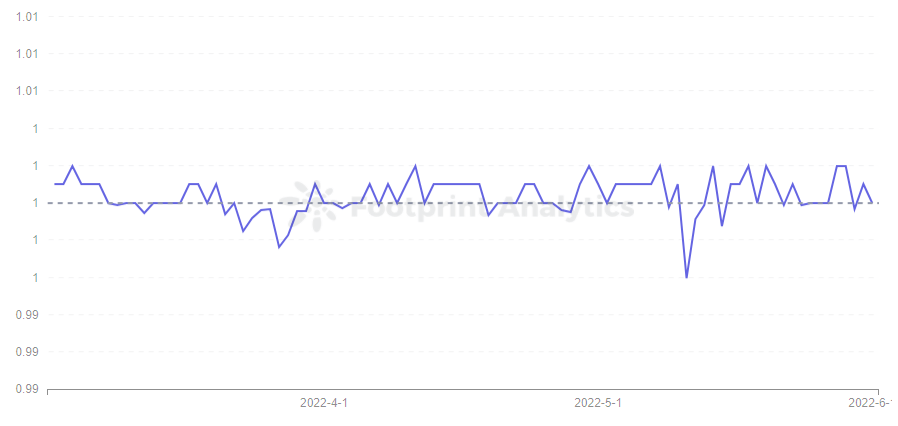
Footprint Analytics – USDT Price Trend
The move has restored some confidence and USDT’s percentage of the 3pool dropped to 61% on June 5.
USDT’s market cap dropped by $10 billion, but its share of the total stablecoin market has not declined.
This leads to the question of where UST’s share of the market fled to.
According to Footprint Analytics, USDC has been the biggest beneficiary, with its market cap rising from $48.3 billion to $54.1 billion and its market share from 27% to 34%.
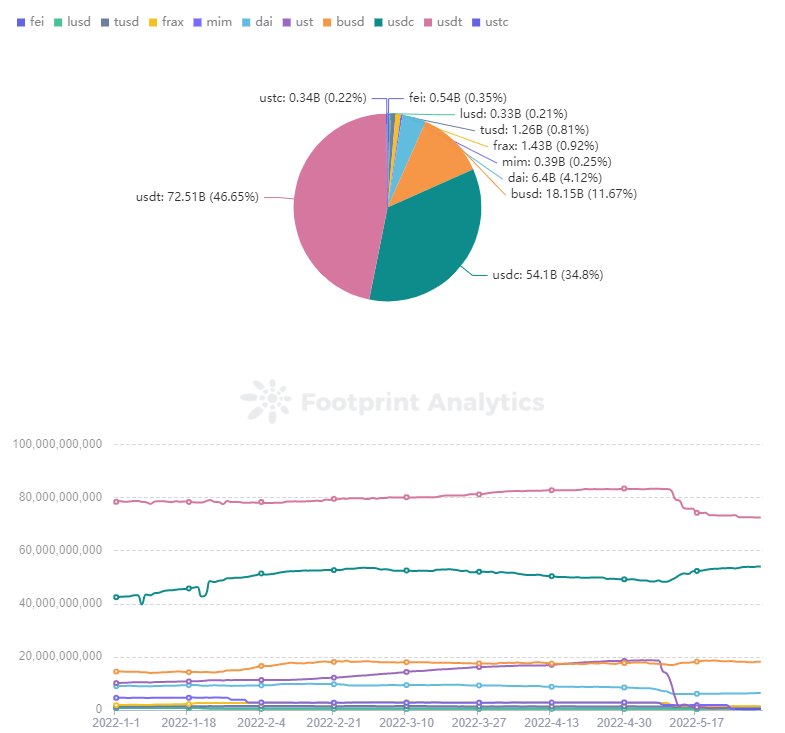
Footprint Analytics – Market Cap of Stablecoin
DAI finds its footing while Magic Internet Money stumbles
Overcollateralized stablecoins, led by Dai (DAI), Magic Internet Money (MIM), and Liquity (LUSD) are minted by depositing non-stablecoins in excess of the 1:1 ratio into the protocol as collateral.
These overcollateralized coins were affected by UST’s drop, but indirectly. The respective market cap of DAI and MIM dropped by $2 billion, but this downward trend began on May 6, before the UST crash.
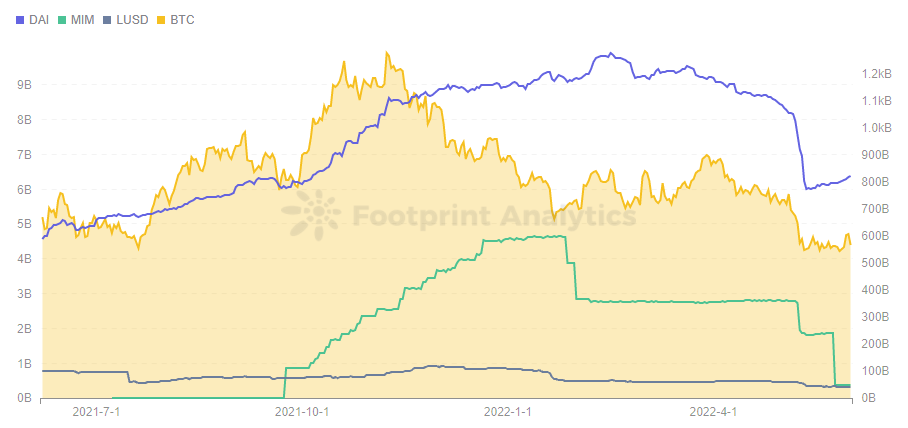
Footprint Analytics – Overcollateralized Stablecoin vs BTC Market Cap
DAI is mostly collateralized by Bitcoin (BTC) and Ethereum (ETH), while MIM is collateralized by interest-bearing assets like yvDAI. When most cryptocurrency prices fall rapidly, the overcollateralized stablecoins they use as collateral also decline.
The recent drop in BTC, which has been affecting the price of cryptocurrencies, is again related to the US market. The Federal Reserve has taken measures to raise interest rates in order to prevent inflation, which has caused a drop in US stocks as well. A clear downward trend can also be seen in the Nasdaq 100 Index.
The data at Footprint Analytics shows that the price of BTC was largely uncorrelated with the Nasdaq 100 Index until July 2021, but the correlation between the two has grown stronger since then. While users once entered cryptocurrency in part to hedge their risk, crypto now seems like a highly leveraged version of the stock market.
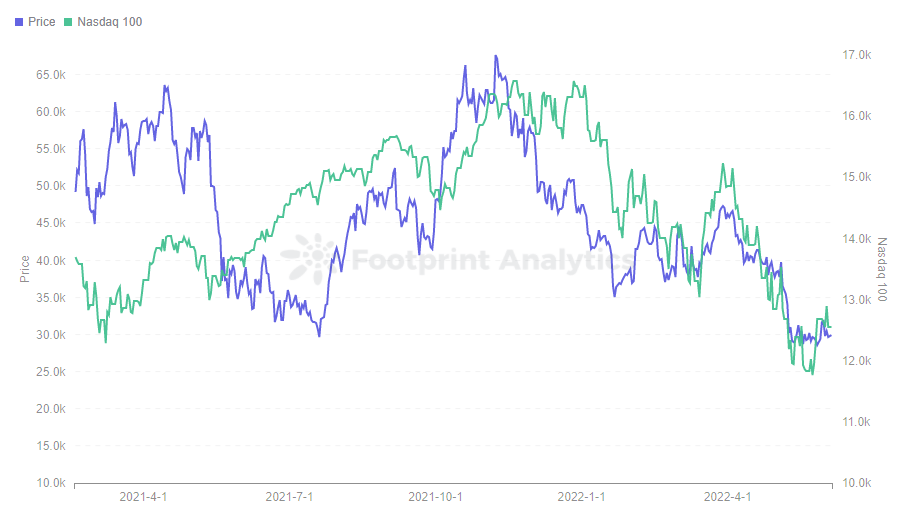
Footprint Analytics – BTC Token Price vs Nasdaq 100
The UST plunge has certainly delivered another blow to overcollateralized stablecoins, as Terra founder Do Know bought a large amount of BTC as margin for the UST, putting further downward pressure on the market and causing more people to sell BTC in fear. The failure of Do Know’s plan to rescue UST also sent the price of BTC to a near 1-year low, further affecting the liquidation of the overcollateralized stablecoins.
However, DAI is minted not only through collateral such as ETH and BTC, but also through a large number of stablecoin issues such as USDC and USDP. Therefore, DAI managed to control the impact within a limited range. In contrast, the situation of MIM is not too good, after the market cap dropped by $2 billion in January, it dropped by another $2 billion in May.
Algorithmic Stablecoin Market
The de-anchoring of UST shattered the newly built confidence in the algorithmic stablecoins, and the price of USDN, which has a similar mechanism on the Waves chain, also de-anchored instantly to $0.8 on May 11, before gradually pulling back.
However, as of June 5, the price was still not completely anchored at $0.989. As seen by Footprint Analytics, this is not the first time USDN has been so badly unanchored.
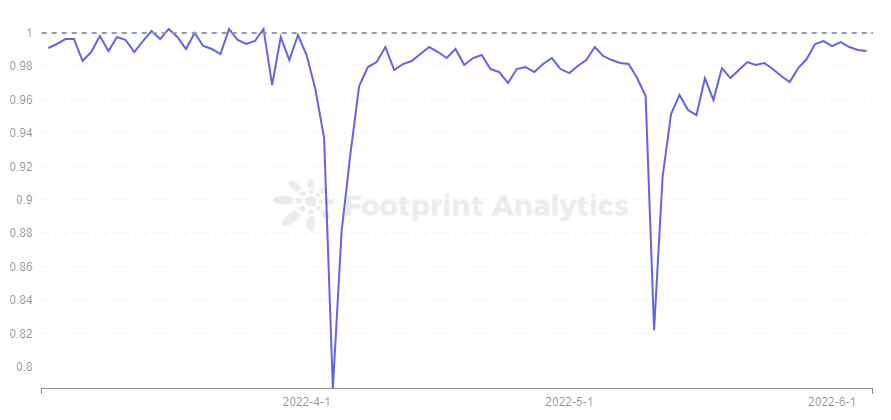
Footprint Analytics – USDN Price Trend
FRAX, which equalled UST in market cap until May 9th, also plummeted by $1 billion. Since FRAX requires both USDC and FXS to be minted, with USDC as the collateral portion and FXS as the algorithmic portion, FTAX is relatively more stable than a fully algorithmic stablecoin. Although the price of FXS also fell, FRAX rebounded after its market cap fell to $1.4 billion.
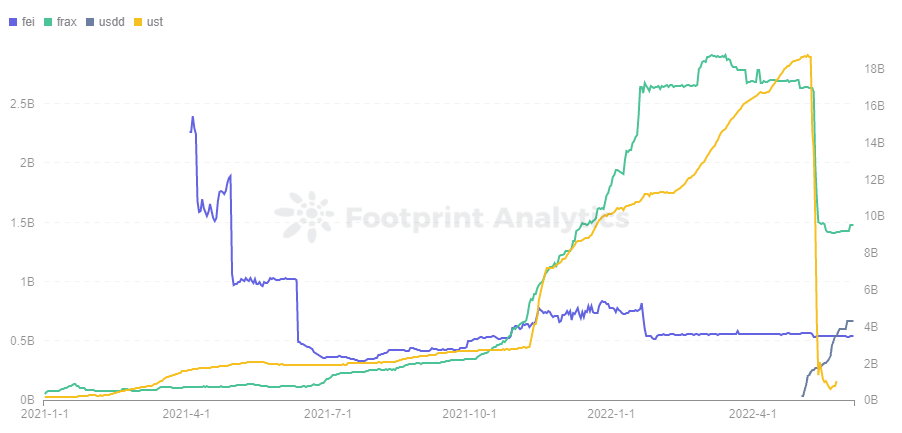
Footprint Analytics – Algorithmic Stablecoin Market Cap
FEI, which allows users to mint stablecoins with $1 in assets, is currently collateralized at 168% and about 70% of the assets in the protocol are ETH. FEI’s market cap is not large, at $500 million, and has not been affected much.
What’s notable is that while most stablecoins have fallen in market cap, USDD, a stablecoin issued by Tron, has surpassed FEI’s market cap by $670 million as of June 5, making Tron the third-largest TVL chain after Ethereum and BSC.
As seen from the success of UST, users choose stablecoins depending on security and profitability. USDD can be said to be optimized on UST, but USDD’s issuance, burning and primary market activities are managed by TRON DAO Reserve, and ordinary users can only trade USDD on the secondary market. Therefore, the stability of USDD is mainly related to the TRON DAO Reserve and its approved whitelist, and not much to do with the algorithm.
This shifts the users’ level of trust from the algorithm to TRON DAO Reserve. USDD also has a rigid interest rate of 30%, which is extremely attractive to users.
Summary
While the market for stablecoins took a big hit when UST collapsed, there is also a newfound opportunity for some protocols like USDC and USDD.
In overcollateralized stablecoins, DAI remains the first, and the gap with the once-prominent MIM has grown.
Anxieties about USDT continue, but it has so far weathered the storm.